Free with trial Percent down icon vector line logo mark or symbol set collection outline style. Art financial growth decrease vectors Percent down icon vector
Free with trial Set pop art Online sports betting, Financial growth decrease, Lucky player and Casino win icon. Vector. Art financial growth decrease vectors Set pop art Online sports betting, Financial growth decrease, Lucky player and Casino win icon. Vector
Free with trial Line Financial growth decrease icon isolated on grey background. Increasing revenue. Colorful outline concept. Vector. Art financial growth decrease vectors Line Financial growth decrease icon isolated on grey background. Increasing revenue. Colorful outline concept. Vector
Free with trial Up and Down Arrow Set with Percentage for Business and Finance and Pictogram Element Vector Illustration Isolated on Transparent Background. Art financial growth decrease vectors Percentage with Up and Down Arrow Set Icon Clip art Vector Illustration. Up and Down Arrow Set with Percentage for Business and Finance and Pictogram Element Vector Illustration Isolated on Transparent Background
Free with trial A vibrant and abstract background design featuring numerous euro symbols in black and orange. Art financial growth decrease vectors Abstract Euro Symbols Pattern on White Background. Euro Currency Icon. A vibrant and abstract background design featuring numerous euro symbols in black and. A vibrant and abstract background design featuring numerous euro symbols in black and orange.
Free with trial Nine simple black line illustrations of various charts and graphs. Art financial growth decrease vectors Collection of Hand Drawn Charts and Graphs for Data Visualization. Nine simple black line illustrations of various charts and graphs
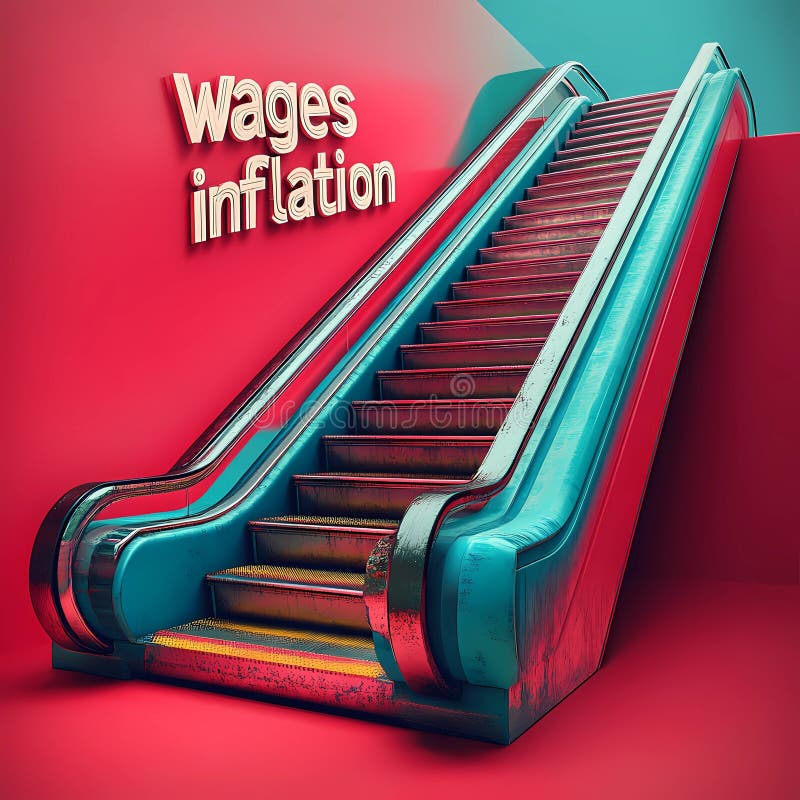
Free with trial Staircase with vibrant colors illustrates the concept of wages and inflation, emphasizing their relationship. Art financial growth decrease illustrations Visual representation highlighting wages in relation to inflation on a stylized staircase. Staircase with vibrant colors illustrates the concept of wages and inflation, emphasizing their relationship.
Free with trial The image is a digital illustration of a stock market chart. The chart is blue in color and has a line graph in the center. The line graph shows a downward trend, indicating a decrease in the stock market. On the top left corner of the chart, there is a white text that reads "10. 03570". The background of the image is made up of small white dots, which are scattered across the chart. Art financial growth decrease illustrations The image is a digital illustration of a stock market chart. The chart is blue in color and has a line graph in the center.
Free with trial Visualize the dynamic world of cryptocurrency trading with this compelling 3D illustration. A mobile phone screen dominates the composition, showcasing intricate candlestick charts alongside prominent buy and sell buttons, all set against a sophisticated dark blue background. This imagery captures the essence of online trading, finance, and investment strategies. Perfect for illustrating concepts. Art financial growth decrease illustrations Cryptocurrency trading concept displaying a mobile phone screen with candlestick charts buy and sell buttons over a dark blue. Visualize the dynamic world of cryptocurrency trading with this compelling 3D illustration. A mobile phone screen dominates the composition, showcasing intricate candlestick charts alongside prominent buy and sell buttons, all set against a sophisticated dark blue background. This imagery captures the essence of online trading, finance, and investment strategies. Perfect for illustrating concepts
Free with trial Charts and diagrams icon collection. Duotone color. Vector illustration. Containing graphic, infographic, graph, pie chart, graphs, bar chart, circular diagram, diagram, decrease, increase, with three design. Art financial growth decrease vectors Economics strategy, analysis of sales, statistic, data statistic illustration set or collection for banner, landing web page. Charts and diagrams icon collection. Duotone color. Vector illustration. Containing graphic, infographic, graph, pie chart, graphs, bar chart, circular diagram, diagram, decrease, increase, with three design
Free with trial Charts and diagrams icon collection. Duotone color. Vector illustration. Containing graphic, infographic, graph, pie chart, graphs, bar chart, circular diagram, diagram, decrease, increase, with three design. Art financial growth decrease vectors Economics strategy, analysis of sales, statistic, data statistic illustration set or collection for banner, landing web page. Charts and diagrams icon collection. Duotone color. Vector illustration. Containing graphic, infographic, graph, pie chart, graphs, bar chart, circular diagram, diagram, decrease, increase, with three design
Free with trial Charts and diagrams icon collection. Duotone color. Vector illustration. Containing graphic, infographic, graph, pie chart, graphs, bar chart, circular diagram, diagram, decrease, increase, with three design. Art financial growth decrease vectors Economics strategy, analysis of sales, statistic, data statistic illustration set or collection for banner, landing web page. Charts and diagrams icon collection. Duotone color. Vector illustration. Containing graphic, infographic, graph, pie chart, graphs, bar chart, circular diagram, diagram, decrease, increase, with three design
Free with trial Charts and diagrams icon collection. Duotone color. Vector illustration. Containing graphic, infographic, graph, pie chart, graphs, bar chart, circular diagram, diagram, decrease, increase, with three design. Art financial growth decrease vectors Economics strategy, analysis of sales, statistic, data statistic illustration set or collection for banner, landing web page. Charts and diagrams icon collection. Duotone color. Vector illustration. Containing graphic, infographic, graph, pie chart, graphs, bar chart, circular diagram, diagram, decrease, increase, with three design
Free with trial Paper cut Financial growth decrease icon isolated on green and pink background. Increasing revenue. Paper art style. Vector. Art financial growth decrease illustrations Paper cut Financial growth decrease icon isolated on green and pink background. Increasing revenue. Paper art style
Free with trial Pop art line Financial growth decrease icon isolated on color background. Increasing revenue. Vector. Art financial growth decrease illustrations Pop art line Financial growth decrease icon isolated on color background. Increasing revenue. Vector
Free with trial Set paper cut No money, Envelope with dollar symbol, Financial growth decrease and Diamond icon. Paper art style. Vector. Art financial growth decrease vectors Set paper cut No money, Envelope with dollar symbol, Financial growth decrease and Diamond icon. Paper art style. Vector
Free with trial Set paper cut Financial growth decrease, Browser with stocks market, Data analysis and icon. Paper art style. Vector. Art financial growth decrease vectors Set paper cut Financial growth decrease, Browser with stocks market, Data analysis and icon. Paper art style. Vector
Free with trial Paper cut Financial growth decrease icon isolated on grey background. Increasing revenue. Paper art style. Vector. Art financial growth decrease vectors Paper cut Financial growth decrease icon isolated on grey background. Increasing revenue. Paper art style. Vector
Free with trial Set pop art Chalkboard with diagram, Envelope dollar symbol, Price tag and Financial growth decrease icon. Vector. Art financial growth decrease vectors Set pop art Chalkboard with diagram, Envelope dollar symbol, Price tag and Financial growth decrease icon. Vector
Free with trial Set pop art Binary code, Financial growth, decrease and Data analysis icon. Vector. Art financial growth decrease vectors Set pop art Binary code, Financial growth, decrease and Data analysis icon. Vector
Free with trial Pop art Financial growth decrease icon isolated on color background. Increasing revenue. Vector. Art financial growth decrease vectors Pop art Financial growth decrease icon isolated on color background. Increasing revenue. Vector
Free with trial Set pop art Server security with padlock, Financial growth decrease, Browser stocks market and icon. Vector. Art financial growth decrease vectors Set pop art Server security with padlock, Financial growth decrease, Browser stocks market and icon. Vector
Free with trial Pop art Financial growth decrease icon isolated on color background. Increasing revenue. Vector. Art financial growth decrease illustrations Pop art Financial growth decrease icon isolated on color background. Increasing revenue. Vector
Free with trial Set pop art Financial growth decrease, Diamond, Inserting coin and Shopping cart and dollar icon. Vector. Art financial growth decrease vectors Set pop art Financial growth decrease, Diamond, Inserting coin and Shopping cart and dollar icon. Vector
Free with trial Pop art line Financial growth decrease icon isolated on color background. Increasing revenue. Vector. Art financial growth decrease vectors Pop art line Financial growth decrease icon isolated on color background. Increasing revenue. Vector
Free with trial Set paper cut Document with graph chart, Data analysis, Financial growth decrease and icon. Paper art style. Vector. Art financial growth decrease vectors Set paper cut Document with graph chart, Data analysis, Financial growth decrease and icon. Paper art style. Vector
Free with trial Set paper cut Pie chart infographic, Financial growth decrease, and icon. Paper art style. Vector. Art financial growth decrease illustrations Set paper cut Pie chart infographic, Financial growth decrease, and icon. Paper art style. Vector
Free with trial Set pop art Gold bars, Financial growth decrease, Stacks paper money cash and Inserting coin icon. Vector. Art financial growth decrease vectors Set pop art Gold bars, Financial growth decrease, Stacks paper money cash and Inserting coin icon. Vector
Free with trial Set pop art Cloud download and upload Network cloud connection Financial growth decrease and Pie chart infographic icon. Vector. Art financial growth decrease illustrations Set pop art Cloud download and upload, Network cloud connection, Financial growth decrease and Pie chart infographic
Free with trial Paper cut Financial growth decrease icon isolated on grey background. Increasing revenue. Paper art style. Vector. Art financial growth decrease vectors Paper cut Financial growth decrease icon isolated on grey background. Increasing revenue. Paper art style. Vector
Free with trial Paper cut Financial growth decrease icon isolated on grey background. Increasing revenue. Paper art style. Vector. Art financial growth decrease vectors Paper cut Financial growth decrease icon isolated on grey background. Increasing revenue. Paper art style. Vector
Free with trial Set paper cut Credit card, Piggy bank and hammer, Coin money with dollar and Financial growth decrease icon. Paper art style. Vector. Art financial growth decrease illustrations Set paper cut Credit card, Piggy bank and hammer, Coin money with dollar and Financial growth decrease icon. Paper art
Free with trial Set pop art Financial growth, decrease, Data analysis and icon. Vector. Art financial growth decrease illustrations Set pop art Financial growth, decrease, Data analysis and icon. Vector
Free with trial Paper cut Financial growth decrease icon isolated on black and red background. Increasing revenue. Paper art style. Vector. Art financial growth decrease vectors Paper cut Financial growth decrease icon isolated on black and red background. Increasing revenue. Paper art style
Free with trial Pop art Financial growth decrease icon isolated on color background. Increasing revenue. Vector. Art financial growth decrease vectors Pop art Financial growth decrease icon isolated on color background. Increasing revenue. Vector
Free with trial Set paper cut Financial growth decrease, Price tag with dollar, Safe and Mobile banking icon. Paper art style. Vector. Art financial growth decrease vectors Set paper cut Financial growth decrease, Price tag with dollar, Safe and Mobile banking icon. Paper art style. Vector
Free with trial Paper cut Financial growth decrease icon isolated on grey and black background. Increasing revenue. Paper art style. Vector. Art financial growth decrease vectors Paper cut Financial growth decrease icon isolated on grey and black background. Increasing revenue. Paper art style
Free with trial Paper cut Financial growth decrease icon isolated on grey and black background. Increasing revenue. Paper art style. Vector. Art financial growth decrease vectors Paper cut Financial growth decrease icon isolated on grey and black background. Increasing revenue. Paper art style
Free with trial Set paper cut Server Pie chart infographic Financial growth decrease and Browser with stocks market icon. Paper art style. Vector. Art financial growth decrease illustrations Set paper cut Server, Pie chart infographic, Financial growth decrease and Browser with stocks market icon. Paper art
Free with trial Paper cut Financial growth decrease icon isolated on blue and purple background. Increasing revenue. Paper art style. Vector. Art financial growth decrease illustrations Paper cut Financial growth decrease icon isolated on blue and purple background. Increasing revenue. Paper art style
Free with trial Pop art Financial growth decrease icon isolated on color background. Increasing revenue. Vector. Art financial growth decrease vectors Pop art Financial growth decrease icon isolated on color background. Increasing revenue. Vector
Free with trial Pop art Financial growth decrease icon isolated on color background. Increasing revenue. Vector. Art financial growth decrease vectors Pop art Financial growth decrease icon isolated on color background. Increasing revenue. Vector
Free with trial Pop art line Financial growth decrease icon isolated on color background. Increasing revenue. Vector. Art financial growth decrease vectors Pop art line Financial growth decrease icon isolated on color background. Increasing revenue. Vector
Free with trial Pop art line Financial growth decrease icon isolated on color background. Increasing revenue. Vector. Art financial growth decrease vectors Pop art line Financial growth decrease icon isolated on color background. Increasing revenue. Vector
Free with trial Pop art line Financial growth decrease icon isolated on color background. Increasing revenue. Vector. Art financial growth decrease illustrations Pop art line Financial growth decrease icon isolated on color background. Increasing revenue. Vector
Free with trial Pop art line Financial growth decrease icon isolated on color background. Increasing revenue. Vector. Art financial growth decrease illustrations Pop art line Financial growth decrease icon isolated on color background. Increasing revenue. Vector
Free with trial Paper cut Financial growth decrease icon isolated on grey background. Increasing revenue. Paper art style. Vector. Art financial growth decrease vectors Paper cut Financial growth decrease icon isolated on grey background. Increasing revenue. Paper art style. Vector
Free with trial Paper cut Financial growth decrease icon isolated on grey background. Increasing revenue. Paper art style. Vector. Art financial growth decrease vectors Paper cut Financial growth decrease icon isolated on grey background. Increasing revenue. Paper art style. Vector
Free with trial Paper cut Financial growth decrease icon isolated on grey background. Increasing revenue. Paper art style. Vector. Art financial growth decrease vectors Paper cut Financial growth decrease icon isolated on grey background. Increasing revenue. Paper art style. Vector
Free with trial Paper cut Financial growth decrease icon isolated on grey background. Increasing revenue. Paper art style. Vector. Art financial growth decrease vectors Paper cut Financial growth decrease icon isolated on grey background. Increasing revenue. Paper art style. Vector
Free with trial Set pop art Coin money with dollar, Online sports betting, Financial growth decrease and icon. Vector. Art financial growth decrease vectors Set pop art Coin money with dollar, Online sports betting, Financial growth decrease and icon. Vector
Free with trial Set Financial growth decrease, Wine glass, Lucky player and Football betting money. Paper art style. Vector. Art financial growth decrease vectors Set Financial growth decrease, Wine glass, Lucky player and Football betting money. Paper art style. Vector
Free with trial Set paper cut Financial growth decrease Binary code and Server icon. Paper art style. Vector. Art financial growth decrease vectors Set paper cut Financial growth decrease, Binary code and Server icon. Paper art style. Vector
Free with trial Set paper cut Mind map infographic, Financial growth decrease, Pie chart and Data analysis icon. Paper art style. Vector. Art financial growth decrease vectors Set paper cut Mind map infographic, Financial growth decrease, Pie chart and Data analysis icon. Paper art style. Vector
Free with trial Set pop art Financial growth decrease, Search data analysis, Pie chart infographic and icon. Vector. Art financial growth decrease vectors Set pop art Financial growth decrease, Search data analysis, Pie chart infographic and icon. Vector
Free with trial Set pop art Financial growth decrease, Search data analysis, Pie chart infographic and icon. Vector. Art financial growth decrease illustrations Set pop art Financial growth decrease, Search data analysis, Pie chart infographic and icon. Vector
Free with trial Set pop art Financial growth decrease, Search data analysis, Pie chart infographic and icon. Vector. Art financial growth decrease vectors Set pop art Financial growth decrease, Search data analysis, Pie chart infographic and icon. Vector
Free with trial Set line Pie chart infographic, Financial growth decrease and Hierarchy organogram. Business infographic template. Vector. Art financial growth decrease vectors Set line Pie chart infographic, Financial growth decrease and Hierarchy organogram. Business infographic template
Free with trial White line Financial growth decrease icon isolated with long shadow. Increasing revenue. Green square button. Vector. Art financial growth decrease vectors White line Financial growth decrease icon isolated with long shadow. Increasing revenue. Green square button. Vector
Free with trial Black line Financial growth decrease icon isolated on transparent background. Increasing revenue. Vector. Art financial growth decrease vectors Black line Financial growth decrease icon isolated on transparent background. Increasing revenue. Vector
Free with trial Set line Pie chart infographic, Graph, chart, diagram, Project team base and Financial growth decrease icon. Vector. Art financial growth decrease vectors Set line Pie chart infographic, Graph, chart, diagram, Project team base and Financial growth decrease icon. Vector
Free with trial Set Casino chip with dollar Hand holding casino chips Football betting money and Financial growth decrease. Paper art style. Vector. Art financial growth decrease vectors Set Casino chip with dollar, Hand holding casino chips, Football betting money and Financial growth decrease. Paper art
Free with trial White line Financial growth decrease icon isolated on blue background. Increasing revenue. Vector. Art financial growth decrease vectors White line Financial growth decrease icon isolated on blue background. Increasing revenue. Vector
Free with trial Set line Credit card with lock, Money bag, Stacks paper money cash and Financial growth decrease. Colorful square button. Vector. Art financial growth decrease illustrations Set line Credit card with lock, Money bag, Stacks paper money cash and Financial growth decrease. Colorful square button
Free with trial Set Isometric line Online shopping on screen, play video, Financial growth decrease and Browser files icon. Vector. Art financial growth decrease illustrations Set Isometric line Online shopping on screen, play video, Financial growth decrease and Browser files icon. Vector
Free with trial Isometric line Financial growth decrease icon isolated on green, blue and pink background. Increasing revenue. Square button. Vector. Art financial growth decrease vectors Isometric line Financial growth decrease icon isolated on green, blue and pink background. Increasing revenue. Square
Free with trial Glowing neon line Financial growth decrease icon isolated on brick wall background. Increasing revenue. Vector. Art financial growth decrease vectors Glowing neon line Financial growth decrease icon isolated on brick wall background. Increasing revenue. Vector
Free with trial Black line Financial growth decrease icon isolated on green and white background. Increasing revenue. Random dynamic shapes. Vector. Art financial growth decrease vectors Black line Financial growth decrease icon isolated on green and white background. Increasing revenue. Random dynamic
Free with trial Set Arrow, Factory, Financial growth decrease and Layers icon. Vector. Art financial growth decrease vectors Set Arrow, Factory, Financial growth decrease and Layers icon. Vector
Free with trial Set line Clock, Light bulb and Financial growth decrease icon. Vector. Art financial growth decrease vectors Set line Clock, Light bulb and Financial growth decrease icon. Vector
Free with trial Set line Mobile banking, Financial growth decrease, Pos terminal and Paper or financial check on black and white. Vector. Art financial growth decrease illustrations Set line Mobile banking, Financial growth decrease, Pos terminal and Paper or financial check on black and white. Vector
Free with trial Set line Target, Many ways directional arrow, Factory and Financial growth decrease. White square button. Vector. Art financial growth decrease vectors Set line Target, Many ways directional arrow, Factory and Financial growth decrease. White square button. Vector
Free with trial Line Financial growth decrease icon isolated on white background. Increasing revenue. Colorful outline concept. Vector. Art financial growth decrease vectors Line Financial growth decrease icon isolated on white background. Increasing revenue. Colorful outline concept. Vector
Free with trial Set paper cut Pie chart infographic Search cloud computing Data analysis and Financial growth decrease icon. Paper art style. Vector. Art financial growth decrease vectors Set paper cut Pie chart infographic, Search cloud computing, Data analysis and Financial growth decrease icon. Paper art
Free with trial White line Financial growth decrease icon isolated on black background. Increasing revenue. Vector. Art financial growth decrease vectors White line Financial growth decrease icon isolated on black background. Increasing revenue. Vector
Free with trial Isometric line Financial growth decrease icon isolated on purple and green background. Increasing revenue. Circle button. Vector. Art financial growth decrease vectors Isometric line Financial growth decrease icon isolated on purple and green background. Increasing revenue. Circle button
Free with trial Glowing neon line Financial growth decrease icon isolated on black background. Increasing revenue. Colorful outline concept. Vector. Art financial growth decrease vectors Glowing neon line Financial growth decrease icon isolated on black background. Increasing revenue. Colorful outline
Free with trial Set line Fast payments, ATM and money, Coin with dollar and Financial growth decrease. Business infographic template. Vector. Art financial growth decrease illustrations Set line Fast payments, ATM and money, Coin with dollar and Financial growth decrease. Business infographic template
Free with trial Isometric line Financial growth decrease icon isolated on grey background. Increasing revenue. Blue and green square button. Vector. Art financial growth decrease vectors Isometric line Financial growth decrease icon isolated on grey background. Increasing revenue. Blue and green square
Free with trial Set line Financial growth, decrease, and Binary code. Glowing neon icon. Vector. Art financial growth decrease illustrations Set line Financial growth, decrease, and Binary code. Glowing neon icon. Vector