Free with trial World stock market index fall. Financial crisis. Candlestick chart, line graph and bar chart. Stock market growth illustration. Financial market decrease background. Neon color. Vector illustration. Bar chart decrease vectors Candlestick chart, line graph and bar chart. World stock market index fall. World stock market index fall. Financial crisis. Candlestick chart, line graph and bar chart. Stock market growth illustration. Financial market decrease background. Neon color. Vector illustration
Free with trial Arabic Businessman Hold Bar chart Collapse On A Blue Background Color Illustration Design. Bar chart decrease vectors Arabic Businessman Hold Bar chart Collapse Illustration Design. Arabic Businessman Hold Bar chart Collapse On A Blue Background Color Illustration Design
Free with trial Oil gas refinery or petrochemical plant. Include arrow, graph or bar chart. Decrease trend or low of production, market price, demand, supply. Concept of business, industry, fuel, power energy. Bar chart decrease illustrations Oil gas refinery or petrochemical plant with concept of business. Oil gas refinery or petrochemical plant. Include arrow, graph or bar chart. Decrease trend or low of production, market price, demand, supply. Concept of business, industry, fuel, power energy
Free with trial World stock market index fall. Financial crisis. Candlestick chart, line graph and bar chart. Stock market growth illustration. Financial market decrease background. Neon color. Vector illustration. Bar chart decrease vectors Candlestick chart, line graph and bar chart. World stock market index fall. World stock market index fall. Financial crisis. Candlestick chart, line graph and bar chart. Stock market growth illustration. Financial market decrease background. Neon color. Vector illustration
Free with trial World stock market index fall. Financial crisis. Candlestick chart, line graph and bar chart. Stock market growth illustration. Financial market decrease background. Neon color. Vector illustration. Bar chart decrease vectors Candlestick chart, line graph and bar chart. World stock market index fall. World stock market index fall. Financial crisis. Candlestick chart, line graph and bar chart. Stock market growth illustration. Financial market decrease background. Neon color. Vector illustration
Free with trial World stock market index fall. Financial crisis. Candlestick chart, line graph and bar chart. Stock market growth illustration. Financial market decrease background. Neon color. Vector illustration. Bar chart decrease vectors Candlestick chart, line graph and bar chart. World stock market index fall. World stock market index fall. Financial crisis. Candlestick chart, line graph and bar chart. Stock market growth illustration. Financial market decrease background. Neon color. Vector illustration
Free with trial Boxes form a declining bar chart. Crisis related conceptual 3D. Bar chart decrease illustrations Boxes with dropshipping text form a declining bar chart. Crisis related conceptual 3D rendering. Boxes form a declining bar chart. Crisis related conceptual 3D
Free with trial World stock market index fall. Financial crisis. Candlestick chart, line graph, and bar chart. Stock market growth illustration. Financial market decrease background. neon light. Vector illustration. Bar chart decrease vectors Candlestick chart, line graph and bar chart. World stock market index fall. World stock market index fall. Financial crisis. Candlestick chart, line graph, and bar chart. Stock market growth illustration. Financial market decrease background. neon light. Vector illustration
Free with trial Coronavirus mosaic bar chart decrease icon and round rubber stamp watermark with Accident Investigation phrase. Mosaic vector is created with bar chart decrease icon and with scattered pandemic icons. Bar chart decrease vectors Coronavirus Mosaic Bar Chart Decrease Icon with Textured Accident Investigation Stamp. Coronavirus mosaic bar chart decrease icon and round rubber stamp watermark with Accident Investigation phrase. Mosaic vector is created with bar chart decrease icon and with scattered pandemic icons.
Free with trial Boxes form a declining bar chart. Crisis related conceptual 3D. Bar chart decrease illustrations Boxes with made in Italy text form a declining bar chart. Crisis related conceptual 3D rendering. Boxes form a declining bar chart. Crisis related conceptual 3D
Free with trial Boxes form a declining bar chart. Crisis related conceptual 3D. Bar chart decrease illustrations Boxes with made in France text form a declining bar chart. Crisis related conceptual 3D rendering. Boxes form a declining bar chart. Crisis related conceptual 3D
Free with trial Boxes form a declining bar chart. Crisis related conceptual 3D. Bar chart decrease illustrations Boxes with made in Poland text form a declining bar chart. Crisis related conceptual 3D rendering. Boxes form a declining bar chart. Crisis related conceptual 3D
Free with trial Boxes form a declining bar chart. Crisis related conceptual 3D. Bar chart decrease illustrations Boxes with made in Taiwan text form a declining bar chart. Crisis related conceptual 3D rendering. Boxes form a declining bar chart. Crisis related conceptual 3D
Free with trial Growing graph icon, graph down, reduce progress illustration, vector bar chart set, Flat icon isolated on white background. Bar chart decrease vectors Growing graph icon, graph down, reduce progress illustration, vector bar chart set, Flat icon isolated on white background
Free with trial Boxes form a declining bar chart. Crisis related conceptual 3D. Bar chart decrease illustrations Boxes with made in Australia text form a declining bar chart. Crisis related conceptual 3D rendering. Boxes form a declining bar chart. Crisis related conceptual 3D
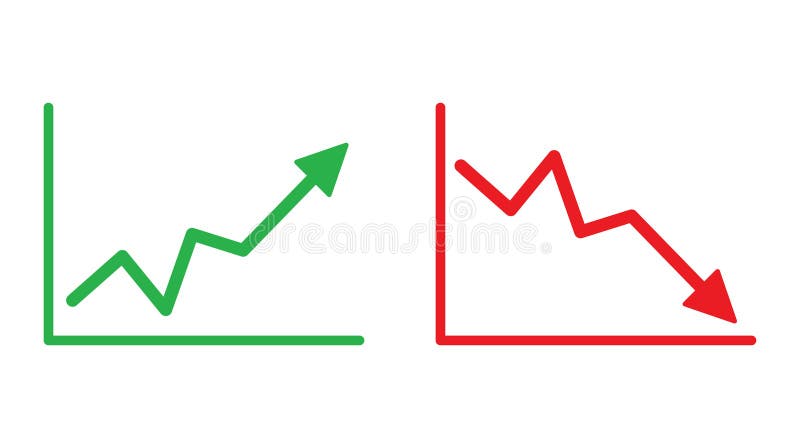
Free with trial Graph going Up and Down sign with green and red arrows vector. Flat design vector illustration concept of sales bar chart symbol icon with arrow moving down and sales bar chart with arrow moving up. Bar chart decrease vectors Graph going Up and Down sign with green and red arrows vector. Flat design vector illustration concept of sales bar chart icon. Graph going Up and Down sign with green and red arrows vector. Flat design vector illustration concept of sales bar chart symbol icon with arrow moving down and sales bar chart with arrow moving up.
Free with trial Shrinking bar chart made of pill bottles. Increasing medical expenses conceptual 3D. Bar chart decrease illustrations Shrinking bar chart made of pill bottles. Decreasing medical expenses or pharmaceutical production conceptual 3D. Shrinking bar chart made of pill bottles. Increasing medical expenses conceptual 3D
Free with trial Financial crisis. Dollar decrease. Infographic. Diagram vector icon. Declining chart. Bar chart decrease vectors Financial crisis. Dollar decrease. Infographic. Diagram vector icon. Declining chart
Free with trial Reduction Graph Linear Icon. Decrease of Graphic Bar with Arrow Down. Finance and Business Line Icon. Editable stroke. Vector illustration. Bar chart decrease vectors Reduction Graph Linear Icon. Decrease of Graphic Bar with Arrow Down. Finance and Business Line Icon. Editable stroke
Free with trial Vector illustration of Young businessman crying on bar chart feeling sad because of decreasing sales. growth decline, sales drop, loss income. Bar chart decrease vectors Young businessman crying on bar chart feeling sad because of decreasing sales. growth decline, sales drop, loss income
Free with trial Set Financial growth decrease Graph chart infographic Browser window Digital speed meter Create account screen Search engine and Online shopping on icon. Vector. Bar chart decrease vectors Set Financial growth decrease, Graph chart infographic, Browser window, Digital speed meter, Create account screen. Set Financial growth decrease Graph chart infographic Browser window Digital speed meter Create account screen Search engine and Online shopping on icon. Vector.
Free with trial Business growth up and down infographics | business graph going down | 3d graph chart decrease infographics - 4k desktop background. Bar chart decrease illustrations Business growth up and down infographics | business graph going down | 3d graph chart decrease infographics. Business growth up and down infographics | business graph going down | 3d graph chart decrease infographics - 4k desktop background
Free with trial Business growth up and down infographics | business graph going down | 3d graph chart decrease infographics - 4k desktop background. Bar chart decrease illustrations Business growth up and down infographics | business graph going down | 3d graph chart decrease infographics. Business growth up and down infographics | business graph going down | 3d graph chart decrease infographics - 4k desktop background
Free with trial Statistic line icon. Finance and unsuccessful investments. Stroke high quality symbol. Decrease icon in modern line style on white background. Arrow pointing down on graph. Green Bar Chart Icon. Bar chart decrease vectors Statistic line icon. Finance and unsuccessful investments. Stroke high quality symbol. Decrease icon in modern line style on white
Free with trial Set Cloud technology data transfer Browser setting Financial growth decrease window Graph chart infographic files and icon. Vector. Bar chart decrease vectors Set Cloud technology data transfer, Browser setting, Financial growth decrease, window, Graph chart infographic, files. Set Cloud technology data transfer Browser setting Financial growth decrease window Graph chart infographic files and icon. Vector.
Free with trial Graph going Up and Down sign with green and red arrows vector. Flat design vector illustration concept of sales bar chart symbol icon with arrow moving down and sales bar chart with arrow moving up. Bar chart decrease vectors Graph going Up and Down sign with green and red arrows vector.Flat design vector illustration concept of sales bar chart symbol. Graph going Up and Down sign with green and red arrows vector. Flat design vector illustration concept of sales bar chart symbol icon with arrow moving down and sales bar chart with arrow moving up.
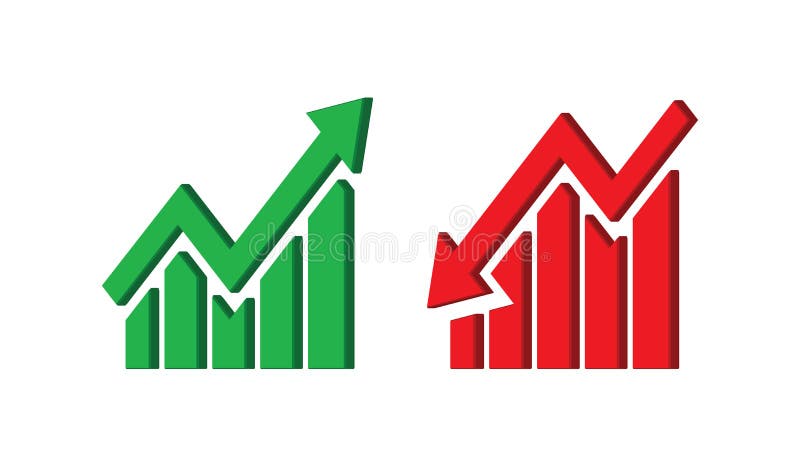
Free with trial Graph going Up and Down sign with green and red arrows vector. Flat design vector illustration concept of sales bar chart symbol icon with arrow moving down and sales bar chart with arrow moving up. Bar chart decrease vectors Graph going Up and Down sign with green and red arrows vector. Flat design vector illustration concept of sales bar chart. Graph going Up and Down sign with green and red arrows vector. Flat design vector illustration concept of sales bar chart symbol icon with arrow moving down and sales bar chart with arrow moving up.
Free with trial Graph going Up and Down sign with green and red arrows vector. Flat design vector illustration concept of sales bar chart symbol icon with arrow moving down and sales bar chart with arrow moving up. Bar chart decrease vectors Graph going Up and Down sign with green and red arrows vector. Flat design vector illustration concept of sales bar chart. Graph going Up and Down sign with green and red arrows vector. Flat design vector illustration concept of sales bar chart symbol icon with arrow moving down and sales bar chart with arrow moving up.
Free with trial Graph going Up and Down sign with green and red arrows vector. Flat design vector illustration concept of sales bar chart symbol icon with arrow moving down and sales bar chart with arrow moving up. Bar chart decrease vectors Graph going Up and Down sign with green and red arrows vector. Flat design vector illustration concept of sales bar chart symbol. Graph going Up and Down sign with green and red arrows vector. Flat design vector illustration concept of sales bar chart symbol icon with arrow moving down and sales bar chart with arrow moving up.
Free with trial Bar Chart. Covid - 19 data statistic infographic chart template. Chart of Coronavirus Covid -19 pandemic in ascending continues to decline trend. Bar chart decrease vectors Bar chart of Covid-19 developments. Bar Chart. Covid - 19 data statistic infographic chart template. Chart of Coronavirus Covid -19 pandemic in ascending continues to decline trend.
Free with trial Business chart with uptrend line graph Bar graph and bull market figures on USA flag on background, Global economic crises. Global economic recession, American financial crisis, vector, illustration. Bar chart decrease vectors Business chart with uptrend line graph Bar graph and bull market figures on USA flag on background, Global economic crises. Global
Free with trial Bar Chart. Covid - 19 data statistic infographic chart template. Chart of Coronavirus Covid -19 pandemic in stable as it continues to decline again trend. Bar chart decrease vectors Bar chart of Covid-19 developments. Bar Chart. Covid - 19 data statistic infographic chart template. Chart of Coronavirus Covid -19 pandemic in stable as it continues to decline again trend.
Free with trial Bar Chart. Covid - 19 data statistic infographic chart template. Chart of Coronavirus Covid -19 pandemic in stable trend. Bar chart decrease vectors Bar chart of Covid-19 developments. Bar Chart. Covid - 19 data statistic infographic chart template. Chart of Coronavirus Covid -19 pandemic in stable trend.
Free with trial Bar Chart. Covid - 19 data statistic infographic chart template. Chart of Coronavirus Covid -19 pandemic in ascending trend. Bar chart decrease vectors Bar chart of Covid-19 developments. Bar Chart. Covid - 19 data statistic infographic chart template. Chart of Coronavirus Covid -19 pandemic in ascending trend.
Free with trial Bar Chart. Covid - 19 data statistic infographic chart template. Chart of Coronavirus Covid -19 pandemic in decreasing trend. Bar chart decrease vectors Bar chart of Covid-19 developments. Bar Chart. Covid - 19 data statistic infographic chart template. Chart of Coronavirus Covid -19 pandemic in decreasing trend.
Free with trial Financial decline decreasing bar chart simple vector symbol. EPS vector icon. Bar chart decrease vectors Financial decline chart. Financial decline decreasing bar chart simple vector symbol. EPS vector icon
Free with trial Editable as a line illustration of a negative or downward going bar graph with a stick figure person standing on the infographic preventing the chart from going down with a rope as a small business owner in crisis. Bar chart decrease illustrations Editable line illustration of a negative downward bar graph. Editable as a line illustration of a negative or downward going bar graph with a stick figure person standing on the infographic preventing the chart from going down with a rope as a small business owner in crisis
Free with trial Business People Group Fall Down Financial Bar Chart Crisis Concept Flat Vector Illustration. Bar chart decrease vectors Business People Group Fall Down Financial Bar
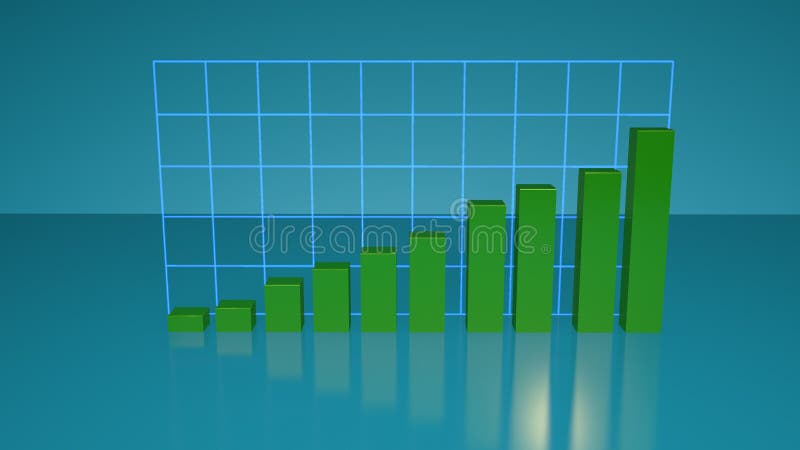
Free with trial Abstract Up and Down business bar chart on yellow color. Bar chart decrease illustrations Abstract Up and Down business chart on yellow color background. Abstract Up and Down business bar chart on yellow color
Free with trial Downward chart vector line icon isolated on white background. Bar chart going down line icon for infographic, website or app. Bar chart decrease vectors Downward chart vector line icon. Downward chart vector line icon isolated on white background. Bar chart going down line icon for infographic, website or app.
Free with trial 3D chart with bars declining icon on black background. flat style. graph chart icon for your web site design, logo, app, UI. 3D business loss symbol. 3d chart with arrow sign. decrease symbol. Bar chart decrease illustrations 3D chart with bars declining icon on black background. flat style. graph chart icon for your web site design, logo, app, UI. 3D
Free with trial Decrease thin line icon, reduction and analytics, chart sign, vector graphics, a linear pattern on a white background, eps 10. Bar chart decrease vectors Decrease thin line icon, reduction and analytics
Free with trial Downtrend line arrows with bar chart in flat icon design on yellow color background. Bar chart decrease illustrations Downtrend line arrows with bar chart in flat icon design on yellow color background
Free with trial Chart down icon. Finance stock decrease and crash, vector illustration. Bar chart decrease vectors Chart down icon
Free with trial Decrease line and glyph icon, reduction and analytics, chart sign, vector graphics, a linear pattern on a white background, eps 10. Bar chart decrease vectors Decrease line and glyph icon, reduction
Free with trial Chart line and glyph icon, finance and banking, decrease sign, vector graphics, a linear pattern on a white background, eps 10. Bar chart decrease vectors Chart line and glyph icon, finance and banking
Free with trial Decrease glyph icon, reduction and analytics, chart sign, vector graphics, a solid pattern on a white background, eps 10. Bar chart decrease vectors Decrease glyph icon, reduction and analytics
Free with trial Decrease symbol 3D illustration. 3d bar chart decrease icon. Bar chart decrease illustrations Decrease arrows 3D rendering. Red arrow graph going down. Decrease symbol 3D illustration. 3d bar chart decrease icon.
Free with trial Decrease line icon, reduction and analytics, chart sign, vector graphics, a linear pattern on a white background, eps 10. Bar chart decrease vectors Decrease line icon, reduction and analytics
Free with trial Abstract financial bar chart with red downtrend line graph on blue color background. Bar chart decrease illustrations Abstract financial bar chart with red downtrend line graph on blue color background
Free with trial Red color 3d Downtrend line arrows go down with bar chart in flat icon design on yellow color background. Bar chart decrease illustrations Red color 3d Downtrend line arrows go down with bar chart in flat icon design on yellow color background
Free with trial Icon set including chart nad graph variations. Bar graph, pie graph, line graph. Bar chart decrease vectors Icon set including chart nad graph variations.
Free with trial Bright mesh bar chart decrease with lightspot effect. White wire frame triangular mesh in vector format on a black background. Abstract 2d mesh designed with triangular lines, dots,. Bar chart decrease vectors Bright Mesh Network Bar Chart Decrease with Flare Spots. Bright mesh bar chart decrease with lightspot effect. White wire frame triangular mesh in vector format on a black background. Abstract 2d mesh designed with triangular lines, dots,
Free with trial Abstract financial background with downtrend line graph and bar chart in stock market on gradient red color. Bar chart decrease illustrations Abstract financial background with downtrend line graph and bar chart in stock market on gradient red color
Free with trial Abstract financial background with downtrend line graph and bar chart in stock market on gradient red color. Bar chart decrease illustrations Abstract financial background with downtrend line graph and bar chart in stock market on gradient red color
Free with trial Presentation screen with bar charts isolated. Flip Chart. Editable items in flat style for your web design. Part of series of accessories for work in office. Infographics. Vector illustration. Bar chart decrease vectors Presentation Screen with Bar Charts Isolated
Free with trial Abstract financial background with downtrend line graph and bar chart in stock market on gradient red color. Bar chart decrease illustrations Abstract financial background with downtrend line graph and bar chart in stock market on gradient red color
Free with trial Oil gas refinery or petrochemical plant. Include arrow, graph or bar chart. Decrease trend or low of production, market price, demand, supply. Concept of business, industry, fuel, power energy. Bar chart decrease illustrations Oil gas refinery or petrochemical plant with concept of business. Oil gas refinery or petrochemical plant. Include arrow, graph or bar chart. Decrease trend or low of production, market price, demand, supply. Concept of business, industry, fuel, power energy
Free with trial Oil gas refinery or petrochemical plant. Include arrow, graph or bar chart. Decrease trend or low of production, market price, demand, supply. Concept of business, industry, fuel, power energy. Bar chart decrease illustrations Oil gas refinery or petrochemical plant with concept of business. Oil gas refinery or petrochemical plant. Include arrow, graph or bar chart. Decrease trend or low of production, market price, demand, supply. Concept of business, industry, fuel, power energy
Free with trial Customisation, Integrity and Demand curve signs. Recovery devices, Bar diagram and Analytics chart line icons set. Student, Calendar graph symbols. Backup data, Statistics infochart. Vector. Bar chart decrease vectors Recovery devices, Bar diagram and Analytics chart icons set. Customisation, Integrity and Demand curve signs. Vector. Customisation, Integrity and Demand curve signs. Recovery devices, Bar diagram and Analytics chart line icons set. Student, Calendar graph symbols. Backup data, Statistics infochart. Vector
Free with trial Decrease population icon, Illustration isolated for graphic and web design. Simple flat symbol. Bar chart decrease vectors Loss bar chart. decline arrow isolated on white background. trend decline graph sign. Decrease population icon, Illustration isolated for graphic and web design. Simple flat symbol.
Free with trial Corona virus impact to global economy design concept. Silhouettes of businessman,doctor, people running from falling bar graph, economy collapse Illustration vector. Bar chart decrease vectors People run to avoid the falling chart. Economy collapse. Running away from collapsing fall down bar graph from coronavirus. Corona virus impact to global economy design concept. Silhouettes of businessman,doctor, people running from falling bar graph, economy collapse Illustration vector
Free with trial Flat Design Style Tax percentage decrease icon. analytics chart statistic with arrow decrease progress. Marketing report data. vector illustration. design on white background. EPS 10. Bar chart decrease vectors Flat Design Style Tax percentage decrease icon
Free with trial Young businessman walking carefully on the decreasing bar chart. Bar chart decrease vectors Businessman Walking Carefully on Decreasing Bar Chart. Young businessman walking carefully on the decreasing bar chart.
Free with trial Vector illustration of bar graph with low statistics and a red arrow pointing the decrease. Bar chart decrease vectors Vector illustration bar graph decreasing. Vector illustration of bar graph with low statistics and a red arrow pointing the decrease
Free with trial The crude oil with falling graph and gold bar symbol red arrow isolated on white background, black crude oil drop and spill, icon of crude oil price decrease and petroleum oil industry concept. Bar chart decrease vectors Crude oil with falling graph and gold bar symbol red arrow isolated on white background, black crude oil drop and spill icon. The crude oil with falling graph and gold bar symbol red arrow isolated on white background, black crude oil drop and spill, icon of crude oil price decrease and petroleum oil industry concept
Free with trial Businessman Walking Carefully on Bar Chart Concept Illustration. Businessman walking carefully on the bar chart for financial concept illustration. Bar chart decrease vectors Businessman Walking Carefully on Bar Chart Concept Illustration. Businessman walking carefully on the bar chart for financial concept illustration
Free with trial Vector illustration of the icon black color silhouette of a bar graph with a downward trend. Bar chart decrease vectors Vector illustration descending bar chart icon. Vector illustration of the icon black color silhouette of a bar graph with a downward trend
Free with trial Boxes form a declining bar chart. Crisis related conceptual 3D. Bar chart decrease illustrations Declining bar chart made with boxes with made in Japan text. Conceptual 3D rendering. Boxes form a declining bar chart. Crisis related conceptual 3D
Free with trial Set of Bar diagram, Hot sale and Bitcoin graph icons. Graph chart sign. Statistics infochart, Shopping flame, Cryptocurrency analytics. Growth report. Classic design bar diagram icon. Flat design. Bar chart decrease vectors Bar diagram, Hot sale and Bitcoin graph icons. Graph chart sign. Vector. Set of Bar diagram, Hot sale and Bitcoin graph icons. Graph chart sign. Statistics infochart, Shopping flame, Cryptocurrency analytics. Growth report. Classic design bar diagram icon. Flat design
Free with trial Liquid badges. Set of Bar diagram, Hot sale and Bitcoin graph icons. Graph chart sign. Statistics infochart, Shopping flame, Cryptocurrency analytics. Growth report. Gradient bar diagram icon. Bar chart decrease vectors Bar diagram, Hot sale and Bitcoin graph icons. Graph chart sign. Vector. Liquid badges. Set of Bar diagram, Hot sale and Bitcoin graph icons. Graph chart sign. Statistics infochart, Shopping flame, Cryptocurrency analytics. Growth report. Gradient bar diagram icon
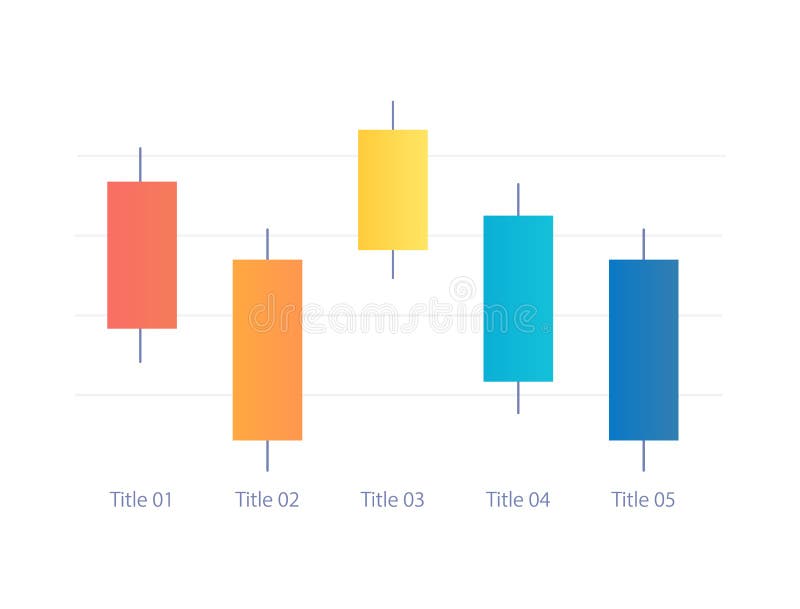
Free with trial Candlestick infographic chart design template with five categories. Price analytics. Editable infochart with vertical bar graphs. Visual data presentation. Myriad Pro-Bold, Regular fonts used. Bar chart decrease vectors Candlestick infographic chart design template with five categories
Free with trial Liquid badges. Set of Investment graph, Horizontal chart and Exchange currency icons. Loan percent sign. Investment infochart, Presentation graph, Reshresh exchange rate. Decrease rate. Vector. Bar chart decrease vectors Investment graph, Horizontal chart and Exchange currency icons. Loan percent sign. Vector. Liquid badges. Set of Investment graph, Horizontal chart and Exchange currency icons. Loan percent sign. Investment infochart, Presentation graph, Reshresh exchange rate. Decrease rate. Vector
Free with trial Package, Web report and Bar diagram signs. Diagram graph, Quick tips and 360 degrees line icons set. Hold heart, Dermatologically tested symbols. Presentation chart, Helpful tricks. Vector. Bar chart decrease vectors Diagram graph, Quick tips and 360 degrees icons set. Package, Web report and Bar diagram signs. Vector. Package, Web report and Bar diagram signs. Diagram graph, Quick tips and 360 degrees line icons set. Hold heart, Dermatologically tested symbols. Presentation chart, Helpful tricks. Vector
Free with trial Boxes form a declining bar chart. Crisis related conceptual 3D. Bar chart decrease illustrations Declining bar chart made with boxes with made in Thailand text. Conceptual 3D rendering. Boxes form a declining bar chart. Crisis related conceptual 3D
Free with trial Candlestick infographic chart design template for dark theme. Five categories. Editable infochart with vertical bar graphs. Visual data presentation. Myriad Pro-Bold, Regular fonts used. Bar chart decrease vectors Candlestick infographic chart design template for dark theme
Free with trial Business data of the currency rate chart and economics decrease and growth. Infographics with world statistics, global data showing analytical information. Bar chart decrease illustrations Business data of the currency rate chart and economics decrease and growth. Animation. Infographics with world. Business data of the currency rate chart and economics decrease and growth. Infographics with world statistics, global data showing analytical information.
Free with trial Contagious mosaic bar chart decrease icon and round corroded stamp seal with Recession phrase and clinic sign. Bar chart decrease vectors Contagious Mosaic Bar Chart Decrease Icon with Medicine Scratched Recession Seal. Contagious mosaic bar chart decrease icon and round corroded stamp seal with Recession phrase and clinic sign.
Free with trial Recovery devices, Bar diagram and Analytics chart line icons set. Customisation, Integrity and Demand curve signs. Student, Calendar graph symbols. Backup data, Statistics infochart. Vector. Bar chart decrease vectors Recovery devices, Bar diagram and Analytics chart icons set. Customisation, Integrity and Demand curve signs. Vector. Recovery devices, Bar diagram and Analytics chart line icons set. Customisation, Integrity and Demand curve signs. Student, Calendar graph symbols. Backup data, Statistics infochart. Vector
Free with trial Set of Investment graph, Horizontal chart and Exchange currency icons. Loan percent sign. Investment infochart, Presentation graph, Reshresh exchange rate. Decrease rate. Vector. Bar chart decrease vectors Investment graph, Horizontal chart and Exchange currency icons. Loan percent sign. Vector. Set of Investment graph, Horizontal chart and Exchange currency icons. Loan percent sign. Investment infochart, Presentation graph, Reshresh exchange rate. Decrease rate. Vector