Free with trial The financial data graph is rendered using a 3D rendering of the world map as a background for the declining indexes. Bar chart decrease illustrations The financial data graph is rendered using a 3D rendering of the world map as a background for the declining indexes.
Free with trial Declining bar graph, decrease bar chart solid icon, diagram concept, graph down vector sign on white background, glyph style icon for mobile concept and web design. Vector graphics. Bar chart decrease vectors Declining bar graph, decrease bar chart solid icon, diagram concept, graph down vector sign on white background, glyph
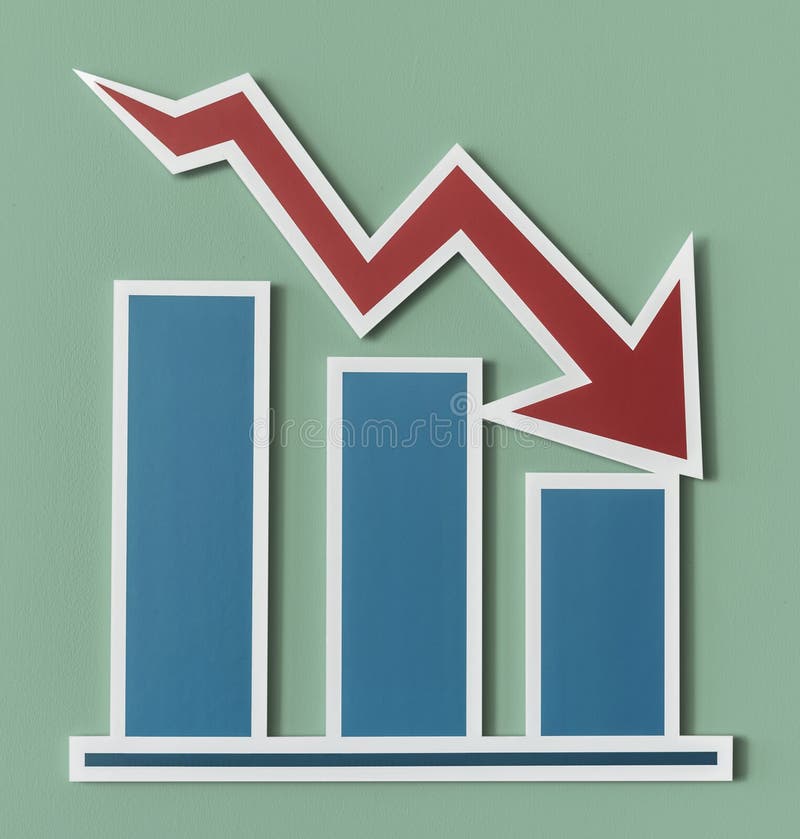
Free with trial Multicolor glossy bar chart showing decrease, with red arrow and two black axis, standing on gray background. Bar chart decrease illustrations Bar chart with axis. Multicolor glossy bar chart showing decrease, with red arrow and two black axis, standing on gray background
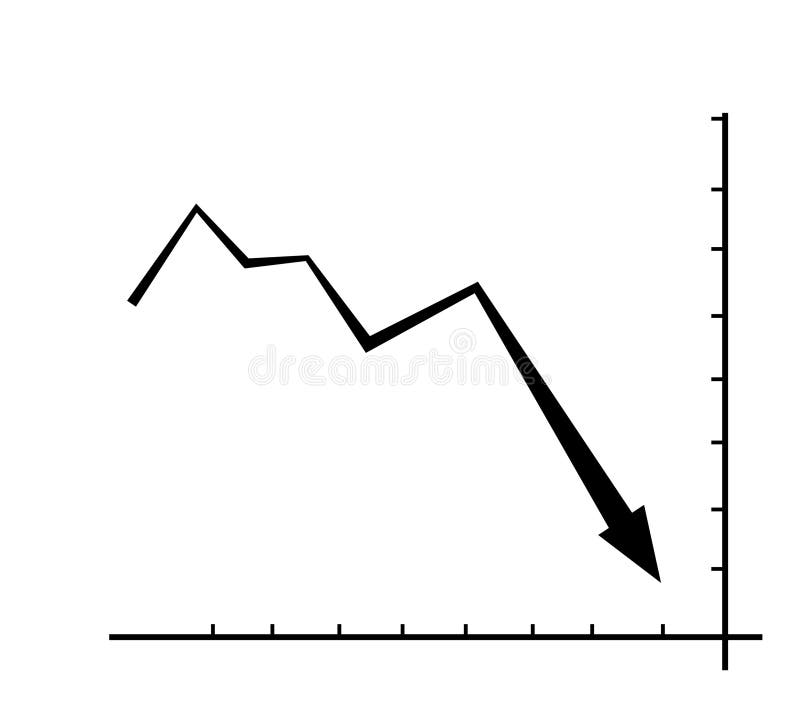
Free with trial Illustration of stock market losses. Bankrupt financial information concept with arrows pointing down. Descending trading graph. Bar chart decrease vectors Illustration of stock market losses. Bankrupt financial information concept with arrows pointing down. Descending trading graph
Free with trial Businessman holding ripped money bag and losing money bundle with coins for bankruptcy, financial crisis concept illustration clip art. Bar chart decrease vectors Businessman Holding Ripped Money Bag and Losing Money Bundle with Coins for Bankruptcy, Financial Crisis Concept Illustration
Free with trial Minimalist graph icon showing growth and fluctuation. Perfect for finance, business reports, market analysis, and data presentation projects. Bar chart decrease vectors Minimalist graph icon showing growth and fluctuation. Perfect for finance, business reports, market analysis, and data
Free with trial Computer display showing a downward trending graph depicting loss or decline in business or finance hand drawn. Bar chart decrease vectors Computer display showing a downward trending graph depicting loss or decline in business or finance hand drawn
Free with trial Bitcoin coins with red arrow down and with green growth arrow. Falling and growing price of cryptocurrency, concept. 3D rendering isolated on white background. Bar chart decrease illustrations Bitcoin coins with red arrow down and with green growth arrow. Falling and growing price of cryptocurrency, concept. 3D rendering
Free with trial Generative ai, The image shows a red bar graph and a red arrow pointing down on a red grid background, illustrating a significant downward trend. Bar chart decrease illustrations The image shows a red and white arrow pointing down in front of a red grid background with a series of 3D red bars depicting. generative ai, The image shows a red bar graph and a red arrow pointing down on a red grid background, illustrating a significant downward trend
Free with trial Stairway symbol to reach achievement. Staircase vector icon isolated on white background. The step up to be successful of business. Bar chart decrease vectors Stairway symbol to reach achievement. Staircase vector icon isolated on white background
Free with trial Stairway symbol to reach achievement. Staircase vector icon isolated on white background. The step up to be successful of business. Bar chart decrease vectors Stairway symbol to reach achievement. Staircase vector icon isolated on white background
Free with trial Stairway symbol to reach achievement. Staircase vector icon isolated on white background. The step up to be successful of business. Bar chart decrease vectors Stairway symbol to reach achievement. Staircase vector icon isolated on white background
Free with trial Set of linear graphs with red and blue lines showing different trends and dynamics vector illustration. Change in time of election results or income. For business analytics, financial reports. Bar chart decrease vectors Set of linear graphs with red and blue lines showing different trends and dynamics vector illustration. Change in time of election
Free with trial A symbolic representation of financial downturn using a bar graph decreasing in height with a dead branch as an arrow pointing down. Sand dune backdrop enhances the aridity concept. Bar chart decrease illustrations Declining profits shown by a downward trend graph in sand with a dry branch symbolizing economic crisis or recession. A symbolic representation of financial downturn using a bar graph decreasing in height with a dead branch as an arrow pointing down. Sand dune backdrop enhances the aridity concept
Free with trial Infographic world map with charts, graphs, and data visualizations for business reports, presentations, and website content, vibrant background Generative AI. Bar chart decrease illustrations Infographic world map with charts, graphs, and data visualizations for business reports, presentations, and website content
Free with trial Set line Website with stocks market Search engine Browser setting Financial growth increase window Photo retouching and mail and icon. Vector. Bar chart decrease vectors Set line Website with stocks market, Search engine, Browser setting, Financial growth increase, window, Photo retouching. Set line Website with stocks market Search engine Browser setting Financial growth increase window Photo retouching and mail and icon. Vector.
Free with trial Data analytics icons collection is a vector illustration with editable stroke. Bar chart decrease vectors Data analytics icons collection is a vector illustration with editable stroke.
Free with trial Black and white descending graph diagram. loss or decline. flat design style. Suitable for use in reports, illustrations, presentations, etc. vector design template. Bar chart decrease vectors Black and white descending graph diagram. loss or decline. flat design style. Suitable for use in reports, illustrations
Free with trial Arrows and infographic elements icons collection is a vector illustration with editable stroke. Bar chart decrease vectors Arrows and infographic elements icons collection is a vector illustration with editable stroke.
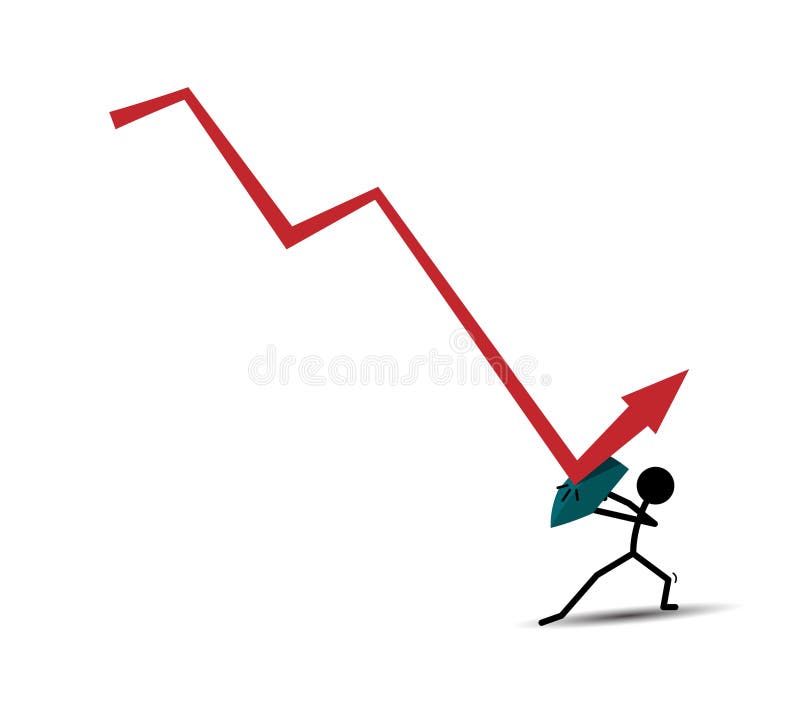
Free with trial Illustration of a graphic diagram going down and being reflected by a shield. . loss or decline. flat design style. Suitable for use in reports, illustrations, presentations, etc. vector design template. Bar chart decrease vectors Illustration of a graphic diagram going down and being reflected by a shield. . loss or decline. flat design style. Suitable for
Free with trial Infographic elements icons collection is a vector illustration with editable stroke. Bar chart decrease vectors Infographic elements icons collection is a vector illustration with editable stroke.
Free with trial Graphic diagram illustration taken down and cut using scissors. loss or decline. flat design style. Suitable for use in reports, illustrations, presentations, etc. vector design template. Bar chart decrease vectors Graphic diagram illustration taken down and cut using scissors. loss or decline. flat design style. Suitable for use in reports
Free with trial Realistic financial graphs index number analysis business investment market economy and trading concept. Generative AI glowing lines and diagram on digital screen charts crypto data blur light line. Bar chart decrease illustrations Trading market financial graphs and glowing lines diagram on digital neural network AI generated art. Realistic financial graphs index number analysis business investment market economy and trading concept. Generative AI glowing lines and diagram on digital screen charts crypto data blur light line
Free with trial Realistic financial graphs index number analysis business investment market economy and trading concept. Generative AI glowing lines and diagram on digital screen charts crypto data blur light line. Bar chart decrease illustrations Trading market financial graphs and glowing lines diagram on digital neural network AI generated art. Realistic financial graphs index number analysis business investment market economy and trading concept. Generative AI glowing lines and diagram on digital screen charts crypto data blur light line
Free with trial Realistic financial graphs index number analysis business investment market economy and trading concept. Generative AI glowing lines and diagram on digital screen charts crypto data blur light line. Bar chart decrease illustrations Trading market financial graphs and glowing lines diagram on digital neural network AI generated art. Realistic financial graphs index number analysis business investment market economy and trading concept. Generative AI glowing lines and diagram on digital screen charts crypto data blur light line
Free with trial Realistic financial graphs index number analysis business investment market economy and trading concept. Generative AI glowing lines and diagram on digital screen charts crypto data blur light line. Bar chart decrease illustrations Trading market financial graphs and glowing lines diagram on digital neural network AI generated art. Realistic financial graphs index number analysis business investment market economy and trading concept. Generative AI glowing lines and diagram on digital screen charts crypto data blur light line
Free with trial Realistic financial graphs index number analysis business investment market economy and trading concept. Generative AI glowing lines and diagram on digital screen charts crypto data blur light line. Bar chart decrease illustrations Trading market financial graphs and glowing lines diagram on digital neural network AI generated art. Realistic financial graphs index number analysis business investment market economy and trading concept. Generative AI glowing lines and diagram on digital screen charts crypto data blur light line
Free with trial Realistic financial graphs index number analysis business investment market economy and trading concept. Generative AI glowing lines and diagram on digital screen charts crypto data blur light line. Bar chart decrease illustrations Trading market financial graphs and glowing lines diagram on digital neural network AI generated art. Realistic financial graphs index number analysis business investment market economy and trading concept. Generative AI glowing lines and diagram on digital screen charts crypto data blur light line
Free with trial Realistic financial graphs index number analysis business investment market economy and trading concept. Generative AI glowing lines and diagram on digital screen charts crypto data blur light line. Bar chart decrease illustrations Trading market financial graphs and glowing lines diagram on digital neural network AI generated art. Realistic financial graphs index number analysis business investment market economy and trading concept. Generative AI glowing lines and diagram on digital screen charts crypto data blur light line
Free with trial Realistic financial graphs index number analysis business investment market economy and trading concept. Generative AI glowing lines and diagram on digital screen charts crypto data blur light line. Bar chart decrease illustrations Trading market financial graphs and glowing lines diagram on digital neural network AI generated art. Realistic financial graphs index number analysis business investment market economy and trading concept. Generative AI glowing lines and diagram on digital screen charts crypto data blur light line
Free with trial A hand interacts with a digital screen displaying financial growth trends and data visualizations for the year 2025. Bar chart decrease illustrations Analyzing financial growth trends on a digital interface. A hand interacts with a digital screen displaying financial growth trends and data visualizations for. A hand interacts with a digital screen displaying financial growth trends and data visualizations for the year 2025
Free with trial Stock market or forex trading candlestick graph in graphic design for financial investment concept. Motion. Financial data and diagrams showing increase and decrease in profits. Bar chart decrease illustrations Stock market or forex trading candlestick graph in graphic design for financial investment concept. Motion. Financial
Free with trial Stock market or forex trading candlestick graph in graphic design for financial investment concept. Motion. Financial data and diagrams showing increase and decrease in profits. Bar chart decrease illustrations Stock market or forex trading candlestick graph in graphic design for financial investment concept. Motion. Financial
Free with trial Stock market or forex trading candlestick graph in graphic design for financial investment concept. Motion. Financial data and diagrams showing increase and decrease in profits. Bar chart decrease illustrations Stock market or forex trading candlestick graph in graphic design for financial investment concept. Motion. Financial
Free with trial Pakistan GDP decreasing shown with arrows going down, business and finance concept backdrop. Bar chart decrease illustrations Pakistan GDP decreasing shown with arrows going down, business and finance concept backdrop
Free with trial Green up and red down 3d arrow graph showing rising, descending trend, business result, profit or loss symbol symbol. Business arrow, goals concept. 3d world money symbols. Financial growth. Bar chart decrease illustrations Green up and red down 3d arrow graph showing rising, descending trend, business result, 3d world money symbols. Financial growth. Green up and red down 3d arrow graph showing rising, descending trend, business result, profit or loss symbol symbol. Business arrow, goals concept. 3d world money symbols. Financial growth
Free with trial Green up and red down 3d arrow graph showing rising, descending trend, business result, profit or loss symbol symbol. Business arrow, goals concept. 3d world money symbols. Financial growth. Bar chart decrease illustrations Green up and red down 3d arrow graph showing rising, descending trend, business result, 3d world money symbols. Financial growth. Green up and red down 3d arrow graph showing rising, descending trend, business result, profit or loss symbol symbol. Business arrow, goals concept. 3d world money symbols. Financial growth
Free with trial Green up and red down 3d arrow graph showing rising, descending trend, business result, profit or loss symbol symbol. Business arrow, goals concept. 3d world money symbols. Financial growth. Bar chart decrease illustrations Green up and red down 3d arrow graph showing rising, descending trend, business result, 3d world money symbols. Financial growth. Green up and red down 3d arrow graph showing rising, descending trend, business result, profit or loss symbol symbol. Business arrow, goals concept. 3d world money symbols. Financial growth
Free with trial Silver bar precious metal going down decrease drop low decline trade market international arrow chart down vector. Bar chart decrease vectors Silver bar precious metal going down decrease drop low decline trade market international arrow chart down
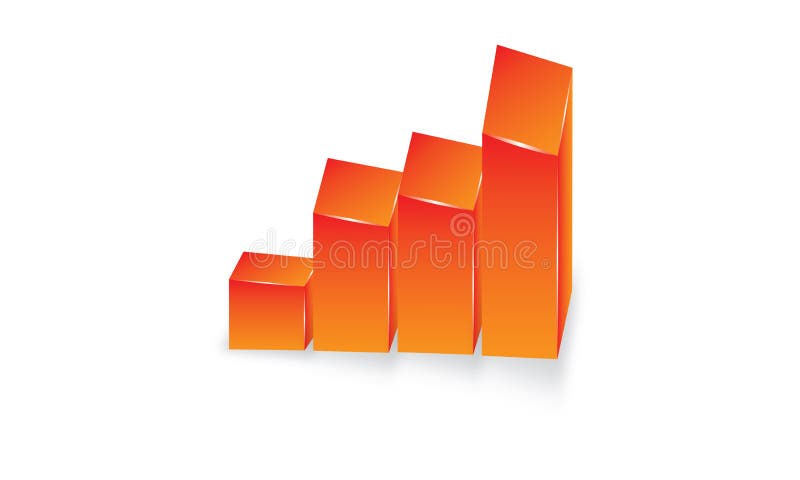
Free with trial 3d colorful bar chart increase decrease sales or purchase diagram. statistic information chart diagrams. Bar chart decrease vectors 3D Vector Colorful Increase Decrease Bar Chart Diagram. 3d colorful bar chart increase decrease sales or purchase diagram . statistic information chart diagrams
Free with trial Isometric bar chart. Decrease, drop, economic crisis, investment and failure concept. Turquoise blue background. Flat design. EPS 8 vector illustration, no transparency, no gradients. Bar chart decrease vectors Bar chart, decrease, crisis. Isometric bar chart. Decrease, drop, economic crisis, investment and failure concept. Turquoise blue background. Flat design. EPS 8 vector illustration, no transparency, no gradients
Free with trial Coronavirus. Covid19 chart. Infection bar graph. Vector illustration showing decrease in positive cases for the epidemic. Bar chart decrease vectors Coronavirus. Infection decrease bar chart. Covid19 graph. Coronavirus. Covid19 chart. Infection bar graph. Vector illustration showing decrease in positive cases for the epidemic.
Free with trial Dash Mosaic based on bar chart decrease icon. Mosaic vector bar chart decrease is formed with scattered dash items. Bonus icons are added. Bar chart decrease illustrations Line Mosaic Bar Chart Decrease. Dash Mosaic based on bar chart decrease icon. Mosaic vector bar chart decrease is formed with scattered dash items. Bonus icons are added
Free with trial Bar chart decrease mosaic of abrupt parts in different sizes and color tones, based on bar chart decrease icon. Vector tremulant parts are organized into collage. Bar chart decrease illustrations Bar chart decrease Mosaic Icon of Ragged Pieces. Bar chart decrease mosaic of abrupt parts in different sizes and color tones, based on bar chart decrease icon. Vector tremulant parts are organized into collage
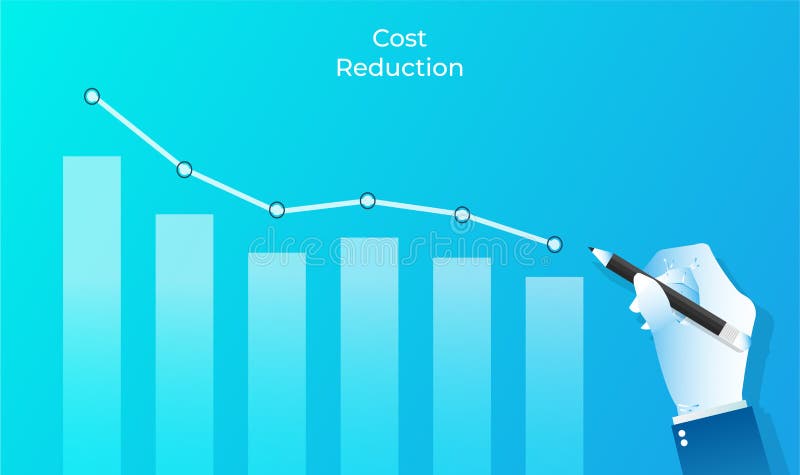
Free with trial Cost reduction design concept. Businessman drawing graph of bar chart with pencil vector illustration. Reduction or decrease extra cost and efficiencies. Bar chart decrease vectors Cost reduction design concept. Businessman drawing graph of bar chart with pencil vector illustration. Reduction or decrease extra
Free with trial Mesh bar chart decrease web icon vector illustration. Carcass model is created from bar chart decrease flat icon. Network forms abstract bar chart decrease flat carcass. Bar chart decrease illustrations Bar Chart Decrease Web Vector Mesh Illustration. Mesh bar chart decrease web icon vector illustration. Carcass model is created from bar chart decrease flat icon. Network forms abstract bar chart decrease flat carcass
Free with trial Mosaic bar chart decrease icon and rectangular rubber prints. Flat bar chart decrease mosaic icon of random rotated rectangular elements. Blue caption seal stamps with grunge textures. Bar chart decrease illustrations Bar Chart Decrease Mosaic and Scratched Rectangle Stamps. Mosaic bar chart decrease icon and rectangular rubber prints. Flat bar chart decrease mosaic icon of random rotated rectangular elements. Blue caption seal stamps with grunge textures
Free with trial Businessman showcases sustainable decrease trend on gray background bar chart Generative AI. Bar chart decrease illustrations Businessman showcases sustainable decrease trend on gray background bar chart
Free with trial Businessman presents sustainable decrease trend on bar chart with gray background Generative AI. Bar chart decrease illustrations Businessman presents sustainable decrease trend on bar chart with gray background
Free with trial Decrease bar chart analytics icon isolated on white background , Decrease bar chart. Bar chart decrease illustrations Decrease bar chart analytics icon isolated on white background
Free with trial Decrease shown in bar graph and chart. Vector illustration decorative design. Bar chart decrease vectors Decrease shown in bar graph and chart. Vector illustration decorative design
Free with trial Decrease in bar graph with pie chart on screen. Vector illustration decorative design. Bar chart decrease vectors Decrease in bar graph with pie chart on screen. Vector illustration decorative design
Free with trial Declining bar graph, decrease bar chart thin line icon, diagram concept, graph down vector sign on white background, outline style icon for mobile concept and web design. Vector graphics. Bar chart decrease vectors Declining bar graph, decrease bar chart thin line icon, diagram concept, graph down vector sign on white background
Free with trial Declining bar graph, decrease bar chart line icon, diagram concept, graph down vector sign on white background, outline style icon for mobile concept and web design. Vector graphics. Bar chart decrease vectors Declining bar graph, decrease bar chart line icon, diagram concept, graph down vector sign on white background, outline
Free with trial Declining bar graph, decrease bar chart line and solid icon, diagram concept, graph down vector sign on white background, outline style icon for mobile concept and web design. Vector graphics. Bar chart decrease vectors Declining bar graph, decrease bar chart line and solid icon, diagram concept, graph down vector sign on white background
Free with trial Gold bar precious metal going down decrease drop low decline trade market international arrow chart down vector. Bar chart decrease vectors Gold bar precious metal going down decrease drop low decline trade market international arrow chart down
Free with trial Multicolor glossy bar chart showing decrease, with euro sign on Y axis, standing on gray background, front view. Bar chart decrease illustrations Bar chart with euro. Multicolor glossy bar chart showing decrease, with euro sign on Y axis, standing on gray background, front view
Free with trial Multicolor glossy bar chart showing decrease, with dollar sign on Y axis, standing on gray background, front view. Bar chart decrease illustrations Bar chart with dollar. Multicolor glossy bar chart showing decrease, with dollar sign on Y axis, standing on gray background, front view
Free with trial Multicolor glossy bar chart showing decrease, with yuan sign on Y axis, standing on gray background, front view. Bar chart decrease illustrations Bar chart with yuan. Multicolor glossy bar chart showing decrease, with yuan sign on Y axis, standing on gray background, front view
Free with trial Multicolor glossy bar chart of yuans showing decrease, standing on gray background. Bar chart decrease illustrations Bar chart of yuans
Free with trial Multicolor glossy bar chart of ruble signs showing decrease, standing on gray background. Bar chart decrease illustrations Bar chart of rubles. Multicolor glossy bar chart of ruble signs showing decrease, standing on gray background
Free with trial Multicolor glossy bar chart of euro signs showing decrease, standing on gray background. Bar chart decrease illustrations Bar chart of euros. Multicolor glossy bar chart of euro signs showing decrease, standing on gray background
Free with trial Multicolor glossy bar chart showing decrease, with ruble sign on Y axis, standing on gray background, front view. Bar chart decrease illustrations Bar chart with ruble. Multicolor glossy bar chart showing decrease, with ruble sign on Y axis, standing on gray background, front view
Free with trial Multicolor glossy bar chart of dollar signs showing decrease, standing on gray background. Bar chart decrease illustrations Bar chart of dollars. Multicolor glossy bar chart of dollar signs showing decrease, standing on gray background
Free with trial An abstract concept representing dwindling achievements. An image of a bar chart with stacked blocks. Descent and decrease. 3D rendering. text space. cool blue background. Bar chart decrease illustrations An abstract concept representing dwindling achievements. An image of a bar chart with stacked blocks.
Free with trial MInus growths chart collection. Deficit symbol. Bar diagram. Fail growth arrow icon. Non progress symbol. Chart decrease - stock vector. Bar chart decrease vectors Decreasing chart with bar, arrow, and Rupiah symbol. MInus growths chart collection. Deficit symbol. Bar diagram. Fail growth arrow icon. Non progress symbol. Chart decrease - stock vector.
Free with trial Mosaic bar chart decrease and distressed stamp seals with Drain the Swamp phrase. Mosaic vector bar chart decrease is formed with random oval elements. Drain the Swamp seals use blue color. Bar chart decrease illustrations Elliptic Mosaic Bar Chart Decrease with Scratched Drain the Swamp Seals. Mosaic bar chart decrease and distressed stamp seals with Drain the Swamp phrase. Mosaic vector bar chart decrease is formed with random oval elements. Drain the Swamp seals use blue color
Free with trial Corona covid-19 virus infections decrease when vaccine is available - injection into chart bar numbers decrease Vector illustration. Bar chart decrease vectors Corona Covid-19 virus infections decrease when vaccine available injection chart. Corona covid-19 virus infections decrease when vaccine is available - injection into chart bar numbers decrease Vector illustration
Free with trial Mesh bar chart decrease model icon. Wire frame triangular mesh of vector bar chart decrease isolated on a white background. Abstract 2d mesh built from triangular lines and dots. Bar chart decrease vectors Bar Chart Decrease Vector Mesh Carcass Model. Mesh bar chart decrease model icon. Wire frame triangular mesh of vector bar chart decrease isolated on a white background. Abstract 2d mesh built from triangular lines and dots.
Free with trial Chart of financial decline with a trend line chart. Global economic crisis, global recession, decrease graph. World map with bar chart. Profit down. Vector illustration isolated on white background. Bar chart decrease vectors Chart of financial decline with a trend line chart. Global economic crisis, global recession, decrease graph. World map with bar c
Free with trial Glowing mesh bar chart decrease icon with sparkle effect. Abstract illuminated model of bar chart decrease. Shiny wire carcass triangular mesh bar chart decrease icon. Bar chart decrease illustrations Flare Mesh 2D Bar Chart Decrease Icon with Flare Spots. Glowing mesh bar chart decrease icon with sparkle effect. Abstract illuminated model of bar chart decrease. Shiny wire carcass triangular mesh bar chart decrease icon
Free with trial Bar chart decrease composition of small circles in different sizes and color tints, based on bar chart decrease icon. Vector small circles are united into blue illustration. Bar chart decrease vectors Bar chart decrease Composition Icon of Round Dots. Bar chart decrease composition of small circles in different sizes and color tints, based on bar chart decrease icon. Vector small circles are united into blue illustration.
Free with trial Vector bar chart decrease icon in dispersed, pixelated halftone and undamaged entire variants. Disappearing effect uses square scintillas and horizontal gradient from red to black. Bar chart decrease vectors Dissolving Pixel Halftone Bar Chart Decrease Icon. Vector bar chart decrease icon in dispersed, pixelated halftone and undamaged entire variants. Disappearing effect uses square scintillas and horizontal gradient from red to black.
Free with trial Bright mesh bar chart decrease with lightspot effect. Abstract illuminated model of bar chart decrease icon. Bar chart decrease vectors Bright Mesh Network Bar Chart Decrease with Light Spots. Bright mesh bar chart decrease with lightspot effect. Abstract illuminated model of bar chart decrease icon.
Free with trial Mosaic bar chart decrease and rubber stamp watermark with Broken Down phrase. Mosaic vector is composed from bar chart decrease icon and with randomized spheric spots. Bar chart decrease vectors Collage Bar Chart Decrease with Textured Broken Down Seal. Mosaic bar chart decrease and rubber stamp watermark with Broken Down phrase. Mosaic vector is composed from bar chart decrease icon and with randomized spheric spots.
Free with trial Colorful cylinders. Bar graph, column chart elements for finance statistical infographic. Growth or decrease signs. Vector 3d illustration. Bar chart decrease vectors Colorful cylinders. Bar graph, column chart elements for finance statistical infographic. Growth or decrease signs
Free with trial Colorful and white cylinders. Bar graph, column chart elements for finance statistical infographic. Growth and decrease signs. Vector 3d illustration. Bar chart decrease vectors Colorful and white cylinders. Bar graph, column chart elements for finance statistical infographic. Growth and decrease
Free with trial World stock market index fall. Financial crisis. Candlestick chart, line graph and bar chart. Stock market growth illustration. Financial market decrease background. Neon color. Vector illustration. Bar chart decrease vectors Candlestick chart, line graph and bar chart. World stock market index fall. World stock market index fall. Financial crisis. Candlestick chart, line graph and bar chart. Stock market growth illustration. Financial market decrease background. Neon color. Vector illustration
Free with trial Chart of financial decline with a trend line chart. Global economic crisis, global recession, decrease graph. World map with bar chart. Profit down. Vector illustration on dark blue background. Bar chart decrease vectors Chart of financial decline with a trend line chart. Global economic crisis, global recession, decrease graph.
Free with trial Declining business report bar chart illustration. Bar chart decrease illustrations Declining business report bar chart illustration