Free with trial House icon on wooden cube from stack block with percent and rise arrow, Real estate property investment concept. Asset management, Interest rates, inflation, loan mortgage, increase tax. 3d render. Blocks decrease illustrations House icon on wooden cube from stack block with percent and rise arrow
Free with trial Word "RISK" on decrease business graph step, finance diagram with down arrows on white blocks on red background. Financial crisis, bankruptcy, loss investment economic recession sales risk concepts. Blocks decrease illustrations Word \'RISK\' on decrease business graph step, finance diagram with down arrows on white blocks on red background. Word "RISK" on decrease business graph step, finance diagram with down arrows on white blocks on red background. Financial crisis, bankruptcy, loss investment economic recession sales risk concepts.
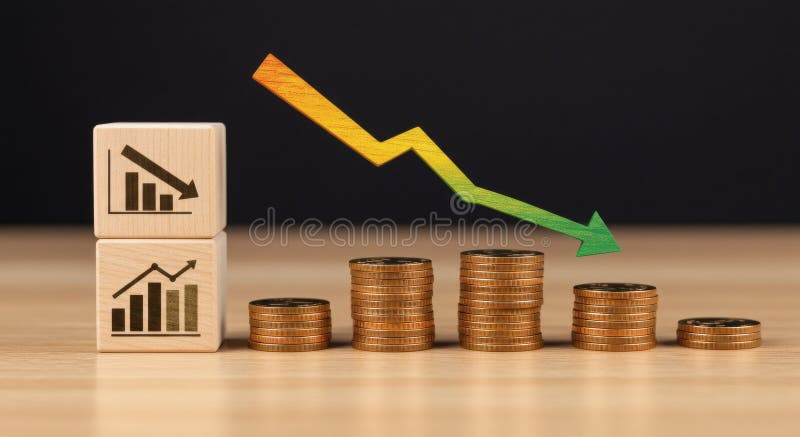
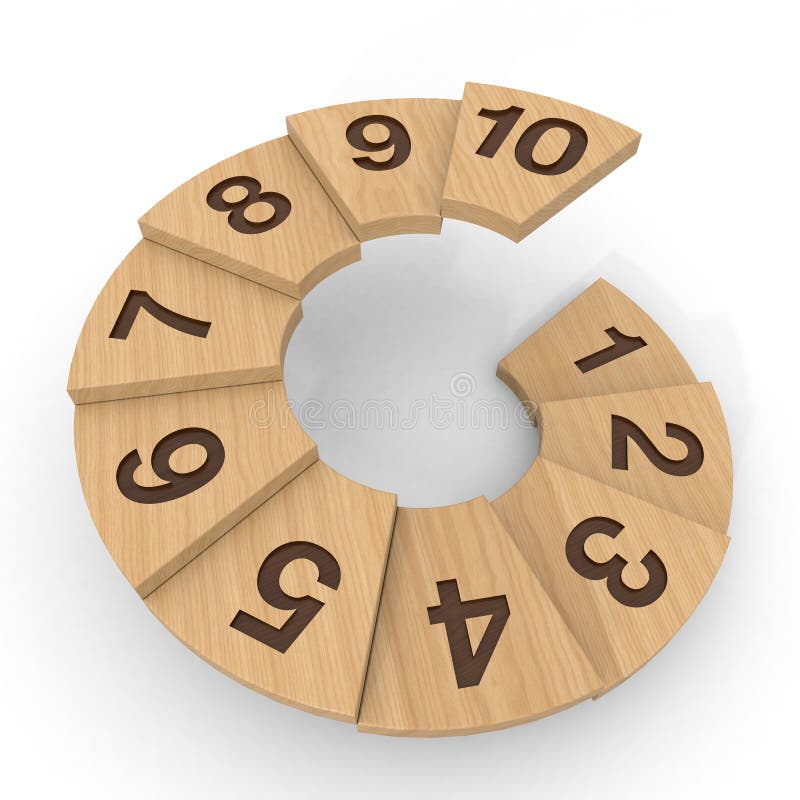
Free with trial Tree figures. Hit the number. Make an order. 3D rendering blocks. Make statistics graphs. calculate. The result is out. Assign a number. Increase or decrease in number. Blocks decrease illustrations Tree pie chart. Add numbers. 3D rendering. Tree figures. Hit the number. Make an order. 3D rendering blocks. Make statistics graphs. calculate. The result is out. Assign a number. Increase or decrease in number.
Free with trial The image depicts a pyramid-like structure composed of cubes that decrease in size as they ascend. The bottom layer consists of larger cubes in shades of red, purple, and blue, gradually transitioning to smaller cubes in green, yellow, and red at the top. Each layer is centered and forms a smaller square than the one below it, creating a visually appealing gradient effect. Blocks decrease illustrations Colorful pyramid structure made of stacked cubes in descending layers. The image depicts a pyramid-like structure composed of cubes that decrease in size as they ascend. The bottom layer consists of larger cubes in shades of red, purple, and blue, gradually transitioning to smaller cubes in green, yellow, and red at the top. Each layer is centered and forms a smaller square than the one below it, creating a visually appealing gradient effect
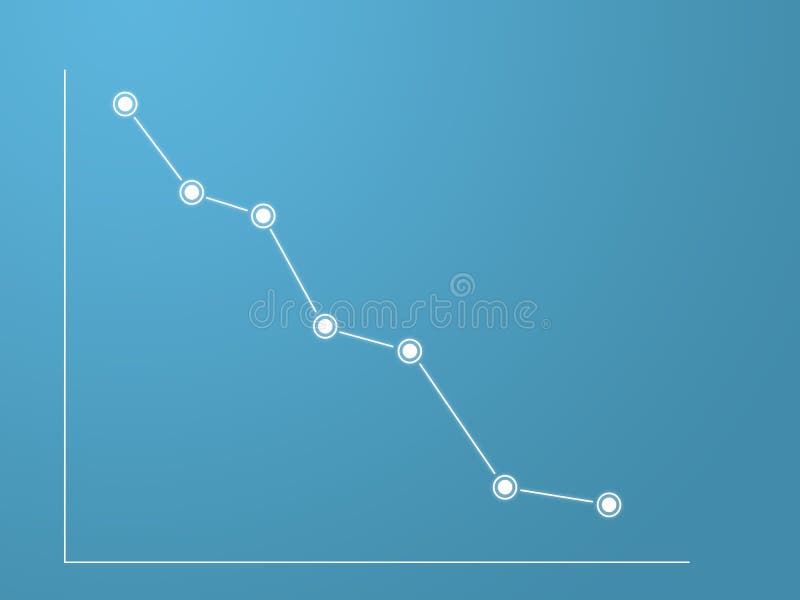
Free with trial A blue zig zag line represents a stock market graph that rises and falls. It is placed upon a financial square grid of many small blocks with color changing from red to blue. Blocks decrease illustrations Stock Market Graph Showing Trending Line on Financial Grid During Daytime. A blue zig zag line represents a stock market graph that rises and falls. It is placed upon a financial square grid of many small blocks with color changing from red to blue.
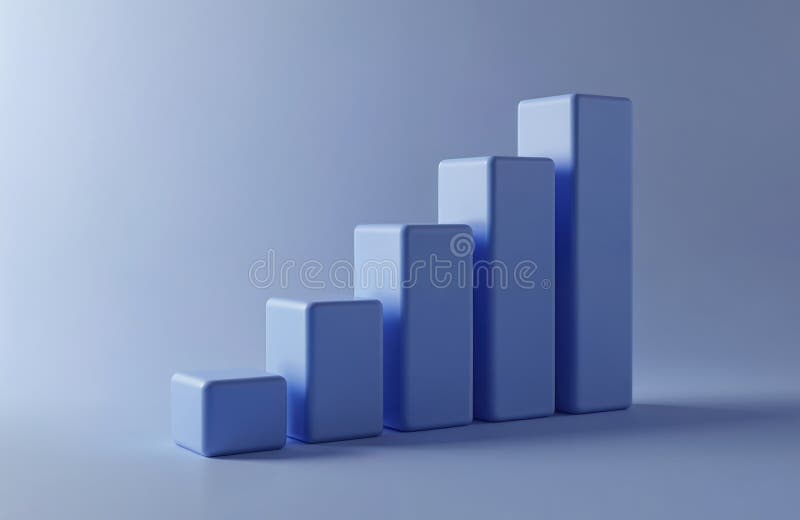
Free with trial Three-dimensional cubes arranged in a bar chart formation, representing data or progress. The cubes are colored blue, green, and pink, and are positioned in descending order of height from left to right. They are rendered with soft edges and cast subtle shadows on the white background. Blocks decrease illustrations Three 3D Bar Chart Cubes in Ascending Order Keywords: bar chart, graph, data, statistics. Three-dimensional cubes arranged in a bar chart formation, representing data or progress. The cubes are colored blue, green, and pink, and are positioned in descending order of height from left to right. They are rendered with soft edges and cast subtle shadows on the white background
Free with trial This 3D rendered image presents a simple bar chart composed of four colored cubes: blue, yellow, red, and white. The cubes are arranged in ascending order of height from left to right, with the red cube being the tallest. They stand on a plain white surface, creating a clean and minimalist visual. The image is isolated on a white background. Blocks decrease illustrations 3D Bar Chart with Blue Yellow Red and White Cubes on White Background graph data. This 3D rendered image presents a simple bar chart composed of four colored cubes: blue, yellow, red, and white. The cubes are arranged in ascending order of height from left to right, with the red cube being the tallest. They stand on a plain white surface, creating a clean and minimalist visual. The image is isolated on a white background
Free with trial A high-quality conceptual image featuring a row of smooth wooden cubes spelling the word "PESSIMISM" on a wooden surface. The arrangement includes a stacked block showing a sad face emoticon and a downward-sloping line graph, symbolizing financial loss, recession, negative market sentiment, and psychological discouragement in a professional or personal context. Blocks decrease illustrations Wooden Blocks Spelling Pessimism with Sad Face Icon and Downward Trend Graph. A high-quality conceptual image featuring a row of smooth wooden cubes spelling the word "PESSIMISM" on a wooden surface. The arrangement includes a stacked block showing a sad face emoticon and a downward-sloping line graph, symbolizing financial loss, recession, negative market sentiment, and psychological discouragement in a professional or personal context.
Free with trial A 3D rendering of the word "SOCIAL RECESSION" with human figurine structures scattered in the background. Blocks decrease illustrations The word \'SOCIAL RECESSION\' with scattered human figurine structures. A 3D rendering of the word "SOCIAL RECESSION" with human figurine structures scattered in the background.
Free with trial A 3D rendering of the word "SOCIAL RECESSION" with human figurine structures scattered in the background. Blocks decrease illustrations The word \'SOCIAL RECESSION\' with scattered human figurine structures. A 3D rendering of the word "SOCIAL RECESSION" with human figurine structures scattered in the background.
Free with trial A 3D rendering of the word "SOCIAL RECESSION" with human figurine structures scattered in the background. Blocks decrease illustrations The word \'SOCIAL RECESSION\' with scattered human figurine structures. A 3D rendering of the word "SOCIAL RECESSION" with human figurine structures scattered in the background.
Free with trial A 3D rendering of the word "SOCIAL RECESSION" with human figurine structures scattered in the background. Blocks decrease illustrations The word \'SOCIAL RECESSION\' with scattered human figurine structures. A 3D rendering of the word "SOCIAL RECESSION" with human figurine structures scattered in the background.
Free with trial A 3D rendering of the word "SOCIAL RECESSION" with human figurine structures scattered in the background. Blocks decrease illustrations The word \'SOCIAL RECESSION\' with scattered human figurine structures. A 3D rendering of the word "SOCIAL RECESSION" with human figurine structures scattered in the background.
Free with trial A 3D rendering of the word "SOCIAL RECESSION" with human figurine structures scattered in the background. Blocks decrease illustrations The word \'SOCIAL RECESSION\' with scattered human figurine structures. A 3D rendering of the word "SOCIAL RECESSION" with human figurine structures scattered in the background.
Free with trial Abstract white block chart representing data or business decline on light background. Blocks decrease illustrations Abstract white block chart representing data or business decline on light background
Free with trial This image depicts the concept of declining consumer price index. Stack of coins with a falling red arrow showcase financial loss. Wooden blocks spell CPI. The visual is ideal for illustrating economic downturn, market correction, inflation reduction, budget concerns, finance, recession and investme. Blocks decrease illustrations Consumer Price Index Decline: Economic Downturn and Financial Loss Indicated by Coins and Arrow. This image depicts the concept of declining consumer price index. Stack of coins with a falling red arrow showcase financial loss. Wooden blocks spell CPI. The visual is ideal for illustrating economic downturn, market correction, inflation reduction, budget concerns, finance, recession and investme
Free with trial Wooden blocks display plus minus and question mark symbols representing decision making choices uncertainty problem solving and evaluation for business finance or personal life planning. Blocks decrease illustrations Question mark plus minus decision choice uncertainty confusion problem solution math sign symbol calculation evaluation assessment. Wooden blocks display plus minus and question mark symbols representing decision making choices uncertainty problem solving and evaluation for business finance or personal life planning.
Free with trial Bid is spelled out with wooden blocks on top of a financial chart with stacks of coins in the background representing investment opportunity financial growth and strategic business planning for futur. Blocks decrease illustrations Bid investment finance money growth success strategy market opportunity auction competition offer proposal deal price value econom. Bid is spelled out with wooden blocks on top of a financial chart with stacks of coins in the background representing investment opportunity financial growth and strategic business planning for futur
Free with trial A 3D bar chart made of red and blue cubes arranged in ascending and descending steps against a white background. Blocks decrease illustrations 3D Red and Blue Cubes Arranged in Ascending Bar Chart Formation on White graph data. A 3D bar chart made of red and blue cubes arranged in ascending and descending steps against a white background
Free with trial Interest rate changes on timber cubes. Green arrow up and red arrow down symbols. Finance concept for investment growth and decline. Business metaphor icons. Blocks decrease illustrations Wooden blocks with percentage sign and arrows represent financial market fluctuation. Interest rate changes on timber cubes. Green arrow up and red arrow down. Interest rate changes on timber cubes. Green arrow up and red arrow down symbols. Finance concept for investment growth and decline. Business metaphor icons
Free with trial The image displays a pyramid structure composed of rectangular bricks arranged in descending layers. The bricks exhibit a weathered appearance with a gradient of browns and maroon shades, giving it a rustic and aged look. The bottom layers are larger and gradually decrease in size as they ascend, forming a stable and visually appealing geometric shape. Blocks decrease illustrations A pyramid made of stacked rectangular bricks in a rustic brown and maroon color scheme. The image displays a pyramid structure composed of rectangular bricks arranged in descending layers. The bricks exhibit a weathered appearance with a gradient of browns and maroon shades, giving it a rustic and aged look. The bottom layers are larger and gradually decrease in size as they ascend, forming a stable and visually appealing geometric shape
Free with trial 3D rendering showing falling gold coins and a downward trending graph, symbolizing financial market decline. Blocks decrease illustrations Financial Market Decline: Visual Representation of Decreasing Value and Economic Downturn. 3D rendering showing falling gold coins and a downward trending graph, symbolizing financial market decline
Free with trial This image visually represents the concept of artificial intelligence (AI) driving down business costs. Building blocks spell out 'COST' with down arrows, symbolizing reduction, while a hand places an 'AI' block, illustrating AI's role in this cost optimization. Blocks decrease illustrations AI Reduces Costs - Business Growth Efficiency with Artificial Intelligence. This image visually represents the concept of artificial intelligence (AI) driving down business costs. Building blocks spell out 'COST' with down arrows, symbolizing reduction, while a hand places an 'AI' block, illustrating AI's role in this cost optimization.
Free with trial Descending bar graph on blue background. 3D render data visualization. Financial market chart, business analysis concept. Economic loss, falling sales, statistics. Ideal for. Blocks decrease illustrations Descending bar graph on blue background. 3D render data visualization. Financial market chart, business analysis concept.
Free with trial Image depicting a financial crisis with stacks of gold coins decreasing in size, accompanied by a red downward-pointing arrow symbolizing a market downturn. Blocks decrease illustrations Financial Crisis: Decreasing Market Trend Visualized with Gold Coins and a Red Downward Arrow. Image depicting a financial crisis with stacks of gold coins decreasing in size, accompanied by a red downward-pointing arrow symbolizing a market downturn
Free with trial A 3D bar graph displays a downward trend represented by a red arrow. The bars are composed of orange, green, and red cubes, illustrating fluctuating data points. The overall mood is one of decline or setback. Blocks decrease illustrations Red Arrow Downward Trend Chart Showing Decreasing Business Growth Statistics with Green Orange. A 3D bar graph displays a downward trend represented by a red arrow. The bars are composed of orange, green, and red cubes, illustrating fluctuating data points. The overall mood is one of decline or setback
Free with trial Image depicting a downward trend in business costs, visualized with wooden blocks spelling 'COST' and a falling graph. Blocks decrease illustrations Decreasing Business Costs: Financial Strategy and Economic Downturn Impact on Expenses. Image depicting a downward trend in business costs, visualized with wooden blocks spelling 'COST' and a falling graph
Free with trial A wooden block tower with a red arrow pointing upwards. The blocks are stacked in a pyramid shape generated by AI. Blocks decrease vectors A wooden block tower with a red arrow pointing upwards generated by AI. A wooden block tower with a red arrow pointing upwards. The blocks are stacked in a pyramid shape generated by AI
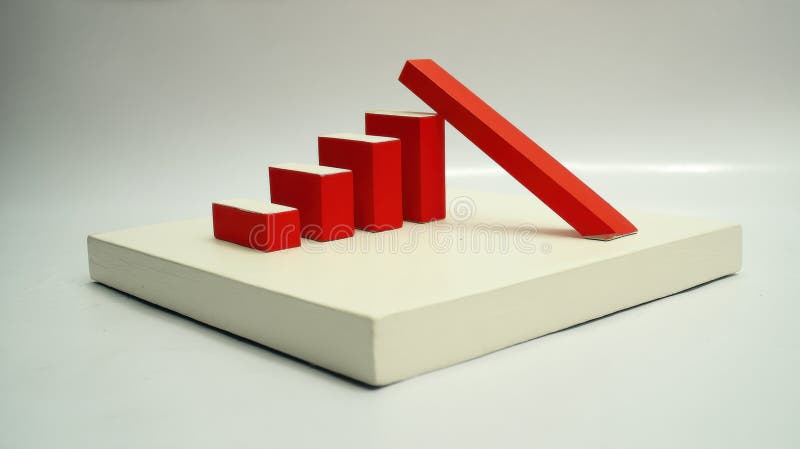
Free with trial This image shows a 3D model of a bar graph, where one bar is falling, symbolizing decline or failure. This striking visual representation was generated by AI, offering a unique perspective on downward trends and economic instability. The clean design makes it ideal for illustrating various concepts. Blocks decrease illustrations Falling Bar Graph. This image shows a 3D model of a bar graph, where one bar is falling, symbolizing decline or failure. This striking visual representation was generated by AI, offering a unique perspective on downward trends and economic instability. The clean design makes it ideal for illustrating various concepts
Free with trial This image showcases a colorful bar graph with a downward-pointing arrow, generated by AI, illustrating a negative trend or decline. The vibrant colors and simplistic design make the message clear and easily understood. The image is perfect for representing economic downturns, market dips, or any s. Blocks decrease illustrations Downward Trend Visualization. This image showcases a colorful bar graph with a downward-pointing arrow, generated by AI, illustrating a negative trend or decline. The vibrant colors and simplistic design make the message clear and easily understood. The image is perfect for representing economic downturns, market dips, or any s
Free with trial This image shows a simple isometric bar graph, generated by AI. It features four black bars of varying heights against a white background, suitable for use as a minimalist graphic or logo. The clean design allows for versatile application in various contexts. Blocks decrease illustrations AI-Generated Isometric Bar Graph. This image shows a simple isometric bar graph, generated by AI. It features four black bars of varying heights against a white background, suitable for use as a minimalist graphic or logo. The clean design allows for versatile application in various contexts.
Free with trial This image shows a 3D red arrow pointing downwards, disintegrating into cubes. It's a powerful visual representation of decline or failure, generated by AI, ideal for illustrating concepts like market crashes or economic downturns. Blocks decrease illustrations Collapsing Red Arrow. This image shows a 3D red arrow pointing downwards, disintegrating into cubes. It's a powerful visual representation of decline or failure, generated by AI, ideal for illustrating concepts like market crashes or economic downturns.
Free with trial Wooden blocks with symbol of economic crash concept on blue background. Blocks decrease illustrations Concept of economic crash. Wooden blocks with symbol of economic crash concept on blue background
Free with trial Wooden blocks with symbol of economic crisis concept on blue background. Blocks decrease illustrations Concept of economic crisis. Wooden blocks with symbol of economic crisis concept on blue background
Free with trial Alignment icon Flat set in black and white color outline vector. Blocks decrease vectors Alignment icon Flat set in black and white color
Free with trial Simple wooden house and percentage block, depicting concepts of mortgage and interest rates. 3D Render. Blocks decrease illustrations Simple wooden house and percentage block, depicting concepts of mortgage and interest rates
Free with trial A vibrant, 3D bar graph with colorful blocks rises against a white background. This modern infographic uses geometric shapes to represent data trends, making it a perfect visual for presentations, rep. Blocks decrease illustrations Colorful Bar Graph. A vibrant, 3D bar graph with colorful blocks rises against a white background. This modern infographic uses geometric shapes to represent data trends, making it a perfect visual for presentations, rep
Free with trial A conceptual 3D illustration depicting a white growth arrow on a collapsing bar chart. The crumbling blocks and debris symbolize a dramatic failure or downturn. This powerful metaphor represents concepts such as financial crisis, economic recession, stock market crash, business bankruptcy, or unsustainable growth built on a fragile foundation. The minimalist gray background focuses attention on the central theme of collapse and risk, making it ideal for financial reports, business presentations, and articles about economic instability. Blocks decrease illustrations Economic Crisis and Crumbling Growth Chart. A conceptual 3D illustration depicting a white growth arrow on a collapsing bar chart. The crumbling blocks and debris symbolize a dramatic failure or downturn. This powerful metaphor represents concepts such as financial crisis, economic recession, stock market crash, business bankruptcy, or unsustainable growth built on a fragile foundation. The minimalist gray background focuses attention on the central theme of collapse and risk, making it ideal for financial reports, business presentations, and articles about economic instability.
Free with trial White Bar Chart Decreasing on Blue Background. Blocks decrease illustrations White Bar Chart Decreasing on Blue Background
Free with trial A hand is shown placing the final wooden block to complete a percentage symbol, symbolizing financial concepts and business decisions. Blocks decrease illustrations Hand placing wooden blocks to form a percentage symbol. A hand is shown placing the final wooden block to complete a percentage symbol, symbolizing financial concepts and business decisions
Free with trial A 3D rendered bar chart composed of four colored blocks of varying heights. The blocks are blue, yellow, red, and white, arranged from shortest to tallest from left to right. The chart is presented on a clean white background, with subtle shadows beneath the blocks. Blocks decrease illustrations Colorful 3D Bar Chart with Varying Heights on a White Background graph statistics. A 3D rendered bar chart composed of four colored blocks of varying heights. The blocks are blue, yellow, red, and white, arranged from shortest to tallest from left to right. The chart is presented on a clean white background, with subtle shadows beneath the blocks
Free with trial This image features a vibrant 3D representation of a bar chart, composed of translucent, glowing blocks in shades of pink, yellow, and cyan. The bars are arranged in varying heights, suggesting growth or data representation. The background is a dark green digital grid with subtle light effects and floating particles, creating a futuristic and technological atmosphere. This visual is ideal for concepts related to finance, data analysis, technology, growth, and digital trends. Blocks decrease illustrations Abstract 3D Bar Chart with Neon Glow on Green Digital Background. This image features a vibrant 3D representation of a bar chart, composed of translucent, glowing blocks in shades of pink, yellow, and cyan. The bars are arranged in varying heights, suggesting growth or data representation. The background is a dark green digital grid with subtle light effects and floating particles, creating a futuristic and technological atmosphere. This visual is ideal for concepts related to finance, data analysis, technology, growth, and digital trends.
Free with trial Bar graph consisting of rectangular blocks in different colors: blue, green, yellow, orange, purple, and pink, decreasing in height. Overlaying the graph is a bold, zigzagging red arrow pointing downward, representing a declining trend. The red arrow contrasts sharply with the pastel-colored bars, emphasizing a negative change or trend. Set against a white background for clarity and focus. Blocks decrease illustrations Declining Trends: A Bar Graph with a Downward Red Arrow. Generative AI. Bar graph consisting of rectangular blocks in different colors: blue, green, yellow, orange, purple, and pink, decreasing in height. Overlaying the graph is a bold, zigzagging red arrow pointing downward, representing a declining trend. The red arrow contrasts sharply with the pastel-colored bars, emphasizing a negative change or trend. Set against a white background for clarity and focus.
Free with trial This 3D render shows a calculator with a colorful bar chart made of cubes illustrating growth and success in business and finance. Perfect for presentations and infographics. Blocks decrease illustrations Colorful 3D Calculator with Growing Bar Chart Cubes for Business and Finance. This 3D render shows a calculator with a colorful bar chart made of cubes illustrating growth and success in business and finance. Perfect for presentations and infographics.
Free with trial A series of wooden blocks, each marked with a percentage symbol, form a descending staircase. A bold red arrow dramatically points downwards, symbolizing financial decline. Blocks decrease illustrations A red arrow graph shows a sharp decline, indicating a significant drop in percentages. A series of wooden blocks, each marked with a percentage symbol, form a descending staircase. A bold red arrow dramatically points downwards, symbolizing financial decline
Free with trial This 3D rendering shows a dramatic market downturn, with collapsing bars representing a significant economic decline. The falling graph, generated by AI, visually emphasizes the severity of the drop. The scattered cubes further illustrate instability and potential loss. Blocks decrease illustrations AI-Generated Market Crash Visualization. This 3D rendering shows a dramatic market downturn, with collapsing bars representing a significant economic decline. The falling graph, generated by AI, visually emphasizes the severity of the drop. The scattered cubes further illustrate instability and potential loss.
Free with trial Image depicts falling market values using coins and a downward arrow. It symbolizes economic downturn and financial instability. Blocks decrease illustrations Economic Downturn: Visual Representation of Decreasing Market Value and Financial Instability. Image depicts falling market values using coins and a downward arrow. It symbolizes economic downturn and financial instability
Free with trial Green happy face stands tall on a green block while sad faces descend on wooden blocks illustrating a business graph showing success and failure representing contrasting emotions and outcomes. This i. Blocks decrease illustrations Green happy face stands above sad faces on a descending graph representing success and failure. Green happy face stands tall on a green block while sad faces descend on wooden blocks illustrating a business graph showing success and failure representing contrasting emotions and outcomes. This i
Free with trial This vibrant 3D bar chart illustrates upward trending data, perfect for presentations or reports on financial growth, market analysis, or business success. The colorful blocks represent different data points. Blocks decrease illustrations Colorful 3D Bar Chart Showing Business Growth and Success. This vibrant 3D bar chart illustrates upward trending data, perfect for presentations or reports on financial growth, market analysis, or business success. The colorful blocks represent different data points.
Free with trial Monochrome chart representing big data analysis with peaks and valleys, stock market theme for investment strategy and economic forecast using modern digital infographic. Blocks decrease illustrations Abstract 3d graph with data blocks on white grid background, business analytics concept for financial report and corporate. Monochrome chart representing big data analysis with peaks and valleys, stock market theme for investment strategy and economic forecast using modern digital infographic
Free with trial This impactful image displays the American flag beneath cutouts of a factory, a house, and a downward trend graph, all surrounded by wooden blocks, symbolizing economic challenges. Blocks decrease illustrations Economic indicators show a factory, house, and downward trend on an American flag. This impactful image displays the American flag beneath cutouts of a factory, a house, and a downward trend graph, all surrounded by wooden blocks, symbolizing economic challenges.
Free with trial Sustainable CO2 reduction, emission strategies, green business transition. created ai. Blocks decrease illustrations Environmental Stewardship Aiming for CO2 Emission Reduction Strategies: Eco-Conscious Business Tactics Demonstrating Green. Sustainable CO2 reduction, emission strategies, green business transition. created ai
Free with trial Job ID: fba8760d-e973-412d-9011-a0e8d72a93ed. Blocks decrease illustrations Colorful Bar Graph with Flags: Abstract Representation of Data and Trends. Job ID: fba8760d-e973-412d-9011-a0e8d72a93ed
Free with trial Taxation, tax rates ,increase and decrease of taxes trend concepts. Text "TAX" on wooden cube blocks and up and down arrow on flipping block on wood table isolated on white background with copy space. Blocks decrease illustrations Text \'TAX\' on wooden cube blocks and up and down arrow on flipping block on wood table. Taxation, tax rates ,increase and decrease of taxes trend concepts. Text "TAX" on wooden cube blocks and up and down arrow on flipping block on wood table isolated on white background with copy space.
Free with trial An abstract concept representing dwindling achievements. An image of a bar chart with stacked blocks. Descent and decrease. 3D rendering. text space. cool blue background. Blocks decrease illustrations An abstract concept representing dwindling achievements. An image of a bar chart with stacked blocks.
Free with trial A man shows loss using blocks and chart. Additional blocks are included for you to add your own wording if needed. Blocks decrease vectors Loss blocks cartoon. A man shows loss using blocks and chart. Additional blocks are included for you to add your own wording if needed
Free with trial High interest rate word blocks on white background. Blocks decrease illustrations High interest rate word blocks
Free with trial Discount word blocks on white background. Blocks decrease illustrations Discount word blocks on white
Free with trial Tree figures. Hit the number. Make an order. 3D rendering blocks. Make statistics graphs. calculate. The result is out. Assign a number. Increase or decrease in number. Blocks decrease illustrations Numbers drawn on a tree. It grows in order. 3D rendering. Tree figures. Hit the number. Make an order. 3D rendering blocks. Make statistics graphs. calculate. The result is out. Assign a number. Increase or decrease in number.
Free with trial Decrease and fall of indicators in 3D illustrations. Graph of the decline of the economy from wooden cubes. Blocks decrease illustrations Decrease and fall of indicators in 3D illustrations.
Free with trial Tree figures. Hit the number. Make an order. 3D rendering blocks. Make statistics graphs. calculate. The result is out. Assign a number. Increase or decrease in number. Blocks decrease illustrations The number written on the block. Going up. 3D rendering. Tree figures. Hit the number. Make an order. 3D rendering blocks. Make statistics graphs. calculate. The result is out. Assign a number. Increase or decrease in number.
Free with trial Stacked white blocks. Downward right graph. The concept of reduction and failure. 3D rendering. Blocks decrease illustrations Stacked white blocks. Downward right graph. The concept of reduction and failure.
Free with trial Stacked white blocks. downward sloping graph. Risk and deterioration concept. Red hot background. text space. 3D rendering. Blocks decrease illustrations Stacked white blocks. downward sloping graph. Risk and deterioration concept. Red hot background. text space.
Free with trial Stacked white blocks. downward-sloping graph. depression and anxiety. Abstract concept representing decline and deterioration. 3D rendering. cool blue background. Blocks decrease illustrations Stacked white blocks. downward-sloping graph. depression and anxiety. Abstract concept representing decline and deterioration. 3D
Free with trial Stacked white blocks. downward-sloping graph. depression and anxiety. Abstract concept representing decline and deterioration. 3D rendering. cool blue background. Blocks decrease illustrations Stacked white blocks. downward-sloping graph. depression and anxiety. Abstract concept representing decline and deterioration. 3D
Free with trial Wooden blocks with Fall word, impacts of Covid-19 disruption, global economy financial crisis business concept. Blocks decrease illustrations Wooden blocks with Fall word. economy financial crisis business concept. Wooden blocks with Fall word, impacts of Covid-19 disruption, global economy financial crisis business concept.
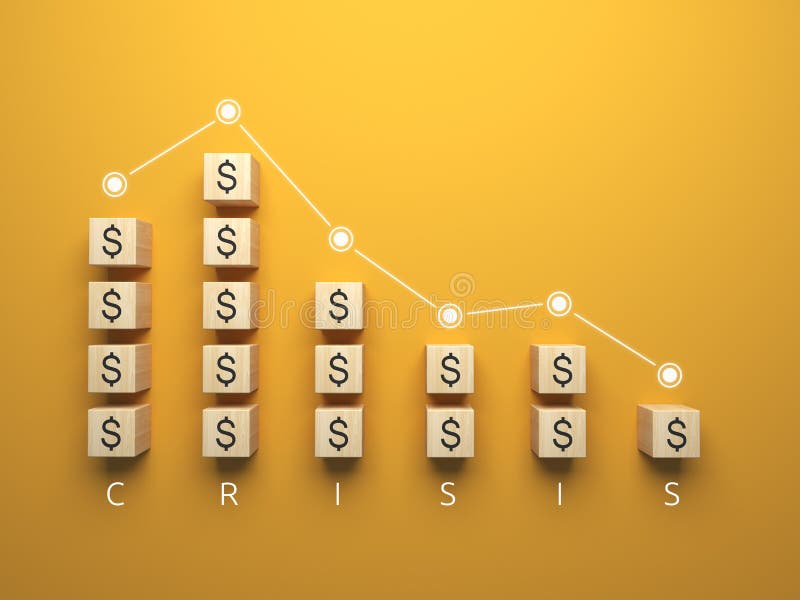
Free with trial Decreasing coin stacks with letter blocks on white background with mock up place. Crisis, finance and money concept. 3D Rendering. Blocks decrease illustrations Decreasing coin stacks with letter blocks on background with mock up place. Crisis, finance and money concept. 3D Rendering
Free with trial Decreasing coin stacks with letter blocks on yellow background with mock up place. Crisis, finance and money concept. 3D Rendering. Blocks decrease illustrations Decreasing coin stacks with letter blocks on background with mock up place. Crisis, finance and money concept. 3D Rendering
Free with trial Taxes in white block letters on red blocks with silver scissors on white. Blocks decrease illustrations Cutting taxes. Taxes in white block letters on red blocks with silver scissors on white.
Free with trial Cost cutting in white block letters on blue and red blocks with scissors on white. Blocks decrease illustrations Cost cutting
Free with trial Tree figures. Hit the number. Make an order. 3D rendering blocks. Make statistics graphs. calculate. The result is out. Assign a number. Increase or decrease in number. Blocks decrease illustrations Tree pie chart. Add numbers. 3D rendering. Tree figures. Hit the number. Make an order. 3D rendering blocks. Make statistics graphs. calculate. The result is out. Assign a number. Increase or decrease in number.
Free with trial Decrease and fall of indicators in 3D illustrations. Graph of the decline of the economy from wooden cubes. Blocks decrease illustrations Graph of the decline of the economy from wooden cubes
Free with trial Decrease and fall of indicators in 3D illustrations. Graph of the decline of the economy from wooden cubes. Blocks decrease illustrations Graph of the decline of the economy from wooden cubes
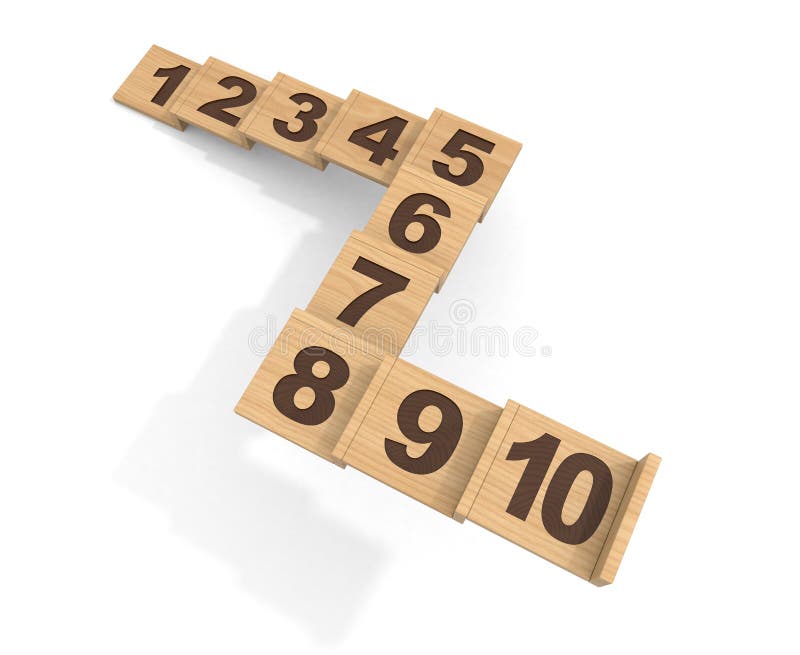
Free with trial Tree figures. Hit the number. Make an order. 3D rendering blocks. Make statistics graphs. calculate. The result is out. Assign a number. Increase or decrease in number. Blocks decrease illustrations Stairs with numbers written. 3D rendering. Tree figures. Hit the number. Make an order. 3D rendering blocks. Make statistics graphs. calculate. The result is out. Assign a number. Increase or decrease in number.
Free with trial COVID19 text on wooden blocks. Pandemic impact over economic concept. Stock photo. Blocks decrease illustrations COVID19 text on wooden blocks. Pandemic impact over economic concept. Stock photo.
Free with trial Staircase of color children's blocks. Isolated render on a white background. Blocks decrease illustrations Staircase of color children's blocks
Free with trial Staircase of color children's blocks. Isolated render on a white background. Blocks decrease illustrations Staircase of color children's blocks
Free with trial Net Zero and Carbon Neutral Concepts Net Zero Emissions Goals A climate-neutral long-term strategy Ready to put wooden blocks by hand with green net center icon and green icon on gray background. Blocks decrease illustrations Net Zero and Carbon Neutral Concepts Net Zero Emissions Goals A climate-neutral long-term strategy Ready to put wooden blocks by