Free with trial Black glyph icon representing a broken downward arrow, symbolizing decline, financial crisis, market downturn, failure, or negative trends. Ideal for business presentations, economic reports, data visualization, infographics, and conceptual designs indicating loss, recession, or problems. Simple, clean graphic illustration on a white background. Generated by AI. Chart decrease icon vectors Declining Trend Broken Downward Arrow Icon. Black glyph icon representing a broken downward arrow, symbolizing decline, financial crisis, market downturn, failure, or negative trends. Ideal for business presentations, economic reports, data visualization, infographics, and conceptual designs indicating loss, recession, or problems. Simple, clean graphic illustration on a white background. Generated by AI
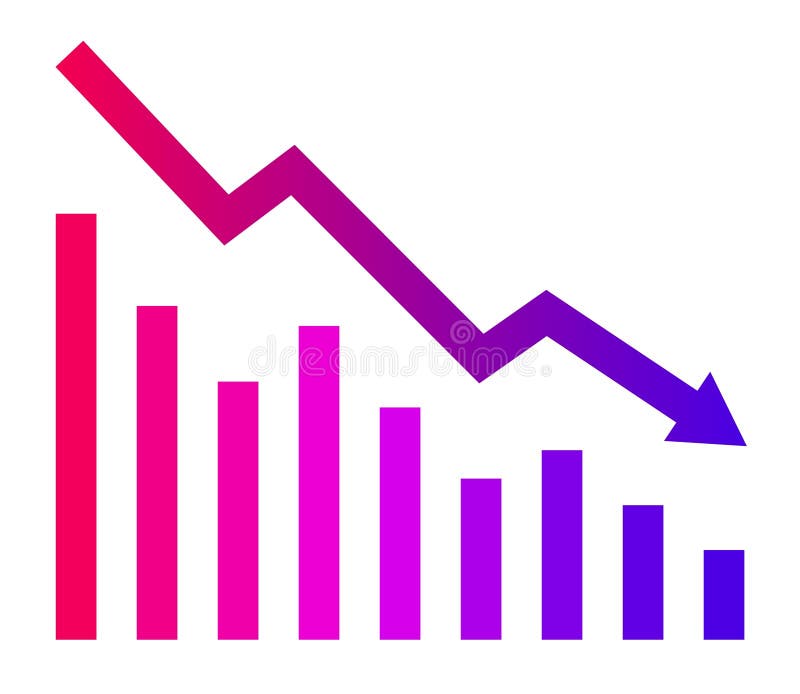
Free with trial A striking 3D rendered image featuring a bar chart with decreasing red bars and a prominent red downward-pointing arrow, set against a vibrant yellow background. This minimalist visual powerfully symbolizes financial decline, economic recession, business loss, or a negative trend in performance. The clean design effectively conveys concepts of decreasing profits, market downturns, or poor investment outcomes. Ideal for presentations, financial reports, economic analysis, infographics, and articles discussing challenges, risks, or market volatility in business and finance. Chart decrease icon illustrations Economic Downturn Bar Chart with Downward Arrow. A striking 3D rendered image featuring a bar chart with decreasing red bars and a prominent red downward-pointing arrow, set against a vibrant yellow background. This minimalist visual powerfully symbolizes financial decline, economic recession, business loss, or a negative trend in performance. The clean design effectively conveys concepts of decreasing profits, market downturns, or poor investment outcomes. Ideal for presentations, financial reports, economic analysis, infographics, and articles discussing challenges, risks, or market volatility in business and finance.
Free with trial A minimalist graphic featuring a green footprint icon next to a downward-pointing arrow. The image is clean and simple, set against a white background. This design can represent various concepts such as progress, direction, or a decline. Suitable for use in educational materials, infographics, websites, or presentations related to movement, steps, or downward trends. Chart decrease icon illustrations Footprint and Down Arrow Icon. A minimalist graphic featuring a green footprint icon next to a downward-pointing arrow. The image is clean and simple, set against a white background. This design can represent various concepts such as progress, direction, or a decline. Suitable for use in educational materials, infographics, websites, or presentations related to movement, steps, or downward trends.
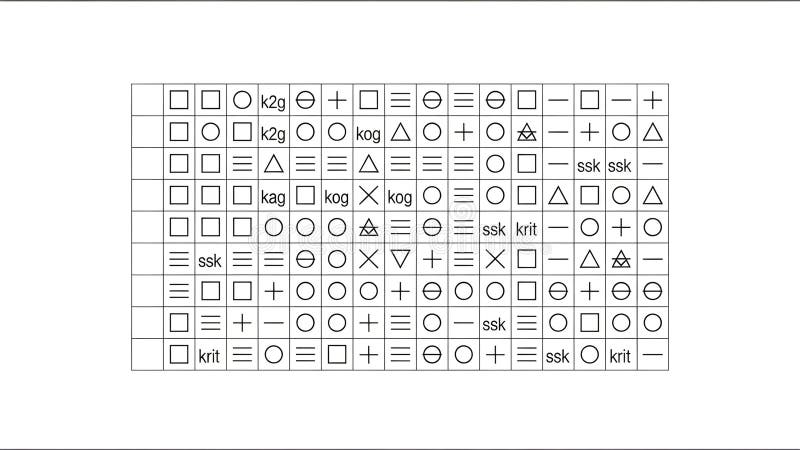
Free with trial A detailed black and white illustration of a knitting pattern stitch chart. This graphical guide features a grid with various symbols, icons, and abbreviations like 'k2tog' and 'ssk', representing different knitting stitches and techniques. The chart is organized by rows and columns, providing a visual map for creating intricate designs, particularly in lace knitting. This image is ideal for crafting websites, DIY tutorials, knitting books, hobby blogs, and instructional materials related to needlework, textiles, and handmade crafts. Chart decrease icon illustrations Knitting Pattern Stitch Chart
Free with trial Set line Financial growth decrease, Data analysis, and Server on black and white. Vector. Chart decrease icon illustrations Set line Financial growth decrease, Data analysis, and Server on black and white. Vector
Free with trial Charts and Diagrams line icons. Social media: share, comment, like icons. Report, Block diagram, 3D Chart and Dot Plot graph linear icons. Trend, Pyramid and Pie chart report symbols. Vector. Chart decrease icon illustrations Charts and Diagrams line icons. Set of 3D Chart, Block diagram and Dot Plot graph icons. Social media icons. Vector. Charts and Diagrams line icons. Social media: share, comment, like icons. Report, Block diagram, 3D Chart and Dot Plot graph linear icons. Trend, Pyramid and Pie chart report symbols. Vector
Free with trial Financial crisis icon with dollar symbol, market decline arrow showing economic loss and business downturn concept. Chart decrease icon vectors Financial crisis icon with dollar symbol, market decline arrow showing economic loss
Free with trial A minimalist vector icon illustrating market volatility and financial trends. The graphic features two distinct line graphs on a coordinate system: a jagged, highly fluctuating upper line representing high volatility, and a smoother lower line with marked points indicating a general trend. Up-down arrows and separate up down indicators further emphasize market movement and unpredictable changes. Ideal for financial reports, business presentations, data visualization, and economic analysis. Chart decrease icon vectors Market Volatility and Financial Trend Graph Icon. A minimalist vector icon illustrating market volatility and financial trends. The graphic features two distinct line graphs on a coordinate system: a jagged, highly fluctuating upper line representing high volatility, and a smoother lower line with marked points indicating a general trend. Up-down arrows and separate up down indicators further emphasize market movement and unpredictable changes. Ideal for financial reports, business presentations, data visualization, and economic analysis.
Free with trial A single, large, shiny green arrow curves downwards on a white background. The arrow has a smooth, glossy surface that reflects light, giving it a three-dimensional appearance. The arrowhead points directly downwards, indicating a direction of descent or decrease. The vibrant green color and polished finish make the arrow stand out prominently. Chart decrease icon illustrations Shiny Green Downward Curved Arrow on a White Background direction decrease. A single, large, shiny green arrow curves downwards on a white background. The arrow has a smooth, glossy surface that reflects light, giving it a three-dimensional appearance. The arrowhead points directly downwards, indicating a direction of descent or decrease. The vibrant green color and polished finish make the arrow stand out prominently
Free with trial A comprehensive vector icon set depicting various aspects of online video content creation and social media analytics. This collection includes symbols for growth charts, play buttons, speech bubbles representing comments or chat, subscriber counts, watch time indicators, and percentage-based progress arrows. Ideal for illustrating concepts related to video platforms, digital marketing, content creator dashboards, performance reports, and online engagement strategies. The modern flat design makes it suitable for websites, mobile applications, and presentations. Chart decrease icon vectors Video Content and Social Media Analytics Icon Set. A comprehensive vector icon set depicting various aspects of online video content creation and social media analytics. This collection includes symbols for growth charts, play buttons, speech bubbles representing comments or chat, subscriber counts, watch time indicators, and percentage-based progress arrows. Ideal for illustrating concepts related to video platforms, digital marketing, content creator dashboards, performance reports, and online engagement strategies. The modern flat design makes it suitable for websites, mobile applications, and presentations.
Free with trial Decline Chart simple icons set designed in filled, outline, line and stroke style. Chart decrease icon vectors Decline Chart simple icons set designed in filled and stroke style. Decline Chart simple icons set designed in filled, outline, line and stroke style
Free with trial Decline Chart simple icons set designed in filled, outline, line and stroke style. Chart decrease icon vectors Decline Chart simple icons set designed in filled and stroke style. Decline Chart simple icons set designed in filled, outline, line and stroke style
Free with trial A comprehensive vector icon set featuring essential symbols for business, finance, and data analysis. This collection includes various arrows for indicating growth and decline, wavy lines representing market trends, checkmarks for success or approval, X marks for errors or rejection, stopwatches for time management and efficiency, and stacks of coins with dollar signs for financial concepts. Ideal for presentations, infographics, web design, and reports to visually communicate progress, status, and economic indicators. Chart decrease icon vectors Business, Finance, and Data Analytics Vector Icon Set. A comprehensive vector icon set featuring essential symbols for business, finance, and data analysis. This collection includes various arrows for indicating growth and decline, wavy lines representing market trends, checkmarks for success or approval, X marks for errors or rejection, stopwatches for time management and efficiency, and stacks of coins with dollar signs for financial concepts. Ideal for presentations, infographics, web design, and reports to visually communicate progress, status, and economic indicators.
Free with trial Bitcoin price drop concept with red falling arrow and gold BTC coin isolated on light background. Cryptocurrency market crash symbol showing bearish trend, decline chart and digital asset depreciation. Modern finance icon ideal for trading articles, investment blogs, blockchain presentations, fintech apps and economic reports. Chart decrease icon vectors Bitcoin price drop concept with red falling arrow and gold BTC coin isolated on light background.
Free with trial A detailed black and white illustration of a complex knitting pattern chart on a clean white background. The grid is filled with various symbols, including geometric shapes like circles, squares, and triangles, alongside standard knitting abbreviations such as 'k2g', 'ssk', and 'kog'. This graphic represents a stitch legend or a visual guide for creating intricate lace or colorwork designs. It's perfect for craft-related websites, publications, tutorials, and projects that require a visual representation of handmade instructions, patterns, or complex codes. Chart decrease icon illustrations Knitting Pattern Chart with Symbols and Abbreviations. A detailed black and white illustration of a complex knitting pattern chart on a clean white background. The grid is filled with various symbols, including geometric shapes like circles, squares, and triangles, alongside standard knitting abbreviations such as 'k2g', 'ssk', and 'kog'. This graphic represents a stitch legend or a visual guide for creating intricate lace or colorwork designs. It's perfect for craft-related websites, publications, tutorials, and projects that require a visual representation of handmade instructions, patterns, or complex codes.
Free with trial A collection of nine flat vector icons for data visualization including bar graphs, line charts, pie charts, and performance meters isolated on a white background. Chart decrease icon vectors Simple black data analysis and business chart icon set. A collection of nine flat vector icons for data visualization including bar graphs, line charts, pie charts, and performance meters isolated on a white background
Free with trial 3D descending sort icon in ocean blue gradient color showing downward order or filter arrangement. Represents data sorting or list sequence. Chart decrease icon illustrations 3D Ocean Blue Descending Sort Icon on white Background. 3D descending sort icon in ocean blue gradient color showing downward order or filter arrangement. Represents data sorting or list sequence
Free with trial Falling bar chart with downward arrow representing business decline and financial problems. Ideal for risk, loss, and economic downturn concepts. Chart decrease icon vectors Business decline chart downward trend problem failure vector silhouette illustration design. Falling bar chart with downward arrow representing business decline and financial problems. Ideal for risk, loss, and economic downturn concepts
Free with trial Golden dollar sign with circular chart showing financial growth and decline on black background. Vector graphic design. Chart decrease icon vectors Golden dollar sign with circular chart showing financial growth and decline on black background
Free with trial Declining bar chart. Wheat spikelets concept. Agricultural crisis symbol. Vector harvest illustration. EPS 10. Chart decrease icon vectors Declining bar chart. Wheat spikelets concept. Agricultural crisis symbol. Vector harvest illustration.
Free with trial A simple and bold icon illustration of a bar graph. This can be used to represent data, statistics, growth, or trends. The icon is designed in a clean and minimalist style, making it versatile for various applications. Chart decrease icon vectors Simple Bold Bar Graph Sign Shape Icon for Data Presentation. A simple and bold icon illustration of a bar graph. This can be used to represent data, statistics, growth, or trends. The icon is designed in a clean and minimalist style, making it versatile for various applications.
Free with trial Set line Data analysis, Financial growth decrease, and Search data. Business infographic template. Vector. Chart decrease icon illustrations Set line Data analysis, Financial growth decrease, and Search data. Business infographic template. Vector
Free with trial Set of alpha transparent business and finance icons drawn in white chalk, illustrating net asset value rising and falling alongside a market chart and Indian currency notation. Chart decrease icon vectors Sketch of mutual fund NAV increase and decrease icons with Indian rupee symbol alpha transparent. Set of alpha transparent business and finance icons drawn in white chalk, illustrating net asset value rising and falling alongside a market chart and Indian currency notation.
Free with trial A glowing neon red bar chart shows a significant downward trend, symbolizing financial loss or negative growth on a black backdrop. Chart decrease icon illustrations Neon red bar chart illustrating a steep decline in financial performance against a dark background. A glowing neon red bar chart shows a significant downward trend, symbolizing financial loss or negative growth on a black backdrop
Free with trial A hand-drawn bar chart shows a downward trend with a line graph indicating a significant decrease in value over time. Chart decrease icon vectors Downturn graph illustrating declining trends and financial loss. A hand-drawn bar chart shows a downward trend with a line graph indicating a significant decrease in value over time
Free with trial A 3D rendered graphic depicts a simplified bar chart with pastel colored bars in pink, yellow, and blue. A line graph with white lines and orange and yellow nodes crosses diagonally above the bars. The elements are set against a light blue background with a light tan border, all isolated on a white background. Chart decrease icon vectors 3 D cartoon bar chart with line graph on blue background data. A 3D rendered graphic depicts a simplified bar chart with pastel colored bars in pink, yellow, and blue. A line graph with white lines and orange and yellow nodes crosses diagonally above the bars. The elements are set against a light blue background with a light tan border, all isolated on a white background
Free with trial A clean, minimalist icon representing the stock market. The image features a bull and a bear, symbolizing market trends, with a rising green arrow indicating an upward trend. The design is enclosed in a circular frame, suitable for financial reports, investment presentations, or business infographics. The simple line art style makes it versatile for various applications. Chart decrease icon illustrations Stock Market Bull and Bear Trend Icon. A clean, minimalist icon representing the stock market. The image features a bull and a bear, symbolizing market trends, with a rising green arrow indicating an upward trend. The design is enclosed in a circular frame, suitable for financial reports, investment presentations, or business infographics. The simple line art style makes it versatile for various applications.
Free with trial A simple black and red bar chart displays data with varying heights on a white background. Chart decrease icon illustrations Simple Bar Chart with One Red Bar on White Background graph data. A simple black and red bar chart displays data with varying heights on a white background
Free with trial Doodle Graph icon. Blue pen hand drawn infographic symbol on a notepaper piece. Line art style graphic design element. Web button with shadow. Decline, save on expences concept. Chart decrease icon vectors Doodle Graph icon
Free with trial Orange bar chart with downward arrow vector illustration. Financial loss, economic recession, market crash, business failure, negative growth, data analysis. Declining graph with falling trend. Chart decrease icon vectors Decreasing bar chart with downward arrow showing financial loss and economic recession vector illustration. Orange bar chart with downward arrow vector. Orange bar chart with downward arrow vector illustration. Financial loss, economic recession, market crash, business failure, negative growth, data analysis. Declining graph with falling trend
Free with trial A flat design vector illustration depicting a financial market data board or stock ticker. The black-bordered display features various stock symbols, numerical values like '$ ,80K', '$ ,22,50', and indicators of market performance. Prominently highlighted in red is the word 'LOSING', accompanied by a red downward arrow signifying a price drop, and a red downward triangle. Conversely, a green upward arrow indicates a price increase. This icon effectively visualizes concepts of financial loss, gain, market volatility, and investment trends, suitable for business, finance, and economic content. Chart decrease icon illustrations Financial Market Data Board Icon with Loss and Gain Indicators. A flat design vector illustration depicting a financial market data board or stock ticker. The black-bordered display features various stock symbols, numerical values like '$ ,80K', '$ ,22,50', and indicators of market performance. Prominently highlighted in red is the word 'LOSING', accompanied by a red downward arrow signifying a price drop, and a red downward triangle. Conversely, a green upward arrow indicates a price increase. This icon effectively visualizes concepts of financial loss, gain, market volatility, and investment trends, suitable for business, finance, and economic content.
Free with trial Circular maze with a descending bar chart icon, symbolizing the challenge of navigating business data and analytics amid declines, obstacles, and the search for strategic solutions and recovery. Chart decrease icon illustrations Navigating complex data decline challenges and finding solutions. Circular maze with a descending bar chart icon, symbolizing the challenge of navigating business data and analytics amid declines, obstacles, and the search for strategic solutions and recovery
Free with trial Set Drop in crude oil price, Dollar rate decrease, and Global economic crisis on seamless pattern. Vector. Chart decrease icon vectors Set Drop in crude oil price, Dollar rate decrease, and Global economic crisis on seamless pattern. Vector
Free with trial Price drop icon. Cost reduction symbol. Oil value Vector. Cheap fuel. EPS 10. Chart decrease icon vectors Price drop icon. Cost reduction symbol. Oil value Vector. Cheap fuel.
Free with trial A 3D rendered icon depicting a blue document with a raised bar graph. The bar graph features alternating blue, orange, and yellow bars of varying heights. White lines and a circular orange and white element are also present on the blue document surface. The icon is isolated on a white background. Chart decrease icon vectors 3 D blue document icon with orange and blue bar graph and white lines image. A 3D rendered icon depicting a blue document with a raised bar graph. The bar graph features alternating blue, orange, and yellow bars of varying heights. White lines and a circular orange and white element are also present on the blue document surface. The icon is isolated on a white background
Free with trial A 3D render illustrating a concept of financial decline and economic recession. The image features a red bar chart with progressively shorter bars, indicating a downward trend. A bold, red arrow follows this negative trajectory, pointing sharply downwards. Set against a clean, neutral gray background, this graphic powerfully symbolizes concepts like business failure, stock market crash, investment loss, sales decrease, and economic crisis. It's a perfect visual for presentations, reports, and articles discussing financial downturns, poor performance, and negative growth. Chart decrease icon illustrations Financial Decline Graph with Red Arrow Down. A 3D render illustrating a concept of financial decline and economic recession. The image features a red bar chart with progressively shorter bars, indicating a downward trend. A bold, red arrow follows this negative trajectory, pointing sharply downwards. Set against a clean, neutral gray background, this graphic powerfully symbolizes concepts like business failure, stock market crash, investment loss, sales decrease, and economic crisis. It's a perfect visual for presentations, reports, and articles discussing financial downturns, poor performance, and negative growth.
Free with trial Blue bar chart with a black arrow bouncing backward vector illustration. Economic recession, financial loss, market crash, business failure, negative growth, setback. Data graph with falling pointer. Chart decrease icon vectors Financial bar chart with a bouncing arrow pointing down economic recession and market loss vector illustration. Blue bar chart with a black arrow bouncing backward vector illustration. Economic recession, financial loss, market crash, business failure, negative growth, setback. Data graph with falling pointer
Free with trial Black and white icon of a bar graph with a diagonal arrow indicating a sharp decline. Chart decrease icon illustrations Falling bar graph with diagonal arrow showing sharp decline bar chart. Black and white icon of a bar graph with a diagonal arrow indicating a sharp decline
Free with trial A black downward arrow with a cracked surface, symbolizing decline on a white background. Chart decrease icon illustrations Downward Arrow Icon Showing Decline With Cracked Surface decrease. A black downward arrow with a cracked surface, symbolizing decline on a white background
Free with trial White Global economic crisis icon isolated with long shadow background. World finance crisis. Pink hexagon button. Vector. Chart decrease icon illustrations White Global economic crisis icon isolated with long shadow background. World finance crisis. Pink hexagon button
Free with trial Business Chart and Graph Set with Line, Bar, and Pie Icons for Data Analysis or Statistics in Reports and Research. Vector. Editable stroke. Chart decrease icon vectors Business Chart and Graph Set with Line, Bar, and Pie Icons for Data Analysis or Statistics in Reports and Research
Free with trial Bar chart representation of data increase growth and finance. Data analysis. Chart decrease icon vectors Bar chart representation of data increase growth and finance. Data analysis
Free with trial 3d blue magnifying glass with downward-trending chart inside Financial analysis, economic decline, risk assessment, market monitoring, investment evaluation concept Low poly digital futuristic Vector. Chart decrease icon vectors 3d blue magnifying glass with downward-trending chart inside Financial analysis, economic decline, risk assessment
Free with trial Set line Shopping cart and dollar, Piggy bank hammer, Financial growth decrease and Money plant the pot. Business infographic template. Vector. Chart decrease icon illustrations Set line Shopping cart and dollar, Piggy bank hammer, Financial growth decrease and Money plant the pot. Business
Free with trial This image features a minimalist and modern vector icon of a jagged downward trending line graph, sharply declining from left to right, symbolizing financial loss, economic downturn, or market decline, set against a clean and uncluttered white background suitable for use in presentations, reports, infographics, or digital media to visually communicate negative trends or decreasing performance. Chart decrease icon illustrations Sharp downward trending line graph icon isolated on white background representing financial loss or market decline vector. This image features a minimalist and modern vector icon of a jagged downward trending line graph, sharply declining from left to right, symbolizing financial loss, economic downturn, or market decline, set against a clean and uncluttered white background suitable for use in presentations, reports, infographics, or digital media to visually communicate negative trends or decreasing performance
Free with trial Percent Arrow Icons Set: Growth, Increase, Decrease Filled Up and Down Arrows. Chart decrease icon vectors Percent Arrow Icons Set: Growth, Increase, Decrease Filled Up and Down Arrows
Free with trial Businessman presenting falling chart indicating financial decline and loss. Ideal for analytics, reporting, and economic downturn presentations. Chart decrease icon vectors Business decline presentation with downward chart representing financial loss analysis and negative growth. Businessman presenting falling chart indicating financial decline and loss. Ideal for analytics, reporting, and economic downturn presentations
Free with trial A minimalist black and white line icon showing a stylized woman next to a descending arrow. This symbol represents concepts like failure, demotion, loss, or a downward trend. Chart decrease icon vectors Female figure with downward arrow icon symbolizing demotion or decline. A minimalist black and white line icon showing a stylized woman next to a descending arrow. This symbol represents concepts like failure, demotion, loss, or a downward trend
Free with trial A comprehensive collection of hand-drawn business and data visualization icons. This doodle-style set features a variety of essential elements, including different types of arrows, bar graphs, line charts, and pie charts. The sketchy, black and white illustrations are perfect for infographics, presentations, financial reports, and marketing materials. Each icon is isolated on a white background, representing concepts like growth, statistics, process flow, and direction. This versatile vector set is ideal for adding a creative, hand-made touch to any project related to analytics, finance, or strategy. Chart decrease icon illustrations Hand Drawn Business and Finance Doodle Icon Set. A comprehensive collection of hand-drawn business and data visualization icons. This doodle-style set features a variety of essential elements, including different types of arrows, bar graphs, line charts, and pie charts. The sketchy, black and white illustrations are perfect for infographics, presentations, financial reports, and marketing materials. Each icon is isolated on a white background, representing concepts like growth, statistics, process flow, and direction. This versatile vector set is ideal for adding a creative, hand-made touch to any project related to analytics, finance, or strategy.
Free with trial A striking 3D render illustrating a significant financial or business decline. The image features a minimalist bar chart with three decreasing blue-grey bars, symbolizing a negative trend or falling performance. A prominent, jagged red arrow sharply points downwards across the chart, emphatically conveying concepts of loss, recession, crisis, or market downturn. Set against a vibrant yellow background, this clean and modern graphic is ideal for presentations, reports, articles, or educational materials discussing economic challenges, poor statistics, or business risks. Chart decrease icon illustrations Financial Decline Bar Chart with Red Down Arrow. A striking 3D render illustrating a significant financial or business decline. The image features a minimalist bar chart with three decreasing blue-grey bars, symbolizing a negative trend or falling performance. A prominent, jagged red arrow sharply points downwards across the chart, emphatically conveying concepts of loss, recession, crisis, or market downturn. Set against a vibrant yellow background, this clean and modern graphic is ideal for presentations, reports, articles, or educational materials discussing economic challenges, poor statistics, or business risks.
Free with trial Up Down Pointer Icon Scroll Gesture Point Pointing Page Upward Downward Navigation Direction Swipe North South Sign Symbol Graphic Illustration Path. Chart decrease icon vectors Up Down Pointer Icon Scroll Gesture Point Pointing Page Upward Downward Navigation Direction Swipe North South
Free with trial A minimalist and clean line art illustration of a graph depicting a downward trend, symbolizing economic decline, failure, or a recession in business. Chart decrease icon vectors Simple Outline Falling Graph Line Chart Economic Recession Business Icon. A minimalist and clean line art illustration of a graph depicting a downward trend, symbolizing economic decline, failure, or a recession in business.
Free with trial Graph with decrease report. Business and finance vector illustration. Diagram with recession and bankruptcy progress. Chart decrease icon vectors Graph with decrease report. Business and finance vector illustration. Diagram with recession and bankruptcy
Free with trial Set line Mobile stock trading, Safe, Drop crude oil price and Dollar rate decrease. Business infographic template. Vector. Chart decrease icon vectors Set line Mobile stock trading, Safe, Drop crude oil price and Dollar rate decrease. Business infographic template
Free with trial Set line Dollar rate decrease Mobile stock trading Shutdown of factory Falling property prices Global economic crisis Briefcase and Contract money and pen icon. Vector. Chart decrease icon illustrations Set line Dollar rate decrease, Mobile stock trading, Shutdown of factory, Falling property prices, Global economic. Set line Dollar rate decrease Mobile stock trading Shutdown of factory Falling property prices Global economic crisis Briefcase and Contract money and pen icon. Vector.
Free with trial Black icon of a falling graph with a downward arrow on a white background. Clear details and vibrant colors en. Chart decrease icon illustrations Falling Graph with Downward Arrow Icon on White Background downward trend decline. Black icon of a falling graph with a downward arrow on a white background. Clear details and vibrant colors en
Free with trial Basic charts line icon set. Bar diagram, pie and histogram graph. Data visualization, growth and distribution analysis for business and finance. Vector illustration Editable Stroke. Chart decrease icon illustrations Basic charts line icon set. Bar diagram, pie and histogram graph. Data visualization, growth and distribution analysis
Free with trial Set Money plant in the pot, Financial growth decrease, Bank building and bag. Business infographic template. Vector. Chart decrease icon vectors Set Money plant in the pot, Financial growth decrease, Bank building and bag. Business infographic template. Vector
Free with trial Set Drop in crude oil price Dollar rate decrease Global economic crisis Briefcase Stop delivery cargo truck and Hanging sign with Sale icon. Vector. Chart decrease icon illustrations Set Drop in crude oil price, Dollar rate decrease, Global economic crisis, Briefcase, Stop delivery cargo truck and. Set Drop in crude oil price Dollar rate decrease Global economic crisis Briefcase Stop delivery cargo truck and Hanging sign with Sale icon. Vector.
Free with trial Set line Falling property prices, Shutdown of factory, Drop crude oil and Global economic crisis news icon. Vector. Chart decrease icon illustrations Set line Falling property prices, Shutdown of factory, Drop crude oil and Global economic crisis news icon. Vector
Free with trial Arrow Up Down Icon North South Upward Downward Pointer Scale Rise Fall Elevator Sign Symbol Growth Scroll Gesture Position Navigation Location Sign. Chart decrease icon vectors Arrow Up Down Icon North South Upward Downward Pointer Scale Rise Fall Elevator Sign Symbol Growth Scroll Gesture
Free with trial Blue bar chart with decreasing values beside a soft cloud shape and horizontal lines. Ideal for data analytics, cloud computing, business growth, technology, forecasts, trends, and innovation. Simple. Chart decrease icon illustrations Minimalist Bar Chart with Cloud Element Representing Data Analysis and Cloud Computing Concepts. Blue bar chart with decreasing values beside a soft cloud shape and horizontal lines. Ideal for data analytics, cloud computing, business growth, technology, forecasts, trends, and innovation. Simple
Free with trial Smartphone screen with password protection icon, downward sale arrow, and a chart depicting analytics. Ideal for cybersecurity, digital sales, ecommerce metrics, data protection, online safety. Chart decrease icon vectors Mobile Security Features and Analytics Highlighting Sales Performance with Trend Insights. Smartphone screen with password protection icon, downward sale arrow, and a chart depicting analytics. Ideal for cybersecurity, digital sales, ecommerce metrics, data protection, online safety
Free with trial Set line Shutdown of factory, Bank building, Global economic crisis news and Stop delivery cargo truck icon. Vector. Chart decrease icon illustrations Set line Shutdown of factory, Bank building, Global economic crisis news and Stop delivery cargo truck icon. Vector
Free with trial Set line Global economic crisis Drop in crude oil price Briefcase Dollar rate decrease Calculation of expenses and Fire burning house icon. Vector. Chart decrease icon illustrations Set line Global economic crisis, Drop in crude oil price, Briefcase, Dollar rate decrease, Calculation of expenses and. Set line Global economic crisis Drop in crude oil price Briefcase Dollar rate decrease Calculation of expenses and Fire burning house icon. Vector.
Free with trial Financial arrows up and down. Financial growth and decline. Graph with green and red arrows. Finance diagram, graphic charts icon set. Chart decrease icon vectors Financial arrows up and down. Financial growth and decline. Graph with green and red arrows. Finance diagram, graphic charts icon
Free with trial Up and down sign with green and black arrows in flat style showing movement direction and sales change. Vector illustration of a sales bar chart icon used as an elevator symbol or universal pictogram. Chart decrease icon vectors Up and down sign with green and black arrows in flat style showing movement direction
Free with trial A black curved line graph showing a downward trend on a white background. Clear details and vibrant colors enh. Chart decrease icon illustrations Black curved line graph showing decrease on white background chart decreasing. A black curved line graph showing a downward trend on a white background. Clear details and vibrant colors enh
Free with trial Ai-Generated. Professional chart stock image featuring set of black and white minimalist chart and graph line icons. Chart decrease icon vectors Set of black and white minimalist chart and graph line icons
Free with trial Set line Debt ball chained to coin, Storm, Dollar rate decrease and Mobile stock trading. Business infographic template. Vector. Chart decrease icon vectors Set line Debt ball chained to coin, Storm, Dollar rate decrease and Mobile stock trading. Business infographic template
Free with trial Mathematical showing black curve graph showing exponential decay on white background keywords: graph, chart. Chart decrease icon illustrations Black curve graph showing exponential decay on white background Keywords: graph, chart, curve. Mathematical showing black curve graph showing exponential decay on white background keywords: graph, chart
Free with trial Data Stats Board Display Line Icon Downward Down Trend Statistic Performance Market Decline Economy Downturn Bar Graph Progress Outline Presentation. Chart decrease icon vectors Data Stats Board Display Line Icon Downward Down Trend Statistic Performance Market Decline Economy Downturn Bar Graph
Free with trial Up Down Arrowhead Icon North South Pointer Upload Download Pathway Path Location Navigation Position Sign Symbol Choice Movement Slide Swipe Gesture. Chart decrease icon vectors Up Down Arrowhead Icon North South Pointer Upload Download Pathway Path Location Navigation Position Sign Symbol Choice
Free with trial Magnifying glass highlights poor analytics on chart, signed document, and sad emotion. Ideal for business, analytics, decline, review, research productivity failure. Simple flat metaphor. Chart decrease icon illustrations Analysis of Declining Trends with Signed Document and Performance Chart. Magnifying glass highlights poor analytics on chart, signed document, and sad emotion. Ideal for business, analytics, decline, review, research productivity failure. Simple flat metaphor
Free with trial A 3D cloud icon displays a downward trending graph and falling dollar coins, symbolizing financial decline or loss. Chart decrease icon illustrations 3D Cloud Icon with Downward Trend Graph and Falling Dollar Coins finance economy. A 3D cloud icon displays a downward trending graph and falling dollar coins, symbolizing financial decline or loss