Free with trial Metric management icon with black gear and graph. flat simple trend modern stats logotype graphic design web element isolated on white. concept of key performance indicator or bad operation strategy. Chart decrease icon vectors Metric management icon with black gear and graph
Free with trial Reduction chart icon vector icon on white background. EPS10. Chart decrease icon vectors Reduction chartline in Thin line black color. flat simple vector symbols illustration. Reduction chart icon vector icon on white background. EPS10
Free with trial Digital isometric warning icon and red alert stripes on a dark financial background with blurred stock market charts and falling graphs. Concept of global economic crisis, market crash, system failure, and high investment risk. Chart decrease icon illustrations Warning icon on red financial stock market crash background. Digital isometric warning icon and red alert stripes on a dark financial background with blurred. Digital isometric warning icon and red alert stripes on a dark financial background with blurred stock market charts and falling graphs. Concept of global economic crisis, market crash, system failure, and high investment risk.
Free with trial Productivity , diagram bar with gear icon symbol. Vector illustration. Chart decrease icon vectors Productivity , diagram bar with gear icon. Vector illustration
Free with trial Set Drop in crude oil price, Dollar rate decrease, Safe and on seamless pattern. Vector. Chart decrease icon illustrations Set Drop in crude oil price, Dollar rate decrease, Safe and on seamless pattern. Vector
Free with trial No decline icon. Prohibition symbol with graph. Red and black warning. Financial growth concept. EPS 10. Chart decrease icon vectors No decline icon. Prohibition symbol with graph. Red and black warning. Financial growth concept.
Free with trial Arrow trend-down icon vector set on white background. EPS 10. Chart decrease icon vectors Arrow trend-down icon isolated on white background. Arrow trend-down icon vector set on white background. EPS 10
Free with trial Linear gear with graph like crisis management icon. concept of key performance indicator or bad strategy. flat simple trend modern outline stats logotype graphic design web element isolated on white. Chart decrease icon vectors Linear gear with graph like crisis management icon
Free with trial Glowing neon Global economic crisis icon isolated on brick wall background. World finance crisis. Neon light alphabet. Vector. Chart decrease icon illustrations Glowing neon Global economic crisis icon isolated on brick wall background. World finance crisis. Neon light alphabet
Free with trial Loan Related and Investment Line Vector Icon. Investment, Percentage, Interest Rate. Low total cost icon vector image. Thin Outline Vector illustration isolated on background. Chart decrease icon vectors Loan Related and Investment Line Vector Icon. Investment, Percentage, Interest Rate. Low total cost icon vector image.
Free with trial Loan Related and Investment Line Vector Icon. Investment, Percentage, Interest Rate. Low total cost icon vector image. Thin Outline Vector illustration isolated on background. Chart decrease icon vectors Loan Related and Investment Line Vector Icon. Investment, Percentage, Interest Rate. Low total cost icon vector image.
Free with trial Loan Related and Investment Line Vector Icon. Investment, Percentage, Interest Rate. Low total cost icon vector image. Thin Outline Vector illustration isolated on background. Chart decrease icon vectors Loan Related and Investment Line Vector Icon. Investment, Percentage, Interest Rate. Low total cost icon vector image.
Free with trial Loan Related and Investment Line Vector Icon. Investment, Percentage, Interest Rate. Low total cost icon vector image. Thin Outline Vector illustration isolated on background. Chart decrease icon vectors Loan Related and Investment Line Vector Icon. Investment, Percentage, Interest Rate. Low total cost icon vector image.
Free with trial Loan Related and Investment Line Vector Icon. Investment, Percentage, Interest Rate. Low total cost icon vector image. Thin Outline Vector illustration isolated on background. Chart decrease icon illustrations Loan Related and Investment Line Vector Icon. Investment, Percentage, Interest Rate. Low total cost icon vector image.
Free with trial Loan Related and Investment Line Vector Icon. Investment, Percentage, Interest Rate. Low total cost icon vector image. Thin Outline Vector illustration isolated on background. Chart decrease icon vectors Loan Related and Investment Line Vector Icon. Investment, Percentage, Interest Rate. Low total cost icon vector image.
Free with trial Loan Related and Investment Line Vector Icon. Investment, Percentage, Interest Rate. Low total cost icon vector image. Thin Outline Vector illustration isolated on background. Chart decrease icon vectors Loan Related and Investment Line Vector Icon. Investment, Percentage, Interest Rate. Low total cost icon vector image.
Free with trial Loan Related and Investment Line Vector Icon. Investment, Percentage, Interest Rate. Low total cost icon vector image. Thin Outline Vector illustration isolated on background. Chart decrease icon vectors Loan Related and Investment Line Vector Icon. Investment, Percentage, Interest Rate. Low total cost icon vector image.
Free with trial Loan Related and Investment Line Vector Icon. Investment, Percentage, Interest Rate. Low total cost icon vector image. Thin Outline Vector illustration isolated on background. Chart decrease icon vectors Loan Related and Investment Line Vector Icon. Investment, Percentage, Interest Rate. Low total cost icon vector image.
Free with trial Loan Related and Investment Line Vector Icon. Investment, Percentage, Interest Rate. Low total cost icon vector image. Thin Outline Vector illustration isolated on background. Chart decrease icon vectors Loan Related and Investment Line Vector Icon. Investment, Percentage, Interest Rate. Low total cost icon vector image.
Free with trial Loan Related and Investment Line Vector Icon. Investment, Percentage, Interest Rate. Low total cost icon vector image. Thin Outline Vector illustration isolated on background. Chart decrease icon vectors Loan Related and Investment Line Vector Icon. Investment, Percentage, Interest Rate. Low total cost icon vector image.
Free with trial Loan Related and Investment Line Vector Icon. Investment, Percentage, Interest Rate. Low total cost icon vector image. Thin Outline Vector illustration isolated on background. Chart decrease icon vectors Loan Related and Investment Line Vector Icon. Investment, Percentage, Interest Rate. Low total cost icon vector image.
Free with trial Loan Related and Investment Line Vector Icon. Investment, Percentage, Interest Rate. Low total cost icon vector image. Thin Outline Vector illustration isolated on background. Chart decrease icon vectors Loan Related and Investment Line Vector Icon. Investment, Percentage, Interest Rate. Low total cost icon vector image.
Free with trial AIDA model infographic template with round vertical box container gradually decrease on right column dark background style with 4 point for slide presentation vector. Chart decrease icon illustrations AIDA model infographic template with round vertical box container gradually decrease on right column dark background style with 4
Free with trial Recession icon vector image. Suitable for mobile application web application and print media. Chart decrease icon vectors Recession icon vector image.
Free with trial Set Global economic crisis Dollar rate decrease Drop in crude oil price Tearing money banknote Employee dismissal Mobile stock trading and Falling property prices icon. Vector. Chart decrease icon vectors Set Global economic crisis, Dollar rate decrease, Drop in crude oil price, Tearing money banknote, Employee dismissal. Set Global economic crisis Dollar rate decrease Drop in crude oil price Tearing money banknote Employee dismissal Mobile stock trading and Falling property prices icon. Vector.
Free with trial Recession icon vector image. Suitable for mobile application web application and print media. Chart decrease icon vectors Recession icon vector image.
Free with trial Up and down arrow icon set in generic design. Upward and downward sign symbol illustration. Chart decrease icon vectors Up and down arrow icon set in generic design. Upward and downward sign symbol
Free with trial Stock Market icon vector image. Suitable for mobile application web application and print media. Chart decrease icon illustrations Stock Market icon vector image.
Free with trial Cost reduction. Cost increase icon. Price reduced, discount icon. Low total cost icon vector image. Vector illustration isolated on background. Chart decrease icon vectors Cost reduction. Cost increase icon. Price reduced, discount icon. Low total cost icon vector image. Vector illustration isolated
Free with trial Cost reduction. Cost increase icon. Price reduced, discount icon. Low total cost icon vector image. Vector illustration isolated on background. Chart decrease icon vectors Cost reduction. Cost increase icon. Price reduced, discount icon. Low total cost icon vector image. Vector illustration isolated
Free with trial Cost reduction. Cost increase icon. Price reduced, discount icon. Low total cost icon vector image. Vector illustration isolated on background. Chart decrease icon vectors Cost reduction. Cost increase icon. Price reduced, discount icon. Low total cost icon vector image. Vector illustration isolated
Free with trial Cost reduction. Cost increase icon. Price reduced, discount icon. Low total cost icon vector image. Vector illustration isolated on background. Chart decrease icon vectors Cost reduction. Cost increase icon. Price reduced, discount icon. Low total cost icon vector image. Vector illustration isolated
Free with trial Cost reduction. Cost increase icon. Price reduced, discount icon. Low total cost icon vector image. Vector illustration isolated on background. Chart decrease icon vectors Cost reduction. Cost increase icon. Price reduced, discount icon. Low total cost icon vector image. Vector illustration isolated
Free with trial Cost reduction. Cost increase icon. Price reduced, discount icon. Low total cost icon vector image. Vector illustration isolated on background. Chart decrease icon vectors Cost reduction. Cost increase icon. Price reduced, discount icon. Low total cost icon vector image. Vector illustration isolated
Free with trial Cost reduction. Cost increase icon. Price reduced, discount icon. Low total cost icon vector image. Vector illustration isolated on background. Chart decrease icon vectors Cost reduction. Cost increase icon. Price reduced, discount icon. Low total cost icon vector image. Vector illustration isolated
Free with trial Interest growth icon vector logo set collection for web app ui. Chart decrease icon vectors Interest Growth Icon Showing Financial Increase, Investment Success, and Economic Trends. Interest growth icon vector logo set collection for web app ui
Free with trial Up and down arrow icon on square background. Upward and downward sign symbol illustration with long shadow. Chart decrease icon vectors Up and down arrow icon on square background. Upward and downward sign symbol with long shadow
Free with trial Black Searching for food in trash can on streets outdoors icon isolated on white background. Homelessness and poverty concept. Vector. Chart decrease icon illustrations Black Searching for food in trash can on streets outdoors icon isolated on white background. Homelessness and poverty
Free with trial Minimalist black and white outline vector illustration of a simplified line graph icon for business analytics and financial performance tracking in a corporate environment. Chart decrease icon vectors Clean and straightforward icon depicting an increasing and decreasing line graph. Minimalist black and white outline vector illustration of a simplified line graph icon for business analytics and financial performance tracking in a corporate environment
Free with trial Stock market chart arrows in red and green are seen as graphic elements and are seen in a 3-d illustration. Arrows indicate the upward and downward gains and losses on the Dow. Chart decrease icon illustrations Stock market chart arrows in red and green are seen as graphic elements and are seen in a 3-d illustration
Free with trial Low total cost icon vector image. Thin Outline Vector illustration isolated on background. Chart decrease icon vectors Low total cost icon vector image. Thin Outline Vector illustration isolated on background.
Free with trial Low total cost icon vector image. Thin Outline Vector illustration isolated on background. Chart decrease icon vectors Low total cost icon vector image. Thin Outline Vector illustration isolated on background.
Free with trial Interest growth icon logo sign vector outline in black and white color. Chart decrease icon vectors Financial Growth Icon Illustrating Investment Gains, Economic Expansion, and Profit Increase. Interest growth icon logo sign vector outline in black and white color
Free with trial Set Global economic crisis, Contract money and pen, Dollar rate decrease and Drop in crude oil price on seamless pattern. Vector. Chart decrease icon vectors Set Global economic crisis, Contract money and pen, Dollar rate decrease and Drop in crude oil price on seamless pattern
Free with trial Interest growth icon Vector symbol or sign set collection in black and white outline. Chart decrease icon vectors Economic Growth Icon Illustrating Financial Prosperity, Investment Returns, and Profit Expansion. Interest growth icon Vector symbol or sign set collection in black and white outline
Free with trial Glowing neon line Global economic crisis icon isolated on blue background. World finance crisis. Vector. Chart decrease icon illustrations Glowing neon line Global economic crisis icon isolated on blue background. World finance crisis. Vector
Free with trial Reduction chart icon vector icon on white background. EPS10. Chart decrease icon vectors Reduction chartline in Thin line black color. flat simple vector symbols illustration. Reduction chart icon vector icon on white background. EPS10
Free with trial Reduction chart icon vector icon on white background. EPS10. Chart decrease icon vectors Reduction chartline in Thin line black color. flat simple vector symbols illustration. Reduction chart icon vector icon on white background. EPS10
Free with trial Reduction chart icon vector icon on white background. EPS10. Chart decrease icon vectors Reduction chartline in Thin line black color. flat simple vector symbols illustration. Reduction chart icon vector icon on white background. EPS10
Free with trial Reduction chart icon vector icon on white background. EPS10. Chart decrease icon vectors Reduction chartline in Thin line black color. flat simple vector symbols illustration. Reduction chart icon vector icon on white background. EPS10
Free with trial Reduction chart icon vector icon on white background. EPS10. Chart decrease icon vectors Reduction chartline in Thin line black color. flat simple vector symbols illustration. Reduction chart icon vector icon on white background. EPS10
Free with trial Reduction chart icon vector icon on white background. EPS10. Chart decrease icon vectors Reduction chartline in Thin line black color. flat simple vector symbols illustration. Reduction chart icon vector icon on white background. EPS10
Free with trial Reduction chart icon vector icon on white background. EPS10. Chart decrease icon vectors Reduction chartline in Thin line black color. flat simple vector symbols illustration. Reduction chart icon vector icon on white background. EPS10
Free with trial Reduction chart icon vector icon on white background. EPS10. Chart decrease icon vectors Reduction chartline in Thin line black color. flat simple vector symbols illustration. Reduction chart icon vector icon on white background. EPS10
Free with trial Reduction chart icon vector icon on white background. EPS10. Chart decrease icon vectors Reduction chartline in Thin line black color. flat simple vector symbols illustration. Reduction chart icon vector icon on white background. EPS10
Free with trial Financial risk diagram vector icon. filled flat sign for mobile concept and web design. Financial Risk glyph icon. Symbol, logo illustration. Vector graphics. Chart decrease icon vectors Financial risk diagram vector icon
Free with trial Economic downturn crisis recession falling coins broken bank declining chart financial instability blue background mobile app screen Vector illustration. Chart decrease icon vectors Economic downturn crisis recession falling coins broken bank declining chart financial instability blue background mobile app
Free with trial Reduction chart icon vector icon on white background. EPS10. Chart decrease icon vectors Reduction chartline in Thin line black color. flat simple vector symbols illustration. Reduction chart icon vector icon on white background. EPS10
Free with trial Reduction chart icon vector icon on white background. EPS10. Chart decrease icon vectors Reduction chartline in Thin line black color. flat simple vector symbols illustration. Reduction chart icon vector icon on white background. EPS10
Free with trial Financial Risk line icon. linear style sign for mobile concept and web design. Financial risk diagram outline vector icon. Symbol, logo illustration. Vector graphics. Chart decrease icon vectors Financial Risk line icon
Free with trial Reduction chart icon vector icon on white background. EPS10. Chart decrease icon vectors Reduction chartline in Thin line black color. flat simple vector symbols illustration. Reduction chart icon vector icon on white background. EPS10
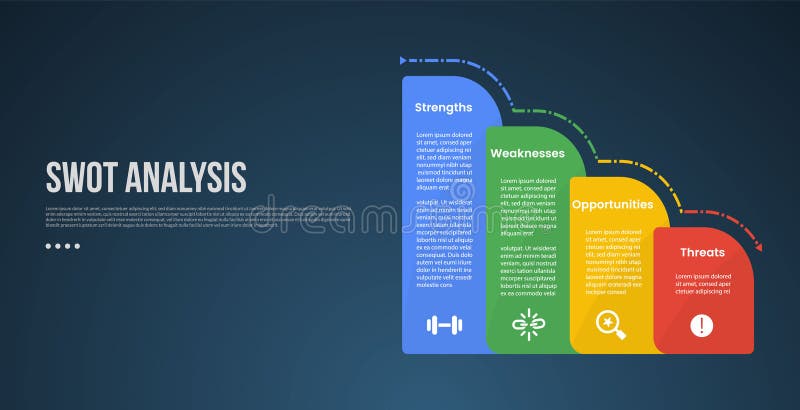
Free with trial SWOT business analysis infographic template with round vertical box container gradually decrease on right column with dark background style. Chart decrease icon illustrations SWOT business analysis infographic template with round vertical box container gradually decrease on right column with dark
Free with trial 3D render icon Line graph tracking energy consumption with a playful narrative icon 3d analysis. Generative AI. Chart decrease icon illustrations 3D render icon Line graph tracking energy consumption with a playful narrative icon 3d analysis
Free with trial Line Global economic crisis icon isolated on white background. World finance crisis. Colorful outline concept. Vector. Chart decrease icon illustrations Line Global economic crisis icon isolated on white background. World finance crisis. Colorful outline concept. Vector
Free with trial A simple line chart illustrates a decreasing trend with distinct dot markers representing data points. The design emphasizes the shift in values over time and aids in visualizing performance. Chart decrease icon vectors Chart Displaying a Downward Trend in Data Analysis. A simple line chart illustrates a decreasing trend with distinct dot markers representing data points. The design emphasizes the shift in values over time and aids in visualizing performance.
Free with trial Line Global economic crisis icon isolated on white background. World finance crisis. Abstract banner with liquid shapes. Vector. Chart decrease icon illustrations Line Global economic crisis icon isolated on white background. World finance crisis. Abstract banner with liquid shapes
Free with trial Cost reduction icon web design logo set collection in flat vector. Chart decrease icon vectors Cost Reduction Icon Illustrating Business Efficiency Strategies, Budget Management Solutions, and Expense Reduction Programs for. Cost reduction icon web design logo set collection in flat vector
Free with trial Decline stage online service or platform. Finance crisis with falling down graph and income decrease. flat vector modern illustration. Chart decrease icon vectors Decline stage online service or platform. Finance crisis with falling down graph and income decrease.
Free with trial Icon of loss function in AI featuring a computer monitor with a downward loss curve graph and the word LOSS, surrounded by circuit lines. Represents optimization process in machine learning models through minimization of error. Vector pictogram with thin black lines on a transparent background and editable line thickness. Chart decrease icon vectors Icon of loss function in AI
Free with trial Business Decline - Recession - Icon 10 File. Chart decrease icon illustrations Business Decline - Recession - Icon
Free with trial Three Candles vector Stock Market Trading concept icon or symbol. Chart decrease icon vectors Three Candles vector Stock Market Trading icon or symbol
Free with trial Graph chart going up and down sign arrows flat design vector illustration on white background. Chart decrease icon vectors Graph chart going up and down sign arrows flat design vector illustration
Free with trial A dynamic 3D illustration of a glossy red arrow pointing downwards in a jagged, volatile path. Isolated on a white background, this graphic icon is a powerful symbol for negative concepts. It represents decline, decrease, failure, loss, and crisis. This visual is perfect for illustrating stock market crashes, economic recession, financial downturns, poor business performance, or any downward trend in data and statistics. An ideal element for reports, presentations, and financial news, with ample copy space. Chart decrease icon illustrations Red Jagged Arrow of Decline - Financial Crisis Concept. A dynamic 3D illustration of a glossy red arrow pointing downwards in a jagged, volatile path. Isolated on a white background, this graphic icon is a powerful symbol for negative concepts. It represents decline, decrease, failure, loss, and crisis. This visual is perfect for illustrating stock market crashes, economic recession, financial downturns, poor business performance, or any downward trend in data and statistics. An ideal element for reports, presentations, and financial news, with ample copy space.
Free with trial GHG, reducing greenhouse gas icon with a graph, eps 10 file, easy to edit. Chart decrease icon vectors GHG, reducing greenhouse gas icon with a graph
Free with trial Infochart, Block diagram and Algorithm. Charts and graphs line icons. Presentation linear icon set Line icons set. Vector. Chart decrease icon illustrations Charts and graphs line icons. Infochart, Block diagram and Algorithm. Linear icon set. Line icons. Vector. Infochart, Block diagram and Algorithm. Charts and graphs line icons. Presentation linear icon set Line icons set. Vector
Free with trial Up and down arrow line icon vector in simple style. Chart decrease icon vectors Up and down arrow line icon in simple style
Free with trial Carbon neutral, co2 gas emissions reduction vector icon, eps 10 file, easy to edit. Chart decrease icon vectors Carbon neutral, co2 gas emissions reduction icon. carbon neutral, co2 gas emissions reduction vector icon, eps 10 file, easy to edit
Free with trial Uptrend and downtrend arrow vector icon. Chart decrease icon illustrations Uptrend and downtrend arrow vector icon
Free with trial Set line Delivery tracking, Financial growth decrease, Layers and Infographic element. White square button. Vector. Chart decrease icon vectors Set line Delivery tracking, Financial growth decrease, Layers and Infographic element. White square button. Vector
Free with trial A simple, flat design icon depicting a downward trend. The image features a red graph line descending from the top left to the bottom right, with an arrow indicating the direction. The graph is set against a clean white background, emphasizing the visual impact of the trend. This graphic is suitable for illustrating concepts such as financial decline, decreasing sales, or negative performance in business, economics, or data analysis. Chart decrease icon vectors Downward Trend Graph Icon. A simple, flat design icon depicting a downward trend. The image features a red graph line descending from the top left to the bottom right, with an arrow indicating the direction. The graph is set against a clean white background, emphasizing the visual impact of the trend. This graphic is suitable for illustrating concepts such as financial decline, decreasing sales, or negative performance in business, economics, or data analysis.