Free with trial Consultancy company logo suggesting scaling and expansion --chaos 25 --stylize 0 --v 6. 1 Job ID: 645f5170-6b28-4c73-b608-f90141dcd45c. Chart decrease icon illustrations Business Growth Icon. consultancy company logo suggesting scaling and expansion --chaos 25 --stylize 0 --v 6.1 Job ID: 645f5170-6b28-4c73-b608-f90141dcd45c
Free with trial This minimalist graphic illustration features a bold red line chart indicating a significant decline in value. The visual includes a currency symbol and bar segments set against a clean background to represent economic loss or market downturn. The sharp downward arrow emphasizes a negative trajectory in fiscal data and business analytics. Chart decrease icon vectors A red line graph showing a downward trend in financial performance. This minimalist graphic illustration features a bold red line chart indicating a significant decline in value. The visual includes a currency symbol and bar segments set against a clean background to represent economic loss or market downturn. The sharp downward arrow emphasizes a negative trajectory in fiscal data and business analytics
Free with trial A polished, metallic golden arrow is depicted curving downwards against a clean white background. The arrow has a sharp point and a smooth, reflective surface, suggesting a concept of decline, decrease, or a negative trend. Its isolated presentation makes it suitable for representing financial or economic downturns. Chart decrease icon illustrations Shiny golden arrow curving downwards on a white background metallic. A polished, metallic golden arrow is depicted curving downwards against a clean white background. The arrow has a sharp point and a smooth, reflective surface, suggesting a concept of decline, decrease, or a negative trend. Its isolated presentation makes it suitable for representing financial or economic downturns
Free with trial A vibrant green arrow points upwards indicating progress or increase, while a glossy red arrow points downwards symbolizing decline or decrease, representing directional changes. Chart decrease icon illustrations Green up arrow and red down arrow icons symbolizing directional movement and change white background. A vibrant green arrow points upwards indicating progress or increase, while a glossy red arrow points downwards symbolizing decline or decrease, representing directional changes
Free with trial Bar graph showing decreasing values alongside arrows moving toward a minimal cloud. Ideal for data analysis, statistics, regression, performance tracking, economy, analytics, simple flat metaphor. Chart decrease icon vectors Declining Bar Chart with Arrows and Cloud Representing Regression or Data Flow. Bar graph showing decreasing values alongside arrows moving toward a minimal cloud. Ideal for data analysis, statistics, regression, performance tracking, economy, analytics, simple flat metaphor
Free with trial A high-quality conceptual image featuring a row of smooth wooden cubes spelling the word "PESSIMISM" on a wooden surface. The arrangement includes a stacked block showing a sad face emoticon and a downward-sloping line graph, symbolizing financial loss, recession, negative market sentiment, and psychological discouragement in a professional or personal context. Chart decrease icon illustrations Wooden Blocks Spelling Pessimism with Sad Face Icon and Downward Trend Graph. A high-quality conceptual image featuring a row of smooth wooden cubes spelling the word "PESSIMISM" on a wooden surface. The arrangement includes a stacked block showing a sad face emoticon and a downward-sloping line graph, symbolizing financial loss, recession, negative market sentiment, and psychological discouragement in a professional or personal context.
Free with trial A glossy, three-dimensional orange arrow curves downwards, clearly indicating a direction or a downward trend. This versatile graphic is perfect for representing various concepts related to movement or decline. Chart decrease icon illustrations Bright orange curved downward arrow icon signifying direction and movement white background. A glossy, three-dimensional orange arrow curves downwards, clearly indicating a direction or a downward trend. This versatile graphic is perfect for representing various concepts related to movement or decline
Free with trial A conceptual image featuring wooden blocks spelling the word "TRUST" alongside a stacked block showing a downward trend graph and a sad face emoji. This composition symbolizes the loss of consumer confidence, economic recession, reputation damage, and the negative impact of poor service or financial decline in a professional business environment. Chart decrease icon illustrations Declining Trust and Business Failure Concept with Wooden Blocks and Sad Face Icon. A conceptual image featuring wooden blocks spelling the word "TRUST" alongside a stacked block showing a downward trend graph and a sad face emoji. This composition symbolizes the loss of consumer confidence, economic recession, reputation damage, and the negative impact of poor service or financial decline in a professional business environment.
Free with trial A visual representation of contrasting directions using prominent green and red arrows, symbolizing growth and decline, increase and decrease, essential for data and trend analysis. Chart decrease icon illustrations Green and red arrows facing each other on isolated on white background. A visual representation of contrasting directions using prominent green and red arrows, symbolizing growth and decline, increase and decrease, essential for data and trend analysis
Free with trial Red sad face beside a line graph showing a downward trend and a bar graph. Ideal for business loss, economic decline, performance issues, challenges, setbacks, analytics, trends. Simple flat metaphor. Chart decrease icon vectors Declining Chart with Sad Face and Bar Graph Representing Negative Trend and Challenges. Red sad face beside a line graph showing a downward trend and a bar graph. Ideal for business loss, economic decline, performance issues, challenges, setbacks, analytics, trends. Simple flat metaphor
Free with trial A graphic representing a 50 percent reduction or decline, depicted by a red arrow and percentage. Chart decrease icon illustrations Red downward arrow indicating 50 percent decrease within a curved arc. A graphic representing a 50 percent reduction or decline, depicted by a red arrow and percentage
Free with trial An arrow pointing downward to indicate loss or decrease, isolated on a white background, symbolizing decline in a visual manner. Chart decrease icon illustrations Loss arrow down isolated on white background. An arrow pointing downward to indicate loss or decrease, isolated on a white background, symbolizing decline in a visual manner
Free with trial An arrow pointing downward to indicate loss or decrease, isolated on a white background, symbolizing decline in a visual manner. Chart decrease icon illustrations Loss arrow down isolated on white background. An arrow pointing downward to indicate loss or decrease, isolated on a white background, symbolizing decline in a visual manner
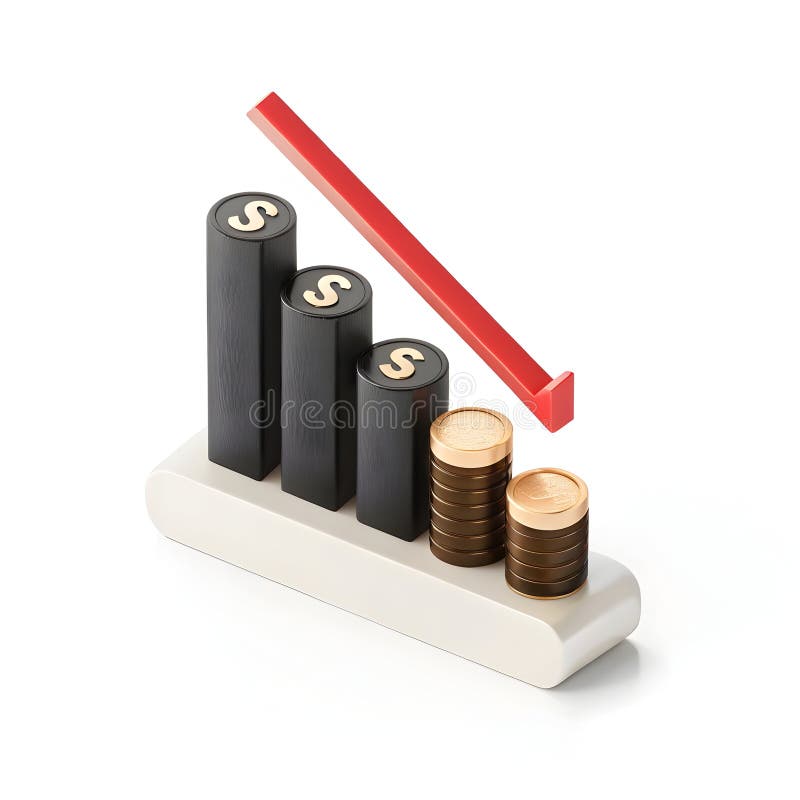
Free with trial A 3D illustration depicts a financial graph with a downward trend. Three black bars, each topped with a gold dollar sign, decrease in height from left to right. To the right of the bars, two stacks of gold coins are shown, also decreasing in height. A thick red arrow points downwards, crossing over the bars and coins, indicating a decline. The entire composition rests on a white base and is set. Chart decrease icon illustrations Falling financial graph with stacked coins finance. A 3D illustration depicts a financial graph with a downward trend. Three black bars, each topped with a gold dollar sign, decrease in height from left to right. To the right of the bars, two stacks of gold coins are shown, also decreasing in height. A thick red arrow points downwards, crossing over the bars and coins, indicating a decline. The entire composition rests on a white base and is set
Free with trial Simple line graph illustrating data points and trends. Ideal for presentations, reports, and infographics related to business analysis, market research, or financial reporting. Chart decrease icon vectors Simple Line Graph, Data Visualization, Business Chart. Simple line graph illustrating data points and trends. Ideal for presentations, reports, and infographics related to business analysis, market research, or financial reporting.
Free with trial A bold, red 3D arrow points downward, symbolizing decline or decrease. The arrow features a sharp, zigzag design, conveying movement and direction. Its glossy surface reflects light, enhancing its vivid appearance. The background is a clean, minimalistic white, emphasizing the arrow's striking color and form. Chart decrease icon vectors Red 3d arrow pointing downward against black background symbolizing decline. A bold, red 3D arrow points downward, symbolizing decline or decrease. The arrow features a sharp, zigzag design, conveying movement and direction. Its glossy surface reflects light, enhancing its vivid appearance. The background is a clean, minimalistic white, emphasizing the arrow's striking color and form.
Free with trial A modern flat design concept illustrating business analytics and sales performance. The scene features a laptop and smartphone displaying a dashboard with various charts, graphs, and statistics for a Q3 report. A world map with a magnifying glass signifies global market analysis and regional breakdown. Additional elements like a checklist and growth decrease icons represent strategic planning, auditing, and financial review. This versatile vector illustration is perfect for presentations, marketing materials, and web design related to finance, data visualization, and business intelligence. Chart decrease icon illustrations Business Analytics and Sales Performance Report Dashboard. A modern flat design concept illustrating business analytics and sales performance. The scene features a laptop and smartphone displaying a dashboard with various charts, graphs, and statistics for a Q3 report. A world map with a magnifying glass signifies global market analysis and regional breakdown. Additional elements like a checklist and growth decrease icons represent strategic planning, auditing, and financial review. This versatile vector illustration is perfect for presentations, marketing materials, and web design related to finance, data visualization, and business intelligence.
Free with trial A bold, glossy red arrow curves downwards, signifying a decrease in business performance, economic downturn, or negative trend. Its sleek design conveys a clear message of decline. Chart decrease icon illustrations Glossy red downward arrow symbolizing decline progress and business trends. A bold, glossy red arrow curves downwards, signifying a decrease in business performance, economic downturn, or negative trend. Its sleek design conveys a clear message of decline
Free with trial A sharp red arrow points downwards, illustrating a significant decrease or failure. This visual metaphor is commonly used to represent economic recession, stock market losses, or declining performance. Chart decrease icon illustrations Red downward trend arrow symbolizing financial decline and market downturn. A sharp red arrow points downwards, illustrating a significant decrease or failure. This visual metaphor is commonly used to represent economic recession, stock market losses, or declining performance
Free with trial Bull and bear animals depicted with upward and downward stock price chart candles. Chart decrease icon illustrations Bull and Bear Market Symbols with Stock Price Charts. Bull and bear animals depicted with upward and downward stock price chart candles
Free with trial Set Bank building Mobile stock trading Money bag Credit card Contract money and pen Global economic crisis and Employee dismissal icon. Vector. Chart decrease icon vectors Set Bank building, Mobile stock trading, Money bag, Credit card, Contract money and pen, Global economic crisis and. Set Bank building Mobile stock trading Money bag Credit card Contract money and pen Global economic crisis and Employee dismissal icon. Vector.
Free with trial Bar graph with declining values, percentage on black square, globe in blue square. Ideal for data, statistics, global business, market trends, finance, analysis research flat simple metaphor. Chart decrease icon vectors Bar chart with decreasing bars alongside percentage and globe icons for data and global analytics. Bar graph with declining values, percentage on black square, globe in blue square. Ideal for data, statistics, global business, market trends, finance, analysis research flat simple metaphor
Free with trial A conceptual vector illustration depicting business analysis and market research. A hand holds a magnifying glass, focusing on a colorful financial chart with bar and line graphs labeled 'Market Trends'. Surrounding icons represent key business metrics like growth, decline, market share, and innovation. This flat design graphic is ideal for presentations, reports, and web content related to data analytics, strategic planning, and financial performance evaluation, symbolizing the scrutiny of data to identify opportunities and understand market dynamics. Chart decrease icon illustrations Business Analysis and Market Trends Concept with Magnifying Glass. A conceptual vector illustration depicting business analysis and market research. A hand holds a magnifying glass, focusing on a colorful financial chart with bar and line graphs labeled 'Market Trends'. Surrounding icons represent key business metrics like growth, decline, market share, and innovation. This flat design graphic is ideal for presentations, reports, and web content related to data analytics, strategic planning, and financial performance evaluation, symbolizing the scrutiny of data to identify opportunities and understand market dynamics.
Free with trial Blue upward bar graph with arrow and falling coin near a sad face. Ideal for finance, economy, investment risks, financial loss, market analysis, emotional impact, business strategies. Simple flat. Chart decrease icon vectors Financial growth with unhappy outcome reflected by increasing bar chart, falling coin, and sad face. Blue upward bar graph with arrow and falling coin near a sad face. Ideal for finance, economy, investment risks, financial loss, market analysis, emotional impact, business strategies. Simple flat
Free with trial Dollar icon crossed out with arrow moving away from a digital dashboard featuring charts, graphs, and media content. Ideal for finance, budget management, loss analysis, expense tracking, resource. Chart decrease icon vectors Money flowing away from online analytics dashboard indicating financial loss or expense tracking. Dollar icon crossed out with arrow moving away from a digital dashboard featuring charts, graphs, and media content. Ideal for finance, budget management, loss analysis, expense tracking, resource
Free with trial A simple black line graph depicts a downward trend with sharp fluctuations on white. Chart decrease icon illustrations Black line graph showing a downward trend on a white background chart. A simple black line graph depicts a downward trend with sharp fluctuations on white
Free with trial Simple line art business icons set featuring a magnifying glass, minus symbol, pie chart, and rising bar graph for financial data analysis. Chart decrease icon vectors Simple line art business icons set featuring a magnifying glass, minus symbol, pie chart, and rising bar graph for
Free with trial A 3D illustration of a statistic down icon isolated on a white background symbolizing decline in data or business performance. Chart decrease icon illustrations Statistic down 3D illustration. A 3D illustration of a statistic down icon isolated on a white background symbolizing decline in data or business performance
Free with trial A 3D illustration of a statistic down icon isolated on a white background symbolizing decline in data or business performance. Chart decrease icon illustrations Statistic down 3D illustration. A 3D illustration of a statistic down icon isolated on a white background symbolizing decline in data or business performance
Free with trial Simple line graph illustrating a negative trend, representing a decrease or decline in data. Perfect for presentations, reports, or website design. Chart decrease icon vectors Downward Trending Line Graph, Showing Negative Growth or Decline. Simple line graph illustrating a negative trend, representing a decrease or decline in data. Perfect for presentations, reports, or website design.
Free with trial A black graph on a white background depicts a sharp downward trend with an arrow indicating further decline. Chart decrease icon illustrations Black graph showing a downward trend on a white background chart decline. A black graph on a white background depicts a sharp downward trend with an arrow indicating further decline
Free with trial A bold, three-dimensional red arrow is prominently displayed, pointing directly downwards. The arrow is cast against a textured, light-colored wall, creating a stark contrast. A dramatic shadow of the arrow is cast on the wall to its left, adding depth and visual interest. The lighting suggests a single light source, casting sharp shadows and highlighting the arrow's form. This image effectively symbolizes decline, decrease, failure, or a downward trend in various contexts, such as finance, business, or performance. Chart decrease icon illustrations Red Arrow Pointing Downward Against Textured Wall. A bold, three-dimensional red arrow is prominently displayed, pointing directly downwards. The arrow is cast against a textured, light-colored wall, creating a stark contrast. A dramatic shadow of the arrow is cast on the wall to its left, adding depth and visual interest. The lighting suggests a single light source, casting sharp shadows and highlighting the arrow's form. This image effectively symbolizes decline, decrease, failure, or a downward trend in various contexts, such as finance, business, or performance.
Free with trial Description: Simple line art illustration of a scatter plot graph showing an uneven distribution of data points. Perfect for presentations or reports. Chart decrease icon vectors Abstract Data Visualization: Scatter Plot Chart with Irregular Data Points. Description: Simple line art illustration of a scatter plot graph showing an uneven distribution of data points. Perfect for presentations or reports.
Free with trial Arrows percent icons with up and down signs and percentage symbols featuring arrow, icon, symbol with up and graphics elements for illustrations. Chart decrease icon vectors Arrows percent icons with up and down signs and percentage symbols featuring arrow
Free with trial A sharp red jagged arrow points downwards, symbolizing a significant decrease or loss, isolated on a clean white background. Chart decrease icon illustrations Red downward trending jagged arrow indicating a sharp decline isolated on white background. A sharp red jagged arrow points downwards, symbolizing a significant decrease or loss, isolated on a clean white background
Free with trial Set line Mobile stock trading, Global economic crisis news, Glass money jar with coin and Bank building. Glowing neon icon. Vector. Chart decrease icon illustrations Set line Mobile stock trading, Global economic crisis news, Glass money jar with coin and Bank building. Glowing neon
Free with trial A set of black icons representing percentage changes, including arrows and circular symbols. The icons depict various concepts such as decrease, increase, and rotation, all incorporating percentage signs. The simple design makes them versatile for use in financial, statistical, or educational materials. Chart decrease icon illustrations Black percentage icons set. A set of black icons representing percentage changes, including arrows and circular symbols. The icons depict various concepts such as decrease, increase, and rotation, all incorporating percentage signs. The simple design makes them versatile for use in financial, statistical, or educational materials.
Free with trial A glossy red arrow curves downwards, symbolizing a decrease or downward trend, isolated on a clean white background. Chart decrease icon illustrations A glossy red arrow curves downwards indicating a decline or fall isolated on white background. A glossy red arrow curves downwards, symbolizing a decrease or downward trend, isolated on a clean white background
Free with trial A 3D rendered red arrow sign pointing downwards, mounted on a black circular base. The image is set against a plain white background, highlighting the contrast between the red arrow and the dark base. This image can be used to represent decline, decrease, or downward trend in various contexts such as finance, statistics, or presentations. Chart decrease icon illustrations Red Arrow Sign on Black Base. A 3D rendered red arrow sign pointing downwards, mounted on a black circular base. The image is set against a plain white background, highlighting the contrast between the red arrow and the dark base. This image can be used to represent decline, decrease, or downward trend in various contexts such as finance, statistics, or presentations.
Free with trial Bold red zigzag arrow pointing downward with sharp angles. Chart decrease icon illustrations Red downward zigzag arrow icon. Bold red zigzag arrow pointing downward with sharp angles
Free with trial This flat vector illustration depicts a rectangular screen displaying a red line graph with a downward pointing arrow. The design uses a clean, minimalist aesthetic with soft pastel background tones and bold outlines. It represents concepts of financial decline, market loss, or negative economic performance in a professional business context. Chart decrease icon vectors A digital icon showing a red downward trend arrow on a screen. This flat vector illustration depicts a rectangular screen displaying a red line graph with a downward pointing arrow. The design uses a clean, minimalist aesthetic with soft pastel background tones and bold outlines. It represents concepts of financial decline, market loss, or negative economic performance in a professional business context
Free with trial This minimalist vector illustration depicts a line chart indicating a negative performance or decline. The design features a clean blue line with circular data points connected by segments, ending in a sharp red arrow pointing downwards. The background is a soft, neutral shade, emphasizing the clear visual representation of financial loss or decreasing statistics. Chart decrease icon vectors A simple line graph showing a downward trend with a red arrow. This minimalist vector illustration depicts a line chart indicating a negative performance or decline. The design features a clean blue line with circular data points connected by segments, ending in a sharp red arrow pointing downwards. The background is a soft, neutral shade, emphasizing the clear visual representation of financial loss or decreasing statistics
Free with trial A flat design illustration featuring a golden euro coin prominently displayed against a white background. Two gray arrows flank the coin: one pointing upwards, symbolizing growth or increase, and another pointing downwards, representing decline or decrease. This graphic effectively visualizes concepts related to currency fluctuations, financial markets, and economic trends of the Euro. Chart decrease icon vectors Euro Coin with Up and Down Arrows. A flat design illustration featuring a golden euro coin prominently displayed against a white background. Two gray arrows flank the coin: one pointing upwards, symbolizing growth or increase, and another pointing downwards, representing decline or decrease. This graphic effectively visualizes concepts related to currency fluctuations, financial markets, and economic trends of the Euro.
Free with trial This minimalist graphic illustration features a bold red line chart indicating a significant decline. The visual composition uses a clean white background to emphasize the downward trajectory of the data points. The aesthetic is professional and modern, suitable for business presentations or financial reports. Chart decrease icon vectors A red line graph showing a downward trend on a white background. This minimalist graphic illustration features a bold red line chart indicating a significant decline. The visual composition uses a clean white background to emphasize the downward trajectory of the data points. The aesthetic is professional and modern, suitable for business presentations or financial reports
Free with trial A grid of black and white icons depicting financial charts with rising and falling trends, magnifying glasses with download arrows, and dollar signs. Chart decrease icon vectors Collection of black and white icons representing financial charts and data analysis graph bar chart. A grid of black and white icons depicting financial charts with rising and falling trends, magnifying glasses with download arrows, and dollar signs
Free with trial Simple line art business icons set featuring a magnifying glass, minus symbol, pie chart, and rising bar graph for financial data analysis. Chart decrease icon vectors Simple line art business icons set featuring a magnifying glass, minus symbol, pie chart, and rising bar graph for
Free with trial A glossy, three-dimensional red arrow curves downwards, casting a subtle shadow on a clean white background. The arrow's sharp point indicates a direction of descent, making it a versatile visual metaphor for concepts like decline, loss, or negative trends. Its vibrant color and sleek design make it stand out, suitable for use in presentations, infographics, or financial reports. Chart decrease icon illustrations Red arrow pointing downwards symbolizing a decrease or decline. A glossy, three-dimensional red arrow curves downwards, casting a subtle shadow on a clean white background. The arrow's sharp point indicates a direction of descent, making it a versatile visual metaphor for concepts like decline, loss, or negative trends. Its vibrant color and sleek design make it stand out, suitable for use in presentations, infographics, or financial reports
Free with trial This set includes 15 high-quality, vector business icons representing various aspects of finance, networking, and growth. Perfect for websites, presentations, and applications. These simple yet effective icons provide visual clarity and professionalism. Chart decrease icon illustrations Business Icon Set. This set includes 15 high-quality, vector business icons representing various aspects of finance, networking, and growth. Perfect for websites, presentations, and applications. These simple yet effective icons provide visual clarity and professionalism.
Free with trial A bold, red 3D arrow is depicted pointing directly downwards. The arrow has a sleek, modern design with a slight sheen, casting a subtle shadow. It is isolated on a clean white background, making it suitable for use as an icon or directional symbol. Chart decrease icon illustrations Red 3D Arrow Pointing Downwards on White Background image photo. A bold, red 3D arrow is depicted pointing directly downwards. The arrow has a sleek, modern design with a slight sheen, casting a subtle shadow. It is isolated on a clean white background, making it suitable for use as an icon or directional symbol
Free with trial This minimalist vector illustration depicts a human hand holding a pen, actively drawing a downward-trending bar graph. The composition features a clean, flat design style with a neutral white background, emphasizing the red and grey bars. The visual mood is professional and analytical, representing concepts of financial loss, market decline, or negative performance metrics. Chart decrease icon vectors A hand uses a pen to draw a declining bar chart on a white background. This minimalist vector illustration depicts a human hand holding a pen, actively drawing a downward-trending bar graph. The composition features a clean, flat design style with a neutral white background, emphasizing the red and grey bars. The visual mood is professional and analytical, representing concepts of financial loss, market decline, or negative performance metrics
Free with trial An illustration featuring two large arrows on a grid background. A green arrow curves upward to the right, symbolizing growth or increase, while a red arrow curves downward to the right, indicating decline or decrease. The contrasting arrows convey opposing trends or directions. Chart decrease icon illustrations Contrasting Arrows on Grid Background. An illustration featuring two large arrows on a grid background. A green arrow curves upward to the right, symbolizing growth or increase, while a red arrow curves downward to the right, indicating decline or decrease. The contrasting arrows convey opposing trends or directions.
Free with trial Black zigzag arrow icon pointing downward, indicating a negative trend or decline. Chart decrease icon vectors Falling down arrow graph symbol. Black zigzag arrow icon pointing downward, indicating a negative trend or decline
Free with trial A 3D rendered image of a shiny red arrow pointing downwards, standing on a metallic circular base, isolated on a white background. The arrow is reflective and has a glossy finish, giving it a modern and sleek appearance. This image can be used to represent decline, decrease, or downward trend in various contexts such as finance, statistics, or presentations. Chart decrease icon illustrations Red Arrow Down Symbol on Metallic Base. A 3D rendered image of a shiny red arrow pointing downwards, standing on a metallic circular base, isolated on a white background. The arrow is reflective and has a glossy finish, giving it a modern and sleek appearance. This image can be used to represent decline, decrease, or downward trend in various contexts such as finance, statistics, or presentations.
Free with trial This minimalist graphic illustration features a series of vertical green bars arranged in descending order of height. A bold black diagonal arrow points downwards across the top of the bars, symbolizing a decline or negative performance. The clean design uses a flat aesthetic against a plain background, making it ideal for business presentations or financial reports. Chart decrease icon vectors A simple green bar chart showing a downward trend with a black arrow. This minimalist graphic illustration features a series of vertical green bars arranged in descending order of height. A bold black diagonal arrow points downwards across the top of the bars, symbolizing a decline or negative performance. The clean design uses a flat aesthetic against a plain background, making it ideal for business presentations or financial reports
Free with trial This minimalist vector illustration depicts a financial chart with a bold red arrow pointing downwards, symbolizing a significant decline or loss. The graphic features clean lines and a simple aesthetic, emphasizing the negative movement of the data points. The stark contrast between the red elements and the plain background makes it an effective visual for concepts related to economic downturns,. Chart decrease icon vectors A red line graph showing a sharp downward trend on a white background. This minimalist vector illustration depicts a financial chart with a bold red arrow pointing downwards, symbolizing a significant decline or loss. The graphic features clean lines and a simple aesthetic, emphasizing the negative movement of the data points. The stark contrast between the red elements and the plain background makes it an effective visual for concepts related to economic downturns,
Free with trial A vibrant red arrow curves and points downwards against a clean white background. This 3D rendered illustration conveys the concept of decline, decrease, or downward trend. Its clean design makes it suitable for a variety of applications, including business presentations, financial reports, and data visualizations. The image is versatile and can be used to represent negative growth, falling prices, or other downward movements. Chart decrease icon illustrations Red Arrow Pointing Down - Decline Concept. A vibrant red arrow curves and points downwards against a clean white background. This 3D rendered illustration conveys the concept of decline, decrease, or downward trend. Its clean design makes it suitable for a variety of applications, including business presentations, financial reports, and data visualizations. The image is versatile and can be used to represent negative growth, falling prices, or other downward movements.
Free with trial This minimalist graphic illustration features a bold red line chart indicating a significant decline. The visual composition uses clean lines and a flat design aesthetic to represent negative growth or financial loss. The stark contrast between the vibrant red color and the neutral background emphasizes the downward trajectory of the data points. Chart decrease icon vectors A red line graph showing a downward trend on a plain white background. This minimalist graphic illustration features a bold red line chart indicating a significant decline. The visual composition uses clean lines and a flat design aesthetic to represent negative growth or financial loss. The stark contrast between the vibrant red color and the neutral background emphasizes the downward trajectory of the data points
Free with trial A single, glossy green arrow is depicted pointing downwards against a stark white background. The arrow has a smooth, curved shaft that transitions into a sharp arrowhead. Its reflective surface gives it a three-dimensional appearance. The color green and the downward direction suggest concepts such as decrease, decline, or negative movement. Chart decrease icon illustrations Glossy Green Downward Arrow Symbol on a White Background direction. A single, glossy green arrow is depicted pointing downwards against a stark white background. The arrow has a smooth, curved shaft that transitions into a sharp arrowhead. Its reflective surface gives it a three-dimensional appearance. The color green and the downward direction suggest concepts such as decrease, decline, or negative movement
Free with trial A simple black line drawing of a heart with an electrocardiogram line through it and a downward pointing arrow, symbolizing a decrease in heart rate or health. Chart decrease icon vectors Heart Rate Line Graph with Downward Arrow. A simple black line drawing of a heart with an electrocardiogram line through it and a downward pointing arrow, symbolizing a decrease in heart rate or health
Free with trial A modern, hand-drawn illustration symbolizing a bear market. This creative doodle features a stylized purple bear, the financial metaphor for a declining market, surrounded by downward arrows, volatile stock chart lines, and a warning sign. The abstract, pastel-colored design effectively visualizes concepts of economic downturn, recession, financial crisis, and investment risk. This vector graphic is perfect for articles, blogs, presentations, and infographics related to finance, trading, economics, and stock market analysis. Isolated on a white background for versatile use. Chart decrease icon vectors Bear Market Financial Concept Illustration. A modern, hand-drawn illustration symbolizing a bear market. This creative doodle features a stylized purple bear, the financial metaphor for a declining market, surrounded by downward arrows, volatile stock chart lines, and a warning sign. The abstract, pastel-colored design effectively visualizes concepts of economic downturn, recession, financial crisis, and investment risk. This vector graphic is perfect for articles, blogs, presentations, and infographics related to finance, trading, economics, and stock market analysis. Isolated on a white background for versatile use.
Free with trial This 3D illustration features a vertical bar graph with columns of varying heights, indicating a clear decline in performance. Bright red arrows point downward, emphasizing the negative trend and loss of value. The clean, minimalist design uses a simple color palette against a neutral background, making it ideal for financial or business presentations. Chart decrease icon vectors A three dimensional bar chart showing a downward trend with red arrows. This 3D illustration features a vertical bar graph with columns of varying heights. This 3D illustration features a vertical bar graph with columns of varying heights, indicating a clear decline in performance. Bright red arrows point downward, emphasizing the negative trend and loss of value. The clean, minimalist design uses a simple color palette against a neutral background, making it ideal for financial or business presentations
Free with trial Three vibrant green arrows point downwards, each adorned with a white percentage symbol, visually representing a decline in rates or financial losses. Evokes concepts of sales, discounts, and market trends. Chart decrease icon illustrations Green downward arrows symbolizing percentage decrease and financial loss isolated on white background. Three vibrant green arrows point downwards, each adorned with a white percentage symbol, visually representing a decline in rates or financial losses. Evokes concepts of sales, discounts, and market trends
Free with trial A computer screen displaying stock market notifications for three stocks: Stock A with a 5% increase, Stock B with a 3% decrease, and Stock C that has reached its target. The image features a dark grey computer screen with a light blue background and colorful notification bubbles. Chart decrease icon illustrations Stock market notifications on a computer screen. A computer screen displaying stock market notifications for three stocks: Stock A with a 5% increase, Stock B with a 3% decrease, and Stock C that has reached its target. The image features a dark grey computer screen with a light blue background and colorful notification bubbles.
Free with trial This minimalist graphic illustration depicts a red line chart trending sharply downward against a neutral background. Several small downward-pointing arrows and currency symbols are scattered below the line, emphasizing a negative economic trajectory. The clean, flat design uses a high-contrast color palette to clearly communicate concepts of loss, recession, or market decline. Chart decrease icon vectors A red line graph showing a sharp downward trend in financial performance. This minimalist graphic illustration depicts a red line chart trending sharply downward against a neutral background. Several small downward-pointing arrows and currency symbols are scattered below the line, emphasizing a negative economic trajectory. The clean, flat design uses a high-contrast color palette to clearly communicate concepts of loss, recession, or market decline
Free with trial This vibrant vector illustration showcases a collection of red and orange gradient arrows, all pointing downwards. The set includes both straight and dynamically curved arrows, effectively symbolizing various forms of decline, decrease, or negative trends. Perfect for use in business presentations, financial reports, infographics, or any design requiring a clear visual representation of falling statistics, market drops, recession, loss, or a general downward movement. The clean, modern flat design ensures versatility and impact. Chart decrease icon vectors Downward Trend Red Gradient Arrows Vector Set. This vibrant vector illustration showcases a collection of red and orange gradient arrows, all pointing downwards. The set includes both straight and dynamically curved arrows, effectively symbolizing various forms of decline, decrease, or negative trends. Perfect for use in business presentations, financial reports, infographics, or any design requiring a clear visual representation of falling statistics, market drops, recession, loss, or a general downward movement. The clean, modern flat design ensures versatility and impact.
Free with trial A graphic illustration features several bold red arrows descending vertically against a clean white background. The arrows vary slightly in size and spacing, creating a sense of movement and direction. Abstract geometric shapes, including small squares and circles, along with dashed lines, are interspersed around the arrows, adding a modern, stylized aesthetic. The overall visual conveys a concept. Chart decrease icon vectors Multiple red arrows pointing downwards indicating a decline or decrease. A graphic illustration features several bold red arrows descending vertically against a clean white background. The arrows vary slightly in size and spacing, creating a sense of movement and direction. Abstract geometric shapes, including small squares and circles, along with dashed lines, are interspersed around the arrows, adding a modern, stylized aesthetic. The overall visual conveys a concept
Free with trial This minimalist graphic features a bold red line forming a downward-pointing arrow shape. The design is clean and flat, set against a solid white background to emphasize the negative trend. It serves as a clear visual representation of financial loss, market decline, or decreasing performance metrics. Chart decrease icon vectors A simple red line graph icon showing a downward trend on a white background. This minimalist graphic features a bold red line forming a downward-pointing arrow shape. The design is clean and flat, set against a solid white background to emphasize the negative trend. It serves as a clear visual representation of financial loss, market decline, or decreasing performance metrics
Free with trial A comprehensive set of line icons illustrating investment attraction and market notifications. Icons feature money magnets, growth sprouts, piggy banks with brain symbols, and various notification bells for price alerts. Ideal for stock trading applications, investment advice blogs, and financial education materials that focus on wealth accumulation, strategy building, and staying. Chart decrease icon vectors Financial Attraction and Market Alert Icon Set. A comprehensive set of line icons illustrating investment attraction and market notifications. Icons feature money magnets, growth sprouts, piggy banks with brain symbols, and various notification bells for price alerts. Ideal for stock trading applications, investment advice blogs, and financial education materials that focus on wealth accumulation, strategy building, and staying
Free with trial Three blue bars decreasing in height with a red downward zigzag arrow on the right side. Chart decrease icon illustrations Declining bar chart with downward arrow graphic. Three blue bars decreasing in height with a red downward zigzag arrow on the right side
Free with trial A red arrow pointing downward in a jagged line on a white background, indicating a decline or decrease. Chart decrease icon illustrations A red arrow pointing downward in a jagged line
Free with trial A bright red arrow curves downwards, indicating a decline or decrease, isolated on a clean white background. Chart decrease icon illustrations Red downward arrow isolated on white background. A bright red arrow curves downwards, indicating a decline or decrease, isolated on a clean white background
Free with trial A 3D rendered blue arrow symbol, depicted as a zig-zag line with an arrowhead pointing downwards, signifies a negative trend or decline. The object is isolated on a clean white background, making it suitable for representing financial data, economic downturns, or performance metrics. Chart decrease icon illustrations 3D Blue Arrow Graph Showing Downward Trend on White Background decrease. A 3D rendered blue arrow symbol, depicted as a zig-zag line with an arrowhead pointing downwards, signifies a negative trend or decline. The object is isolated on a clean white background, making it suitable for representing financial data, economic downturns, or performance metrics
Free with trial An abstract graphic featuring a series of vertical bars with rounded tops, arranged in varying heights along a horizontal base. The bars display a smooth gradient color transition, starting with blue on the left and shifting to purple and pink on the right. Set against a clean white background, this modern and minimalist design evokes concepts of data visualization, statistical analysis, or an audio equalizer. It's ideal for illustrating growth, progress, or comparative data in presentations, infographics, web design, or technology-related content. Chart decrease icon vectors Abstract Gradient Bar Chart or Equalizer Graphic. An abstract graphic featuring a series of vertical bars with rounded tops, arranged in varying heights along a horizontal base. The bars display a smooth gradient color transition, starting with blue on the left and shifting to purple and pink on the right. Set against a clean white background, this modern and minimalist design evokes concepts of data visualization, statistical analysis, or an audio equalizer. It's ideal for illustrating growth, progress, or comparative data in presentations, infographics, web design, or technology-related content.
Free with trial This minimalist vector illustration depicts a declining line chart against a clean background. The graphic features a prominent red arrow pointing downward, symbolizing a negative trend or financial loss. The composition uses a professional color palette of muted grays and a bold red accent to highlight the downward movement of the data points. Chart decrease icon vectors A simple line graph showing a downward trend in business performance metrics. This minimalist vector illustration depicts a declining line chart against a clean background. The graphic features a prominent red arrow pointing downward, symbolizing a negative trend or financial loss. The composition uses a professional color palette of muted grays and a bold red accent to highlight the downward movement of the data points
Free with trial A conceptual 3D illustration of cybersecurity and digital safety. Three blocks represent key components of a security strategy: a glowing shield for protection, a padlock for defense, and a chart showing risk reduction. This image symbolizes the implementation of robust defense mechanisms to mitigate online threats and protect sensitive data. The technological background with network lines and graphs highlights the context of information technology, data analysis, and modern security challenges. Ideal for illustrating topics on internet security, data privacy, and risk management. Chart decrease icon illustrations Cybersecurity Defense and Risk Management Concept. A conceptual 3D illustration of cybersecurity and digital safety. Three blocks represent key components of a security strategy: a glowing shield for protection, a padlock for defense, and a chart showing risk reduction. This image symbolizes the implementation of robust defense mechanisms to mitigate online threats and protect sensitive data. The technological background with network lines and graphs highlights the context of information technology, data analysis, and modern security challenges. Ideal for illustrating topics on internet security, data privacy, and risk management.
Free with trial This minimalist vector illustration features a stylized baby carriage positioned next to a downward-trending line graph. The graph includes a bold red arrow pointing toward several small baby bottle icons, symbolizing a reduction in population growth. The clean lines and flat color palette create a professional and conceptual visual representation of demographic trends. Chart decrease icon vectors A graphic illustration showing a decline in birth rates with a baby carriage icon. This minimalist vector illustration features a stylized baby carriage positioned next to a downward-trending line graph. The graph includes a bold red arrow pointing toward several small baby bottle icons, symbolizing a reduction in population growth. The clean lines and flat color palette create a professional and conceptual visual representation of demographic trends
Free with trial Set of six black percent symbols combined with up and down arrows in flat vector style representing increase decrease and adjustment concepts. Generative AI. Chart decrease icon vectors Black percent symbols with up and down arrows flat vector icons. Set of six black percent symbols combined with up and down arrows in flat vector style representing increase decrease and adjustment concepts. Generative AI
Free with trial This minimalist graphic illustration features a bold red line chart trending downwards against a clean background. Several small downward-pointing arrows are positioned along the slope to emphasize the decline. The composition uses a flat design aesthetic with high contrast, conveying a clear message of loss, reduction, or negative performance in a professional context. Chart decrease icon vectors A red line graph showing a sharp downward trend with multiple directional arrows. This minimalist graphic illustration features a bold red line chart trending downwards against a clean background. Several small downward-pointing arrows are positioned along the slope to emphasize the decline. The composition uses a flat design aesthetic with high contrast, conveying a clear message of loss, reduction, or negative performance in a professional context
Free with trial The image features a striking red downward arrow with a jagged, zigzag pattern. The arrow is bold and prominent, indicating a significant decline or decrease in a clear and impactful manner. Chart decrease icon illustrations A bold red downward arrow with a jagged, zigzag pattern. The image features a striking red downward arrow with a jagged, zigzag pattern. The arrow is bold and prominent, indicating a significant decline or decrease in a clear and impactful manner