Free with trial Arrow trend-down icon vector set on white background. EPS 10. Chart decrease icon vectors Arrow trend-down icon isolated on white background. Arrow trend-down icon vector set on white background. EPS 10
Free with trial Rescission chart in modern design style, concept of business loss. Chart decrease icon vectors Rescission chart in modern design style, concept of business loss
Free with trial Hand drawn bar chart with a downward red arrow and sale tag illustrating a business recession or price drop. Chart decrease icon vectors Hand drawn bar chart with a downward red arrow and sale tag illustrating a business recession or price drop
Free with trial Arrow trend-down icon vector set on white background. EPS 10. Chart decrease icon vectors Arrow trend-down icon isolated on white background. Arrow trend-down icon vector set on white background. EPS 10
Free with trial Arrow trend-down icon vector set on white background. EPS 10. Chart decrease icon vectors Arrow trend-down icon isolated on white background. Arrow trend-down icon vector set on white background. EPS 10
Free with trial Arrow trend-down icon vector set on white background. EPS 10. Chart decrease icon vectors Arrow trend-down icon isolated on white background. Arrow trend-down icon vector set on white background. EPS 10
Free with trial Arrow trend-down icon vector set on white background. EPS 10. Chart decrease icon vectors Arrow trend-down icon isolated on white background. Arrow trend-down icon vector set on white background. EPS 10
Free with trial Up and down arrow direction icon set in generic style. Upward and downward sign symbol illustration. Chart decrease icon vectors Up and down arrow direction icon set in generic style. Upward and downward sign symbol
Free with trial A circular icon with a thick gold border contains a golden DNA helix symbol on a black background. To the right of the DNA helix, two jagged arrows point downwards, indicating a downward trend or decline. The overall design is sleek and symbolic, suggesting concepts related to genetic research, health trends, or scientific data analysis. Chart decrease icon illustrations Golden DNA Helix Icon with Downward Trend Arrows on Black Circle with Gold Border genetics. A circular icon with a thick gold border contains a golden DNA helix symbol on a black background. To the right of the DNA helix, two jagged arrows point downwards, indicating a downward trend or decline. The overall design is sleek and symbolic, suggesting concepts related to genetic research, health trends, or scientific data analysis
Free with trial A 3D bar chart with teal and tan bars shows a pink arrow pointing downwards, representing a decline or negative trend. Clear details and vibrant colors enhance visual appeal. Chart decrease icon illustrations 3D Bar Chart With Teal Bars And Pink Downward Arrow Indicating Decline graph decrease. A 3D bar chart with teal and tan bars shows a pink arrow pointing. A 3D bar chart with teal and tan bars shows a pink arrow pointing downwards, representing a decline or negative trend. Clear details and vibrant colors enhance visual appeal
Free with trial Hand drawn bar chart with declining arrow showing economic recession and financial loss. Chart decrease icon vectors Hand drawn bar chart with declining arrow showing economic recession and financial loss
Free with trial Red stock market investment decline chart. Downward arrow. Negative growth concept, business development, declining profits. Analytical financial chart. Trend. Changes in exchange rates, interest rates. Chart decrease icon vectors Red stock market investment decline chart. Downward arrow. Negative growth concept, business development, declining profits.
Free with trial Graph icon indicating growth and data analysis, perfect for business presentations and financial reports. visual representation of progress ,Generative ai. Chart decrease icon illustrations Graph icon, a comprehensive symbol of data analysis, growth, and business trends for effective presentations. Graph icon indicating growth and data analysis, perfect for business presentations and financial reports. visual representation of progress ,Generative ai
Free with trial Up and down arrow icon set in generic style. Upward and downward sign symbol illustration. Chart decrease icon vectors Up and down arrow icon set in generic style. Upward and downward sign symbol
Free with trial Declining Bar Chart with Downward Arrow Representing Economic Downturn and Financial Loss. Chart decrease icon vectors Declining Bar Chart with Downward Arrow Representing Economic Downturn and Financial Loss
Free with trial Illustration shows a purple downward arrow with a white percentage symbol, representing decrease or discount in a clean style. Calm mood. Generative AI. Chart decrease icon vectors Downward arrow with percentage symbol in purple vector illustration for discount and decrease concepts. Illustration shows a purple downward arrow with a white percentage symbol, representing decrease or discount in a clean style. Calm mood. Generative AI
Free with trial A 3D rendered graphic depicts a bar chart with three vertical bars of varying heights: two blue bars flanking a taller yellow bar. At the top of the yellow bar, a central yellow sphere is connected by white rods to two smaller blue spheres, resembling a molecular structure or a network. The entire graphic is isolated on a white background, suggesting concepts of data analysis, growth, and. Chart decrease icon illustrations 3D Rendered Bar Chart with Connecting Spheres Representing Data Analysis graph statistics. A 3D rendered graphic depicts a bar chart with three vertical bars of varying heights: two blue bars flanking a taller yellow bar. At the top of the yellow bar, a central yellow sphere is connected by white rods to two smaller blue spheres, resembling a molecular structure or a network. The entire graphic is isolated on a white background, suggesting concepts of data analysis, growth, and
Free with trial Global recession and financial decline icon showing downward arrow and world economy, line art icon set. Chart decrease icon vectors Global recession and financial decline icon showing downward arrow and world economy, line art icon set
Free with trial Set line Gold bars, Briefcase, Dollar rate decrease and. Business infographic template. Vector. Chart decrease icon vectors Set line Gold bars, Briefcase, Dollar rate decrease and . Business infographic template. Vector
Free with trial Bar chart showing downward trend with dollar symbol. Chart decrease icon vectors Bar chart showing downward trend with dollar symbol
Free with trial Bar chart showing downward trend with dollar symbol. Chart decrease icon vectors Bar chart showing downward trend with dollar symbol
Free with trial Bar chart showing downward trend with dollar symbol. Chart decrease icon vectors Bar chart showing downward trend with dollar symbol
Free with trial Bar chart showing downward trend with dollar symbol. Chart decrease icon vectors Bar chart showing downward trend with dollar symbol
Free with trial Economic Loss icon Flat set in black and white color outline vector. Chart decrease icon vectors Economic Loss Icon for Financial Downturns, Business Challenges, and Market Analysis Illustrations. Economic Loss icon Flat set in black and white color outline vector
Free with trial Bar chart with decreasing orange bars and a downward red arrow illustrating financial decline. Chart decrease icon vectors Bar chart with decreasing orange bars and a downward red arrow illustrating financial decline
Free with trial Global recession icon showing declining graph and downward arrow with globe and money, line art icon set. Chart decrease icon vectors Global recession icon showing declining graph and downward arrow with globe and money, line art icon set
Free with trial A colorful bar graph depicting an upward trend with a minor dip, presented as a document icon. The design uses bold colors and clean lines for a modern, data-driven aesthetic. Ideal for presentations or reports. Chart decrease icon illustrations Vibrant Bar Graph on Document Icon: Upward Trend with Slight Dip, Colorful Data Visualization. A colorful bar graph depicting an upward trend with a minor dip, presented as a document icon. The design uses bold colors and clean lines for a modern, data-driven aesthetic. Ideal for presentations or reports
Free with trial Web report line icon. Continuous one line with curl. Column graph sign. Growth diagram symbol. Web report single outline ribbon. Loop curve pattern. Vector. Chart decrease icon vectors Web report line icon. Column graph sign. Continuous line with curl. Vector. Web report line icon. Continuous one line with curl. Column graph sign. Growth diagram symbol. Web report single outline ribbon. Loop curve pattern. Vector
Free with trial Web report line icon. Continuous one line with curl. Column graph sign. Growth diagram symbol. Web report single outline ribbon. Loop curve pattern. Vector. Chart decrease icon illustrations Web report line icon. Column graph sign. Continuous line with curl. Vector. Web report line icon. Continuous one line with curl. Column graph sign. Growth diagram symbol. Web report single outline ribbon. Loop curve pattern. Vector
Free with trial Downward trend in global recession icon, financial decline with world map and arrow, line art icon set. Chart decrease icon vectors Downward trend in global recession icon, financial decline with world map and arrow, line art icon set
Free with trial Percent up and down icon. Percentage upward and downward sign. Growth and decline symbol vector. Chart decrease icon vectors Percent up and down icon. Percentage upward and downward sign. Growth and decline symbol
Free with trial Graph and diagram from boats with decrease. Finance and business concepts. 3D Illustration isolated. 3D rendering on blue background. Chart decrease icon illustrations Graph and diagram from boats with decrease. Finance and business concepts. 3D Illustration isolated.
Free with trial A modern smartphone displays a stock market candlestick chart with a downward-trending red arrow indicating a significant loss. Several gold coins with dollar signs are scattered around the phone, and a red bell icon with an exclamation mark hovers above, suggesting an alert or warning. A label on the arrow reads "LOSS. Chart decrease icon illustrations Smartphone Displaying Stock Market Chart with Falling Red Arrow and Gold Coins mobile trading. A modern smartphone displays a stock market candlestick chart with a downward-trending red arrow indicating a significant loss. Several gold coins with dollar signs are scattered around the phone, and a red bell icon with an exclamation mark hovers above, suggesting an alert or warning. A label on the arrow reads "LOSS
Free with trial A financial illustration shows coins decreasing in size along a horizontal axis, representing devaluation. An upward-pointing arrow indicates increasing inflation percentages, with labels of "4%", "20%", and "50%". The chart is labeled "INFLATION" at the top, with percentages scattered around. Broken pieces from a large coin suggest fragmentation and loss of value. The background features a subtle line graph, reinforcing the economic theme. Chart decrease icon illustrations Inflation increasing and devaluing money, showing a financial chart with coins and an arrow going up. A financial illustration shows coins decreasing in size along a horizontal axis, representing devaluation. An upward-pointing arrow indicates increasing inflation percentages, with labels of "4%", "20%", and "50%". The chart is labeled "INFLATION" at the top, with percentages scattered around. Broken pieces from a large coin suggest fragmentation and loss of value. The background features a subtle line graph, reinforcing the economic theme.
Free with trial Percentage sign icon, related to accounting, ideal for financial, tax, or business-related designs. Chart decrease icon vectors Professional Percentage Sign Icon for Accounting Purposes. Percentage sign icon, related to accounting, ideal for financial, tax, or business-related designs.
Free with trial Percentage sign icon, related to accounting, ideal for financial, tax, or business-related designs. Chart decrease icon vectors Professional Percentage Sign Icon for Accounting Purposes. Percentage sign icon, related to accounting, ideal for financial, tax, or business-related designs.
Free with trial Set line Old hourglass with sand, Arrow, Location, Layers, Clock, Intersection point and icon. Vector. Chart decrease icon illustrations Set line Old hourglass with sand, Arrow, Location, Layers, Clock, Intersection point and icon. Vector
Free with trial Minimal set of Wholesale goods, Graph chart and Credit card line icons. Phone, cellphone ui interface mockup. Work home icons. For web development. Vector. Chart decrease icon vectors Minimal set of Wholesale goods, Graph chart and Credit card line icons. For web development. Vector. Minimal set of Wholesale goods, Graph chart and Credit card line icons. Phone, cellphone ui interface mockup. Work home icons. For web development. Vector
Free with trial Declining bar chart with downward arrow graphic representing economic downturn and financial loss. Chart decrease icon vectors Declining bar chart with downward arrow graphic representing economic downturn and financial loss
Free with trial This vibrant 3D bar chart illustrates upward trending data, perfect for presentations or reports on financial growth, market analysis, or business success. The colorful blocks represent different data points. Chart decrease icon illustrations Colorful 3D Bar Chart Showing Business Growth and Success. This vibrant 3D bar chart illustrates upward trending data, perfect for presentations or reports on financial growth, market analysis, or business success. The colorful blocks represent different data points.
Free with trial Inventory cart, Snowflake and 3d chart minimal line icons. Neon laser 3d lights. People icons. For web, application, printing. Warehouse goods, Snow, Presentation column. Support job. Vector. Chart decrease icon vectors Inventory cart, Snowflake and 3d chart minimal line icons. For web application, printing. Neon laser 3d lights. Vector. Inventory cart, Snowflake and 3d chart minimal line icons. Neon laser 3d lights. People icons. For web, application, printing. Warehouse goods, Snow, Presentation column. Support job. Vector
Free with trial Percent arrow down and up icon on black circle. Percentage decline and growth sign symbol vector. Chart decrease icon vectors Percent arrow down and up icon on black circle. Percentage decline and growth sign symbol
Free with trial Chart icons for data analysis vector art design, Minimalist business charts icons bar graphs, line graphs, and pie charts vector illustration on white background the image is generated using AI. Chart decrease icon vectors Chart icons for data analysis vector art design, Minimalist business charts icons bar graphs, line graphs, and pie charts vector
Free with trial Business Analytics And Data Visualization Line Icon Set. Financial Growth, Market Trends, And Performance Analysis Outline Symbol Collection. Editable Stroke. Isolated Vector Illustration. Chart decrease icon vectors Business Analytics And Data Visualization Line Icon Set. Financial Growth, Market Trends, And Performance Analysis
Free with trial Falling bar chart icons set with downward arrow �\' decline, loss and recession analytics �\' black business vector. Chart decrease icon vectors . Falling bar chart icons set with downward arrow �' decline, loss and recession analytics black business vector
Free with trial Falling chart with coins, symbolizing financial loss, crisis, or declining income. Modern vector illustration isolated on white background, hand drawn, flat design. Chart decrease icon vectors Falling chart with coins, symbolizing financial loss, crisis, or declining income. Modern vector illustration isolated
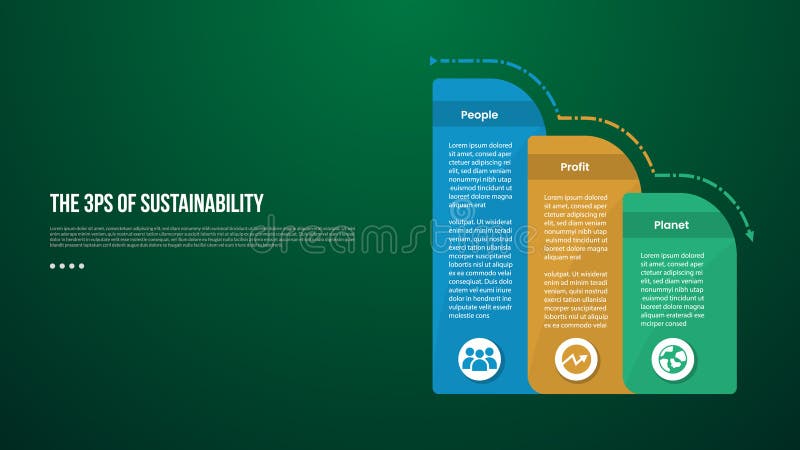
Free with trial The 3 Ps of Sustainability infographic template with round box container decrease gradually with dark background style with 3 point for slide presentation vector. Chart decrease icon illustrations The 3 Ps of Sustainability infographic template with round box container decrease gradually with dark background style with 3
Free with trial Bar chart with arrow pointing down, illustrating economic decline, business loss, or negative trend data. Chart decrease icon vectors Bar chart with arrow pointing down, illustrating economic decline, business loss, or negative trend data
Free with trial Set Isometric line Global economic crisis, Mobile stock trading, and Briefcase icon. Vector. Chart decrease icon illustrations Set Isometric line Global economic crisis, Mobile stock trading, and Briefcase icon. Vector
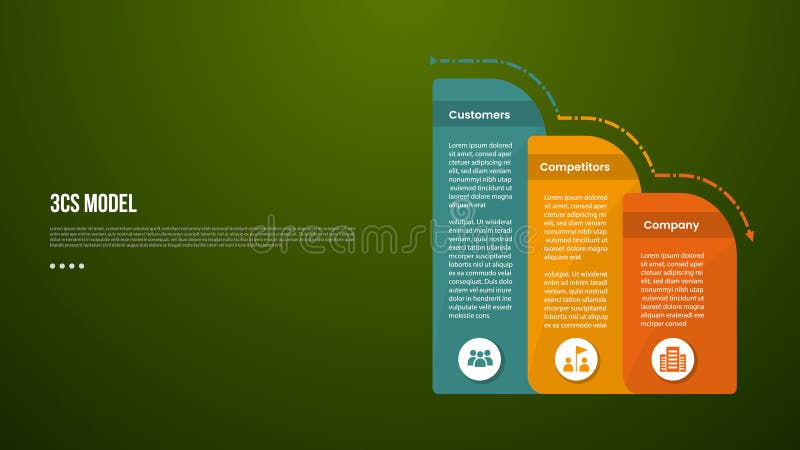
Free with trial 3C analysis business model infographic template with round box container decrease gradually with dark background style with 3 point for slide presentation vector. Chart decrease icon illustrations 3C analysis business model infographic template with round box container decrease gradually with dark background style with 3
Free with trial Charts and graphs, Presentation and Report. Graph line icons. Analytics linear icon set. Line icons set. Vector. Chart decrease icon illustrations Graph line icons. Charts and graphs, Presentation and Report. Linear icon set. Line icons. Vector. Charts and graphs, Presentation and Report. Graph line icons. Analytics linear icon set. Line icons set. Vector
Free with trial Charts and graphs, Presentation and Report. Graph line icons. Analytics linear icon set. Line icons set. Vector. Chart decrease icon illustrations Graph line icons. Charts and graphs, Presentation and Report. Linear icon set. Line icons. Vector. Charts and graphs, Presentation and Report. Graph line icons. Analytics linear icon set. Line icons set. Vector
Free with trial Rescission chart in modern design style, concept of business loss. Chart decrease icon vectors Rescission chart in modern design style, concept of business loss
Free with trial Decreasing bar graph with downward arrow icon representing financial loss, recession, and business failure. Chart decrease icon vectors Decreasing bar graph with downward arrow icon representing financial loss, recession, and business failure
Free with trial FAB analysis model infographic template with round box container decrease gradually with dark background style with 3 point for slide presentation vector. Chart decrease icon illustrations FAB analysis model infographic template with round box container decrease gradually with dark background style with 3 point for
Free with trial Minimalist graph icon showing growth and fluctuation. Perfect for finance, business reports, market analysis, and data presentation projects. Chart decrease icon vectors Minimalist graph icon showing growth and fluctuation. Perfect for finance, business reports, market analysis, and data
Free with trial Set line Global economic crisis, Dollar rate decrease and Money bomb dollar. Business infographic template. Vector. Chart decrease icon illustrations Set line Global economic crisis, Dollar rate decrease and Money bomb dollar. Business infographic template. Vector
Free with trial Set line Money bag, Dollar rate decrease and Drop in crude oil price. Business infographic template. Vector. Chart decrease icon vectors Set line Money bag, Dollar rate decrease and Drop in crude oil price. Business infographic template. Vector
Free with trial Set line Server, Data, Web Hosting, Cost reduction, Location with sales funnel and security lock icon. Vector. Chart decrease icon vectors Set line Server, Data, Web Hosting, Cost reduction, Location with sales funnel and security lock icon. Vector
Free with trial STP marketing infographic template with round box container decrease gradually with dark background style with 3 point for slide presentation vector. Chart decrease icon vectors STP marketing infographic template with round box container decrease gradually with dark background style with 3 point for slide
Free with trial Grey line Property and housing market collapse icon isolated seamless pattern on white background. Falling property prices. Real estate stock risk or economic recession. Vector. Chart decrease icon illustrations Grey line Property and housing market collapse icon isolated seamless pattern on white background. Falling property
Free with trial LMS learning management system infographic template with round box container decrease gradually with dark background style with 3 point for slide presentation vector. Chart decrease icon vectors LMS learning management system infographic template with round box container decrease gradually with dark background style with 3
Free with trial Young businessman analyzing a descending financial candlestick chart on a computer screen. Financial Instability concept. trend modern vector flat illustration. Chart decrease icon vectors Young businessman analyzing a descending financial candlestick chart on a computer screen. Financial Instability concept.
Free with trial Financial Crisis, Money Stack Down, Costs Cut Solid Flat Vector Icon Isolated on White Background. Chart decrease icon vectors Financial Crisis, Money Stack Down, Costs Cut Solid Flat Vector Icon Isolated on White Background
Free with trial Financial Crisis, Money Stack Down, Costs Cut Solid Flat Vector Icon Isolated on White Background. Chart decrease icon illustrations Financial Crisis, Money Stack Down, Costs Cut Solid Flat Vector Icon Isolated on White Background
Free with trial Set Dollar rate decrease, , and Credit card on seamless pattern. Vector. Chart decrease icon illustrations Set Dollar rate decrease, , and Credit card on seamless pattern. Vector
Free with trial Vector illustration of a decreasing bar chart with a downward trend arrow showing financial loss or recession. Chart decrease icon vectors Vector illustration of a decreasing bar chart with a downward trend arrow showing financial loss or recession
Free with trial PEST analysis infographic template with dark gradient background style with round vertical box container gradually decrease on right column 4 point for slide presentation vector. Chart decrease icon illustrations PEST analysis infographic template with dark gradient background style with round vertical box container gradually decrease on
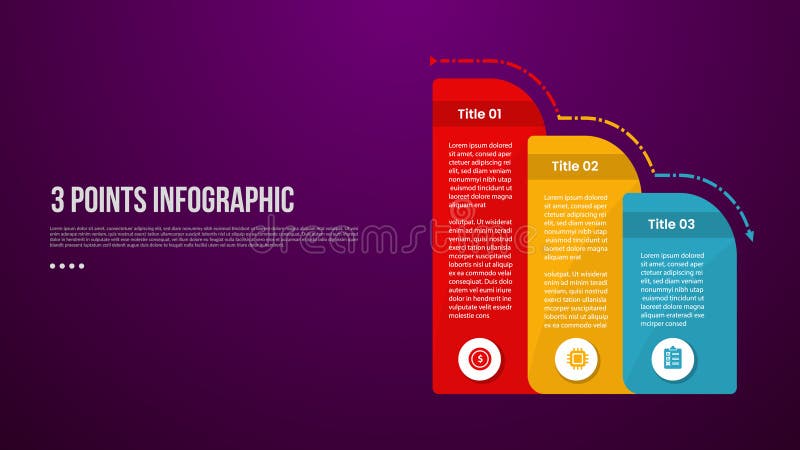
Free with trial 3 points or step process infographic with round box container decrease gradually with modern dark style for slide presentation vector. Chart decrease icon illustrations 3 points or step process infographic with round box container decrease gradually with modern dark style for slide presentation
Free with trial Set line Dollar rate decrease Shutdown of factory Money bomb dollar crisis Drop in crude oil price Falling property prices Contract money and pen and Bank building icon. Vector. Chart decrease icon illustrations Set line Dollar rate decrease, Shutdown of factory, Money bomb dollar crisis, Drop in crude oil price, Falling property. Set line Dollar rate decrease Shutdown of factory Money bomb dollar crisis Drop in crude oil price Falling property prices Contract money and pen and Bank building icon. Vector.
Free with trial Set line Laptop with browser window Browser Financial growth decrease and Website stocks market. Business infographic template. Vector. Chart decrease icon illustrations Set line Laptop with browser window, Browser, Financial growth decrease and Website stocks market. Business infographic
Free with trial A green flag waving above pink descending bar chart symbolizing decline or loss in data visualization. Generative AI. Chart decrease icon illustrations Green flag waving above pink descending bar chart symbolizing decline or loss in data visualization
Free with trial Eight circular icons with black backgrounds each feature a different chart or graph symbol. The frames are bordered by a sequence of colorful lines: red, green, blue, and yellow. The icons include bar graphs, line graphs, a pie chart, and scatter plots, all depicted in white. Each symbol includes axes and grid patterns, indicating statistical or financial data representation. The arrangement is in two rows of four, emphasizing symmetry and variety in chart types. A i Generated. Chart decrease icon vectors Collection of eight different chart and graph icons displayed in circular black frames with colorful borders. Eight circular icons with black backgrounds each feature a different chart or graph symbol. The frames are bordered by a sequence of colorful lines: red, green, blue, and yellow. The icons include bar graphs, line graphs, a pie chart, and scatter plots, all depicted in white. Each symbol includes axes and grid patterns, indicating statistical or financial data representation. The arrangement is in two rows of four, emphasizing symmetry and variety in chart types. A i Generated
Free with trial Set line Stop delivery cargo truck Dollar rate decrease Money bomb dollar crisis Hanging sign with Sale Mobile stock trading Drop crude oil price and Glass money jar coin icon. Vector. Chart decrease icon illustrations Set line Stop delivery cargo truck, Dollar rate decrease, Money bomb dollar crisis, Hanging sign with Sale, Mobile stock. Set line Stop delivery cargo truck Dollar rate decrease Money bomb dollar crisis Hanging sign with Sale Mobile stock trading Drop crude oil price and Glass money jar coin icon. Vector.
Free with trial Grey line Global economic crisis news icon isolated seamless pattern on white background. World finance crisis. Vector. Chart decrease icon illustrations Grey line Global economic crisis news icon isolated seamless pattern on white background. World finance crisis. Vector
Free with trial Set Safe, Glass money jar with coin and Dollar rate decrease. Business infographic template. Vector. Chart decrease icon illustrations Set Safe, Glass money jar with coin and Dollar rate decrease. Business infographic template. Vector
Free with trial Set line Dollar rate decrease Contract money and pen Briefcase Gold bars Falling property prices Mobile stock trading Debt ball chained coin and Stop delivery cargo truck icon. Vector. Chart decrease icon illustrations Set line Dollar rate decrease, Contract money and pen, Briefcase, Gold bars, Falling property prices, Mobile stock. Set line Dollar rate decrease Contract money and pen Briefcase Gold bars Falling property prices Mobile stock trading Debt ball chained coin and Stop delivery cargo truck icon. Vector.
Free with trial Dark arrow with percentage symbol pointing down inside a circle graphic icon for financial decline or discount. Chart decrease icon vectors Dark arrow with percentage symbol pointing down inside a circle graphic icon for financial decline or discount
Free with trial A gleaming gold coin with a ridged edge is depicted against a clean white background. The coin's face features a black circular inset containing a golden bar chart with bars decreasing in height from left to right, accompanied by a downward-pointing arrow. This visual represents financial decline or economic loss. Chart decrease icon illustrations Gold Coin with Black Circle Featuring a Downward Trending Bar Chart and Arrow Keywords: coin, gold, money, finance, business. A gleaming gold coin with a ridged edge is depicted against a clean white background. The coin's face features a black circular inset containing a golden bar chart with bars decreasing in height from left to right, accompanied by a downward-pointing arrow. This visual represents financial decline or economic loss
Free with trial Hand drawn style illustration of a falling down chart on a calendar with a blue arrow, representing economic decline. Chart decrease icon vectors Hand drawn style illustration of a falling down chart on a calendar with a blue arrow, representing economic decline