Free with trial A comprehensive collection of flat line design icons representing key concepts in business, finance, and data analytics. The set includes various charts (bar, line, pie), a speedometer, a magnifying glass with a graph, financial documents with checkmarks, a target with an arrow, a dollar sign, a percentage symbol, and directional arrows for growth and decline. These versatile vector elements are ideal for presentations, reports, websites, and applications focused on statistics, performance, strategy, and financial insights. Chart decrease icon illustrations Business and Data Analytics Flat Line Icons Set. A comprehensive collection of flat line design icons representing key concepts in business, finance, and data analytics. The set includes various charts (bar, line, pie), a speedometer, a magnifying glass with a graph, financial documents with checkmarks, a target with an arrow, a dollar sign, a percentage symbol, and directional arrows for growth and decline. These versatile vector elements are ideal for presentations, reports, websites, and applications focused on statistics, performance, strategy, and financial insights.
Free with trial Economy crisis flat composition with human hands holding calculator and economic recession financial symbols vector illustration. Chart decrease icon vectors Economy Crisis Composition. Economy crisis flat composition with human hands holding calculator and economic recession financial symbols vector illustration
Free with trial Conceptual line art depicting business analysis and market trends. Chart decrease icon illustrations Business Analysis Magnifying Glass, Thumbs Up, Declining Graph. Conceptual line art depicting business analysis and market trends.
Free with trial A single, gleaming golden arrow curves downwards against a white background. The arrow has a polished, metallic finish that reflects light, giving it a luxurious and dynamic appearance. The shape suggests a downward trend, decline, or negative movement. It is presented in a clean studio shot, isolated from any other elements, making it a versatile graphic symbol. Chart decrease icon illustrations A Gleaming Golden Downward Curved Arrow on a White Background metallic shiny. A single, gleaming golden arrow curves downwards against a white background. The arrow has a polished, metallic finish that reflects light, giving it a luxurious and dynamic appearance. The shape suggests a downward trend, decline, or negative movement. It is presented in a clean studio shot, isolated from any other elements, making it a versatile graphic symbol
Free with trial Dollar currency icons set with arrows for financial growth, money loss, exchange and transactions. Vector illustration of money symbols. Chart decrease icon vectors Dollar currency icons set with arrows for financial growth, money loss, exchange and transactions
Free with trial Business arrow up success seamless pattern isolated on black background. Simple background. Chart decrease icon vectors Business arrow up success seamless pattern isolated on black background
Free with trial Business arrow up success seamless pattern isolated on white background. Simple background. Chart decrease icon vectors Business arrow up success seamless pattern isolated on white background
Free with trial A stark white line graph depicts a significant downward trend with sharp fluctuations against a dark grid. Chart decrease icon illustrations Sharp downward trend illustrated by a jagged white line graph on a black grid background. A stark white line graph depicts a significant downward trend with sharp fluctuations against a dark grid
Free with trial The image displays a collection of editable vector assets featuring percentage symbols and arrows indicating upward and downward trends. The left side shows a red downward arrow with the text Business Rate next to it. The main section contains various combinations of black and red arrows pointing up or down paired with percentage signs all isolated on transparent background. Chart decrease icon vectors Business rate percentage up and down arrow icons isolated on transparent background. The image displays a collection of editable vector assets featuring percentage symbols and arrows indicating upward and downward trends. The left side shows a red downward arrow with the text Business Rate next to it. The main section contains various combinations of black and red arrows pointing up or down paired with percentage signs all isolated on transparent background
Free with trial Blue curved arrow pointing down and right vector illustration. Business growth, financial decline, process flow, navigation path, strategic movement, data visualization. Wavy directional pointer. Chart decrease icon vectors Blue curved arrow pointing down and right for business growth and process flow vector illustration. Blue curved arrow pointing down and right vector illustration. Blue curved arrow pointing down and right vector illustration. Business growth, financial decline, process flow, navigation path, strategic movement, data visualization. Wavy directional pointer
Free with trial This vector graphic depicts a magnifying glass focused on a female figure and a declining bar graph, symbolizing the. Chart decrease icon illustrations Women\'s Job Loss Magnifying Glass on Female Employment Decline. This vector graphic depicts a magnifying glass focused on a female figure and a declining bar graph, symbolizing the.
Free with trial Decreasing arrow and golden coins heap. Crisis, money and loss concept. 3d rendering. Chart decrease icon illustrations Decreasing arrow and golden coins heap
Free with trial A glossy, transparent blue arrow curves downwards against a clean white background. The arrow's smooth surface reflects light, creating highlights and a subtle shadow beneath it. This 3D rendered graphic symbolizes direction, decline, or a downward trend. Chart decrease icon illustrations Blue Glass Arrow Pointing Downward on White Background direction. A glossy, transparent blue arrow curves downwards against a clean white background. The arrow's smooth surface reflects light, creating highlights and a subtle shadow beneath it. This 3D rendered graphic symbolizes direction, decline, or a downward trend
Free with trial A clean and modern isometric bar graph illustration. Three colored bars, blue, green, and yellow, represent data points with corresponding numerical values displayed above each bar. The graphic is set against a white background, making it suitable for various presentations, reports, or website designs related to data analysis, business, or education. The simple design offers a clear visual representation of data comparison. Chart decrease icon illustrations Isometric Bar Graph Illustrating Data and Statistics. A clean and modern isometric bar graph illustration. Three colored bars, blue, green, and yellow, represent data points with corresponding numerical values displayed above each bar. The graphic is set against a white background, making it suitable for various presentations, reports, or website designs related to data analysis, business, or education. The simple design offers a clear visual representation of data comparison.
Free with trial A bold, three-dimensional red arrow points directly downwards. The arrow has a glossy finish and sharp, defined edges, appearing to be made of a solid, reflective material. It is presented in isolation against a stark white background, emphasizing its form and directional meaning. Chart decrease icon illustrations 3D rendered bright red downward pointing arrow on a white background direction. A bold, three-dimensional red arrow points directly downwards. The arrow has a glossy finish and sharp, defined edges, appearing to be made of a solid, reflective material. It is presented in isolation against a stark white background, emphasizing its form and directional meaning
Free with trial Vector illustration of a downward arrow symbolizing economic decline, recession, and financial downturn. Chart decrease icon vectors Vector illustration of a downward arrow symbolizing economic decline, recession
Free with trial Isometric business analyst professional composition with conceptual financial analysis icons and people vector illustration. Chart decrease icon vectors Business Growth Arrows Composition. Isometric business analyst professional composition with conceptual financial analysis icons and people vector illustration
Free with trial Colorful vector icons showing graphs charts arrows lightbulb target briefcase for analytics strategy and success. Chart decrease icon illustrations Illustrated Business Data Analysis and Growth Concepts. Colorful vector icons showing graphs charts arrows lightbulb target briefcase for analytics strategy and success
Free with trial A circular golden coin with a black glossy face. On the black surface, a golden bar graph shows a downward trend, with the bars decreasing in height from left to right. A golden arrow points downwards, emphasizing the decline. The coin is isolated on a white background. Chart decrease icon illustrations Golden Coin with Black Background Featuring a Falling Bar Graph and Downward Arrow falling graph. A circular golden coin with a black glossy face. On the black surface, a golden bar graph shows a downward trend, with the bars decreasing in height from left to right. A golden arrow points downwards, emphasizing the decline. The coin is isolated on a white background
Free with trial A clean line drawing showcases a magnifying glass focusing on a hand holding a declining bar graph with a downward. Chart decrease icon illustrations Declining Market Analysis Magnifying Glass on Loss Trend. A clean line drawing showcases a magnifying glass focusing on a hand holding a declining bar graph with a downward.
Free with trial Conceptual image showing a magnifying glass focusing on a business presentation with a declining graph. Chart decrease icon illustrations Decline Analysis Magnifying Glass on Business Loss Graph. Conceptual image showing a magnifying glass focusing on a business presentation with a declining graph.
Free with trial Concept of economic crash with connected icons. Chart decrease icon illustrations Concept of economic crash
Free with trial Minimal glassmorphism arrows pointing up and down representing direction, navigation, or data flow, 3d rendering. Chart decrease icon vectors Minimal glassmorphism arrows pointing up and down representing direction, navigation, or data flow, 3d rendering
Free with trial Dollar and bitcoin Coins with Upward Arrows Representing Financial Growth in Minimalist Flat Style. Chart decrease icon vectors Dollar and bitcoin Coins with Upward Arrows Representing Financial Growth in Minimalist Flat Style
Free with trial A black and white line drawing depicts a magnifying glass focusing on a gear, a descending bar graph, and a. Chart decrease icon illustrations Decline Analysis Magnifying Glass, Gear, and Downward Graph. A black and white line drawing depicts a magnifying glass focusing on a gear, a descending bar graph, and a.
Free with trial A digital illustration depicting a Bitcoin crash. A glowing Bitcoin symbol is shown breaking apart with a downward trending line graph overlaid on a dark, grid-like background. The image represents financial loss, market volatility, and the risks associated with cryptocurrency investments. Suitable for illustrating articles about economic downturns, crypto market analysis, and investment strategies. Chart decrease icon illustrations Bitcoin Crash: Market Downturn Concept. A digital illustration depicting a Bitcoin crash. A glowing Bitcoin symbol is shown breaking apart with a downward trending line graph overlaid on a dark, grid-like background. The image represents financial loss, market volatility, and the risks associated with cryptocurrency investments. Suitable for illustrating articles about economic downturns, crypto market analysis, and investment strategies.
Free with trial E-commerce Sales Decline Visualization , elegant style. Chart decrease icon illustrations E-commerce Sales Decline Visualization
Free with trial A diverse collection of downward-pointing arrows presented against a clean, light grey background. The arrows vary in style, including solid black, outlined, and shaded grey designs. This graphic element is ideal for representing direction, decline, progress, or a list of instructions. Its versatile design makes it suitable for web graphics, presentations, infographics, and print materials. Chart decrease icon vectors Collection of Downward Arrows in Various Styles. A diverse collection of downward-pointing arrows presented against a clean, light grey background. The arrows vary in style, including solid black, outlined, and shaded grey designs. This graphic element is ideal for representing direction, decline, progress, or a list of instructions. Its versatile design makes it suitable for web graphics, presentations, infographics, and print materials.
Free with trial Data analytics dashboard illustrating a mix of line graphs, bar charts, and data summaries, representing business growth, financial trends, and statistical insights for market analysis. Chart decrease icon vectors Data analytics dashboard showing business growth and decline. Data analytics dashboard illustrating a mix of line graphs, bar charts, and data summaries, representing business growth, financial trends, and statistical insights for market analysis
Free with trial Two simple arrows on a white background. The red arrow points diagonally downward to the left, while the green arrow points diagonally upward to the right. Both arrows have a clean design with bold lines and sharp arrowheads, indicating contrast or opposing directions. Chart decrease icon vectors Up and Down Growth Arrows - Stock Market Trend Vector Symbols. Two simple arrows on a white background. The red arrow points diagonally downward to the left, while the green arrow points diagonally upward to the right. Both arrows have a clean design with bold lines and sharp arrowheads, indicating contrast or opposing directions.
Free with trial A bold, red arrow with a zig-zag pattern points downwards, symbolizing a decline or negative trend. The arrow is rendered in a 3D style with subtle shading, giving it depth. It is isolated on a transparent background, making it versatile for various design applications. This graphic is ideal for representing financial losses, market downturns, declining performance, or any concept associated with a downward trajectory. Chart decrease icon illustrations Red Downward Trend Arrow. A bold, red arrow with a zig-zag pattern points downwards, symbolizing a decline or negative trend. The arrow is rendered in a 3D style with subtle shading, giving it depth. It is isolated on a transparent background, making it versatile for various design applications. This graphic is ideal for representing financial losses, market downturns, declining performance, or any concept associated with a downward trajectory.
Free with trial A bold, three-dimensional red arrow forms a jagged downward trend, symbolizing decline, loss, or negative performance. The arrow's sharp angles and bright red color convey urgency and a significant downturn. Isolated on a clean white background, this graphic is versatile for illustrating financial losses, market crashes, declining statistics, or any concept related to a negative trajectory. Its minimalist design makes it suitable for presentations, reports, and digital media. Chart decrease icon illustrations Red Downward Trend Arrow. A bold, three-dimensional red arrow forms a jagged downward trend, symbolizing decline, loss, or negative performance. The arrow's sharp angles and bright red color convey urgency and a significant downturn. Isolated on a clean white background, this graphic is versatile for illustrating financial losses, market crashes, declining statistics, or any concept related to a negative trajectory. Its minimalist design makes it suitable for presentations, reports, and digital media.
Free with trial Graph Declining with Arrow Line Art Minimalist Representation. Chart decrease icon vectors Graph Declining with Arrow Line Art Minimalist Representation
Free with trial Golden showing a shiny golden downward pointing arrow on a white background keywords: arrow, gold, golden, down, downward, direction, decline, decrease, falling, negative trend, loss, recession, stock market, finance, business, economy, chart, graph, symbol, icon, 3d, render, isolated, white background, metallic, shiny, polished, pointing, movement, strategy, progress, setback, negative, downturn. Chart decrease icon illustrations A Shiny Golden Downward Pointing Arrow on a White Background Keywords: arrow, gold, golden, down, downward, direction, decline
Free with trial A vibrant red arrow pointing directly downward, casting a subtle shadow on a clean white background, symbolizing direction, decline, or importance. Chart decrease icon illustrations Red Arrow Pointing Downward with Shadow on White Background. A vibrant red arrow pointing directly downward, casting a subtle shadow on a clean white background, symbolizing direction, decline, or importance
Free with trial Outline vector graphic depicting a decline in business performance. Chart decrease icon illustrations Declining Performance Gear, Man, Graph, Arrow. Business Downturn. Outline vector graphic depicting a decline in business performance.
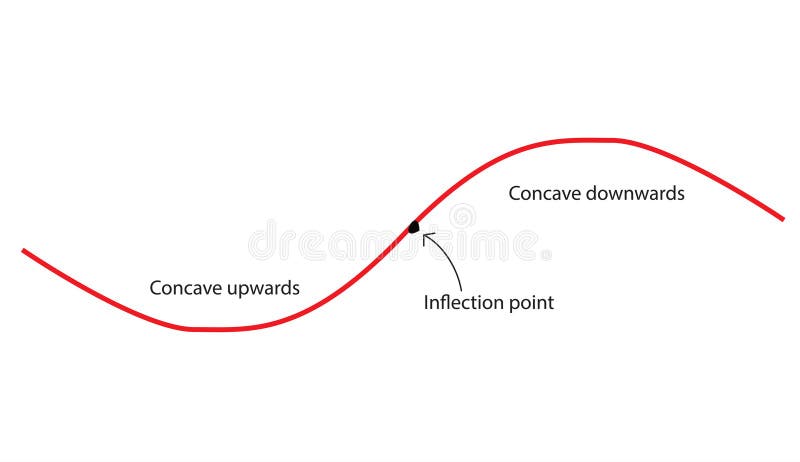
Free with trial Concavity of curve. Inflection point, concave down and concave up. Second derivative tangent lines of function. Chart decrease icon vectors Concavity of curve
Free with trial This comprehensive vector illustration features a set of 18 flat icons depicting various financial trends, market indicators, and warning signals. The collection includes rising and falling line graphs, bar charts, currency symbols (dollar and euro) indicating fluctuations, and alert symbols like sirens and exclamation marks. Ideal for illustrating concepts of economic growth, decline, market volatility, financial crisis, investment risks, and business performance. Perfect for presentations, reports, websites, and applications related to finance, economics, and stock markets. Chart decrease icon vectors Financial Trends, Market Indicators and Crisis Alert Icons Set. This comprehensive vector illustration features a set of 18 flat icons depicting various financial trends, market indicators, and warning signals. The collection includes rising and falling line graphs, bar charts, currency symbols (dollar and euro) indicating fluctuations, and alert symbols like sirens and exclamation marks. Ideal for illustrating concepts of economic growth, decline, market volatility, financial crisis, investment risks, and business performance. Perfect for presentations, reports, websites, and applications related to finance, economics, and stock markets.
Free with trial 3D yellow arrow graph descending sharply on a teal blue background, representing financial loss or negative trend. Chart decrease icon illustrations 3D yellow arrow graph descending sharply on a teal blue background, representing financial loss or negative trend
Free with trial A magnifying glass focuses on a downward trend graph and briefcase, symbolizing economic downturn analysis and market. Chart decrease icon illustrations Economic Downturn Analysis Magnifying Glass on Market Decline. A magnifying glass focuses on a downward trend graph and briefcase, symbolizing economic downturn analysis and market.
Free with trial 3D Isometric Flat Vector Illustration of Real Estate Investment Risks, Fluctuations In Housing Prices. Chart decrease icon vectors 3D Isometric Flat Vector Illustration of Real Estate Investment Risks
Free with trial A vibrant, hand-drawn doodle illustration centered around a large percentage sign. This creative sketch features various financial and business icons, including bar graphs, pie charts, stacks of coins, dollar signs, and arrows indicating growth and decline. The colorful, cartoonish style makes it perfect for illustrating concepts like interest rates, economic trends, business analytics, and financial reports. Ideal for use in presentations, infographics, websites, and educational materials, this vector art is isolated on a white background for versatile application. Chart decrease icon illustrations Finance and Economy Doodle Illustration. A vibrant, hand-drawn doodle illustration centered around a large percentage sign. This creative sketch features various financial and business icons, including bar graphs, pie charts, stacks of coins, dollar signs, and arrows indicating growth and decline. The colorful, cartoonish style makes it perfect for illustrating concepts like interest rates, economic trends, business analytics, and financial reports. Ideal for use in presentations, infographics, websites, and educational materials, this vector art is isolated on a white background for versatile application.
Free with trial A bold, glossy red arrow curves downwards, pointing sharply to the left. It signifies a downward trend or direction. Chart decrease icon illustrations Vibrant red downward curved arrow symbol. A bold, glossy red arrow curves downwards, pointing sharply to the left. It signifies a downward trend or direction
Free with trial Line graph with downward trend alongside sad face. Ideal for performance loss, business challenges, failure, analysis, recession, disappointment, frustration. Simple flat metaphor. Chart decrease icon vectors Declining Line Graph with Sad Face Representing Negative Trend and Disappointment. Line graph with downward trend alongside sad face. Ideal for performance loss, business challenges, failure, analysis, recession, disappointment, frustration. Simple flat metaphor
Free with trial Set line Mobile stock trading, Contract money and pen and Global economic crisis on seamless pattern. Vector. Chart decrease icon illustrations Set line Mobile stock trading, Contract money and pen and Global economic crisis on seamless pattern. Vector
Free with trial Arrow Direction and Percentage Icons for Business Growth Concept. Chart decrease icon illustrations Arrow Direction and Percentage Icons for Business Growth Concept
Free with trial Dollar Coins with Upward and Downward Arrows Representing Financial Growth and Decline in Minimalist Flat Style. Chart decrease icon vectors Dollar Coins with Upward and Downward Arrows Representing Financial Growth and Decline in Minimalist Flat Style
Free with trial Businessman with downward graph indicating financial decline, recession, and negative growth. Ideal for economic analysis, loss reporting, and business downturn visuals. Chart decrease icon vectors Business decline graph with downward arrow showing financial loss recession and negative growth concept. Businessman with downward graph indicating financial decline, recession, and negative growth. Ideal for economic analysis, loss reporting, and business downturn visuals
Free with trial Sophisticated financial dollar. Professional growth indicators. Economic statistics Vector. Professional currency exchanges. EPS 10. Chart decrease icon vectors Sophisticated financial dollar. Professional growth indicators. Economic statistics Vector. Professional currency exchanges
Free with trial This image features an abstract illustration of a bar graph against a dark gray background. The graph consists of three vertical bars of varying heights, each with horizontal rectangles inside. The bars are shades of white and gray, creating a minimalist and modern design. This image can be used to represent data, growth, statistics, or business performance in a visually appealing manner. Chart decrease icon vectors Abstract Bar Graph Illustration. This image features an abstract illustration of a bar graph against a dark gray background. The graph consists of three vertical bars of varying heights, each with horizontal rectangles inside. The bars are shades of white and gray, creating a minimalist and modern design. This image can be used to represent data, growth, statistics, or business performance in a visually appealing manner.
Free with trial This image features three bold, three-dimensional arrows pointing sharply downward, each rendered in distinct vibrant colors�'blue, yellow, and red�'symbolizing a significant market downturn, financial loss, or economic decline, set against a clean, minimalist white background that enhances their striking visual impact and conveys urgency and negative momentum in business, trading, or investment. Chart decrease icon illustrations Colorful downward trending financial arrows in blue yellow and red illustrating market decline and economic downturn concepts. This image features three bold, three-dimensional arrows pointing sharply downward, each rendered in distinct vibrant colors�'blue, yellow, and red�'symbolizing a significant market downturn, financial loss, or economic decline, set against a clean, minimalist white background that enhances their striking visual impact and conveys urgency and negative momentum in business, trading, or investment
Free with trial A thick, bright red arrow with a white outline, angled downwards and to the right, indicating direction or decline. Chart decrease icon vectors Bold red arrow pointing down and to the right. A thick, bright red arrow with a white outline, angled downwards and to the right, indicating direction or decline
Free with trial Two sets of simple flat design charts showing bar graphs with line graphs and three-segment pie charts in red, green, and blue. Chart decrease icon vectors Two bar charts with line graphs and two pie charts data visualization statistics. Two sets of simple flat design charts showing bar graphs with line graphs and three-segment pie charts in red, green, and blue
Free with trial Depreciation down graph fail bankruptcy diagram financial business crisis economy vector. Chart decrease icon vectors Depreciation down graph fail bankruptcy diagram financial business crisis economy
Free with trial This vector illustration set features six distinct icons representing key financial and economic concepts. It includes bar charts depicting growth with a green arrow and decline with a red arrow, alongside currency exchange rate indicators for USD, INR, and EUR. Two donut charts visualize data distribution, while a world map colored green and red signifies global market trends or segmentation. Ideal for business presentations, financial reports, economic analysis, and investment-related content, these versatile graphics convey complex data clearly and concisely. Chart decrease icon vectors Financial Growth, Decline, and Global Market Data Visualization Icons Set. This vector illustration set features six distinct icons representing key financial and economic concepts. It includes bar charts depicting growth with a green arrow and decline with a red arrow, alongside currency exchange rate indicators for USD, INR, and EUR. Two donut charts visualize data distribution, while a world map colored green and red signifies global market trends or segmentation. Ideal for business presentations, financial reports, economic analysis, and investment-related content, these versatile graphics convey complex data clearly and concisely.
Free with trial Several dark, pointed arrow shapes are patterned diagonally across a light background. The arrows point downwards, suggesting a trend or direction. Chart decrease icon illustrations Downward Trend Shown With Repeating Arrow Shapes on a Plain Background. Several dark, pointed arrow shapes are patterned diagonally across a light background. The arrows point downwards, suggesting a trend or direction.
Free with trial Inflation sign. Sack pictogram with dollar sign and arrow down. Symbol of money depreciation vector linear illustration. Chart decrease icon vectors Inflation sign. Sack pictogram with dollar sign and arrow down. Symbol of money depreciation vector linear illustration.
Free with trial A comprehensive collection of cartoon-style vector icons illustrating key financial and economic concepts. This set includes symbols for market decline, payment processing, bull and bear market dynamics, investment analysis, global currencies, financial balance, and rising interest rates. Ideal for use in business presentations, financial reports, banking websites, educational materials, or any project related to economics and investment. Chart decrease icon vectors Financial and Economic Icons Set. A comprehensive collection of cartoon-style vector icons illustrating key financial and economic concepts. This set includes symbols for market decline, payment processing, bull and bear market dynamics, investment analysis, global currencies, financial balance, and rising interest rates. Ideal for use in business presentations, financial reports, banking websites, educational materials, or any project related to economics and investment.
Free with trial Team Collaboration on Real Estate Strategy with Finance Charts and House Icon, Representing Property Investment Opportunities and Market Analysis Sigmoid. Chart decrease icon illustrations Professional team working together on real estate strategies with finance insights and graphics, focusing on investment. Team Collaboration on Real Estate Strategy with Finance Charts and House Icon, Representing Property Investment Opportunities and Market Analysis Sigmoid
Free with trial Business graph with up arrow down arrow logo template. Chart decrease icon vectors Business graph with up arrow down arrow logo template
Free with trial Stock market. The rise and fall of securities. Successful trading. Market trend up green and red down arrows, financial graphs. Business investment growth and loss arrow. Graph going up and down symbol vector illustration. Chart decrease icon vectors Stock market. The rise and fall of securities. Successful trading. Market trend up green and red down arrows, financial graphs.