Free with trial Competition market share loss business concept as a red boxing glove shaped as a financial pie chart diagram as a symbol for losing economic competitiveness. Chart financial growth decrease illustrations Competition Market Share
Free with trial Falling financial indicators, business profits, investment fund, investments, reduction of monetary savings, budget planning, income fall concept. Illustration in paper cut art style. Chart financial growth decrease vectors Falling financial indicators. Illustration in paper cut art style. Falling financial indicators, business profits, investment fund, investments, reduction of monetary savings, budget planning, income fall concept. Illustration in paper cut art style.
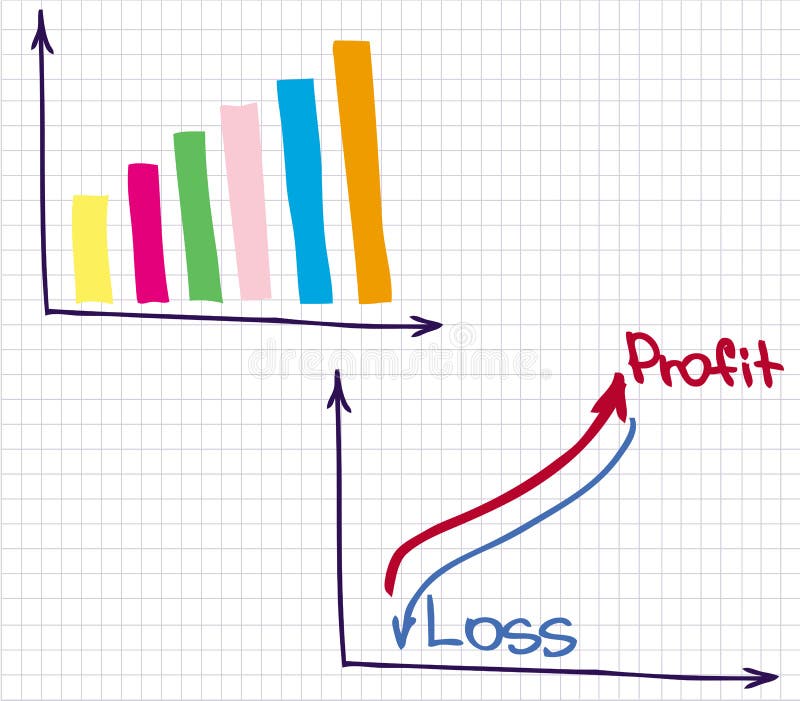
Free with trial A bar chart in metallic style over white. Chart financial growth decrease illustrations Bar Chart metallic. A bar chart in metallic style over white
Free with trial Winner, Uv protection and Financial diagram line icons set. Timeline process infograph. Loan percent sign. Best results, Skin cream, Candlestick chart. Decrease rate. Business set. Vector. Chart financial growth decrease vectors Winner, Uv protection and Financial diagram icons set. Loan percent sign. Vector. Winner, Uv protection and Financial diagram line icons set. Timeline process infograph. Loan percent sign. Best results, Skin cream, Candlestick chart. Decrease rate. Business set. Vector
Free with trial Vector image charts and diagrams for presentation or financial report. Infographics concept. Increase and decrease of indicators in graphic diagram. Colorful vector illustration. Chart financial growth decrease vectors Vector image charts and diagrams for presentation or financial report. Infographics concept.Increase and decrease of
Free with trial 3d model of financial graph with red backlight on blue background, stock market financing chart, economic boom and bust, investment bankruptcy and inflation, global rising and falling economy. 3D rendering. Chart financial growth decrease illustrations 3d model of financial graph with red backlight on blue background, stock market financing chart, economic boom and bust
Free with trial Simple chart on a black background representin increase, success and decrease. Chart financial growth decrease illustrations Simple chart
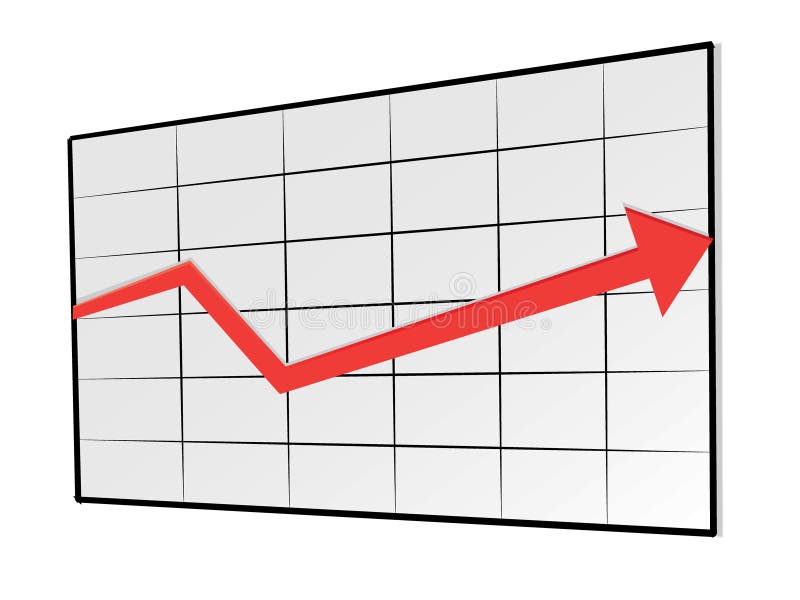
Free with trial 3d image of lcd on wall showing decrease financial stat. Chart financial growth decrease illustrations Financial stat decrease. 3d image of lcd on wall showing decrease financial stat
Free with trial Freehand drawing of businesswoman atop height in a growth chart facing an economic reset with value losses. Business metaphor for recession, investment, entrepreneurship, risk, decrease, crisis. Chart financial growth decrease illustrations Drawn Business Woman Facing Economic Crash. Freehand drawing of businesswoman atop height in a growth chart facing an economic reset with value losses. Business metaphor for recession, investment, entrepreneurship, risk, decrease, crisis
Free with trial Negative interest rates in investment financial recession. Crisis monetary policy number below zero growth vector. Chart financial growth decrease vectors Negative interest rates in investment financial recession. Crisis monetary policy number below zero growth
Free with trial Stagflation, economic slow down or recession while inflation high up, GDP growth decrease causing by unemployment concept, fearful businessman riding fall down economic graph with inflation high up. Chart financial growth decrease vectors Stagflation, economic slow down or recession while inflation high up, GDP growth decrease causing by unemployment concept, fearful
Free with trial Financial downturn, arrow recession economy, finance crisis, business down, loss, stock, design, flat style vector illustration. Economic slump, depression decline success, low growth company. Chart financial growth decrease vectors Financial downturn, arrow recession economy, finance crisis, business down, loss, stock, design, flat style vector
Free with trial Bar chart or bar graph decreasing vector icon with drop down arrow. Statistical data of stock, financial in business to loss, negative, decline or crisis. Graphic for report, presentation. 48x48 px. n. Chart financial growth decrease vectors Bar chart or bar graph decreasing vector icon with drop down arrow. 48x48 pixel perfect and editable stroke. Bar chart or bar graph decreasing vector icon with drop down arrow. Statistical data of stock, financial in business to loss, negative, decline or crisis. Graphic for report, presentation. 48x48 px.n
Free with trial Bar chart or bar graph decreasing vector icon with drop down arrow. Statistical data of stock, financial in business to loss, negative, decline or crisis. Graphic for report, presentation. 48x48 px. n. Chart financial growth decrease illustrations Bar chart or bar graph decreasing vector icon with drop down arrow. 48x48 pixel perfect and editable stroke. Bar chart or bar graph decreasing vector icon with drop down arrow. Statistical data of stock, financial in business to loss, negative, decline or crisis. Graphic for report, presentation. 48x48 px.n
Free with trial Bar chart or bar graph decreasing vector icon with drop down arrow. Statistical data of stock, financial in business to loss, negative, decline or crisis. Graphic for report, presentation. 48x48 px. n. Chart financial growth decrease vectors Bar chart or bar graph decreasing vector icon with drop down arrow. 48x48 pixel perfect and editable stroke. Bar chart or bar graph decreasing vector icon with drop down arrow. Statistical data of stock, financial in business to loss, negative, decline or crisis. Graphic for report, presentation. 48x48 px.n
Free with trial Credit card, Graph and Report document icons simple set. 3d chart sign. Loan percent, Presentation diagram, Growth chart. Presentation column. Finance set. Speech bubble credit card icon. Vector. Chart financial growth decrease vectors Credit card, Graph and Report document icons set. 3d chart sign. Vector. Credit card, Graph and Report document icons simple set. 3d chart sign. Loan percent, Presentation diagram, Growth chart. Presentation column. Finance set. Speech bubble credit card icon. Vector
Free with trial Stock market investment trading technical analysis candlestick, bar, line and area chart set on white background. Business candle stick graph exchange trends. Trader financial investment index. Vector. Chart financial growth decrease vectors Stock market investment trading technical analysis candlestick, bar, line and area chart set on white background
Free with trial A businessman holds banknotes, runs away from stack of money bar chart with red graph down. Withdraw capital in business recession, economic strategy, financial, market performance, loss management. Chart financial growth decrease vectors A businessman holds banknotes, runs away from stack of money bar chart with red graph down. Withdraw capital in business recession
Free with trial Green bar graph with red arrow depicting downward trend of data symbolizing financial loss. Chart financial growth decrease vectors Financial Loss
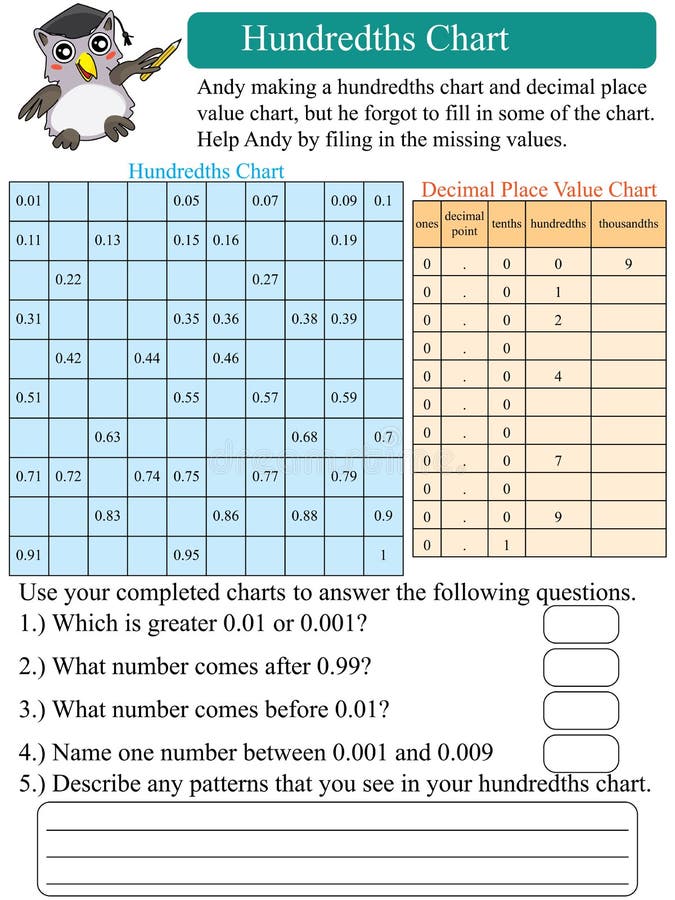
Free with trial Illustration design mathematics hundredths chart question. Chart financial growth decrease vectors Mathematics hundredths chart
Free with trial Three dimensional orange chart isolated on white background. Chart financial growth decrease vectors Three dimensional orange chart
Free with trial 3D Illustration of business chart up and down. Chart financial growth decrease illustrations Chart up and down
Free with trial Positive business sales chart icon background. Chart financial growth decrease vectors Positive business sales chart
Free with trial A pie chart in metallic style over white. Chart financial growth decrease illustrations Pie chart metallic. A pie chart in metallic style over white
Free with trial Positive projection chart vector illustration. Chart financial growth decrease vectors Projection chart vector illustration
Free with trial Increase decrease graphs, stats report. Chart financial growth decrease illustrations Increase decrease graphs
Free with trial Upward business sales chart background. Chart financial growth decrease vectors Upward business sales chart
Free with trial Positive business sales chart on wood background with magnify glass. layered. Chart financial growth decrease vectors Positive business sales chart
Free with trial Colorful business chart vector illustration. Chart financial growth decrease vectors Chart illustration. Colorful business chart vector illustration
Free with trial Business sales chart background. Chart financial growth decrease vectors Business sales chart
Free with trial Infographic and chart icon set 3, vector eps10. Chart financial growth decrease vectors Infographic and chart icon set 3, vector eps10
Free with trial 3d colorful bar chart with arrow, vector illustration. Chart financial growth decrease vectors 3d colorful bar chart with arrow
Free with trial Line chart with points. Positive and negative index. Business concept. Chart financial growth decrease vectors Line chart with points. Positive and negative index. Business concept
Free with trial 3D render of bar graph representing economic growth with sudden crash. Chart financial growth decrease illustrations Economic growth with sudden crash bar graph. 3D render of bar graph representing economic growth with sudden crash
Free with trial Financial crisis symbol depression business. Color vector illustration EPS10. Chart financial growth decrease vectors Financial crisis symbol depression business
Free with trial Declining business arrow on diagram of growth, downward green arrow. vector graph icon. eps10. Chart financial growth decrease illustrations Declining business arrow on diagram of growth, downward green arrow. vector graph icon. eps10
Free with trial Set chart graph icon positive, negative infographic, layered. Chart financial growth decrease vectors Set chart graph positive, negative infographic. Set chart graph icon positive, negative infographic, layered.
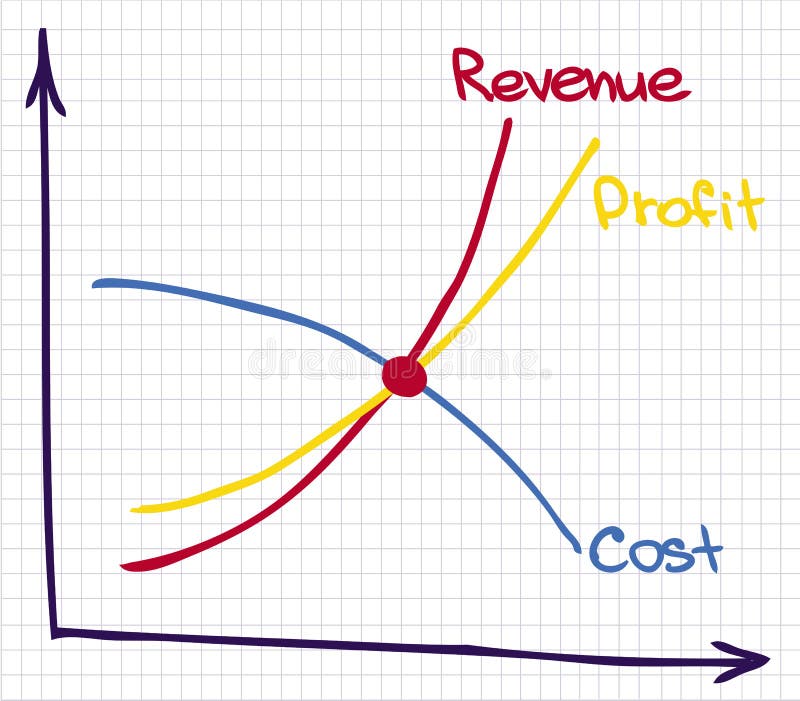
Free with trial Financial chart of revenue and loss. Chart financial growth decrease vectors Profit Revenue Chart. Financial chart of revenue and loss
Free with trial Financial chart of revenue and loss. Chart financial growth decrease vectors Profit Revenue Chart. Financial chart of revenue and loss
Free with trial 3D Illustration of business chart up and down. Chart financial growth decrease illustrations Chart up and down
Free with trial Economic forecast with financial stock value prediction tiny person concept. Business analysis as falling roller coaster up and down vector illustration. Money crisis and global decrease recession. Chart financial growth decrease vectors Economic forecast with financial stock value prediction tiny person concept
Free with trial Financial chart of revenue and loss. Chart financial growth decrease vectors Profit Revenue Cost Chart. Financial chart of revenue and loss
Free with trial Candlestick downtrend stock price graph vector, financial analysing tool dark background. Chart financial growth decrease vectors Candlestick downtrend stock price graph vector, financial analysing tool
Free with trial Chart of development and decrease of the activity in work of the company or market (red and green schedules). Chart financial growth decrease illustrations Green schedule of growth and red - falling. Chart of development and decrease of the activity in work of the company or market (red and green schedules)
Free with trial Infographic template with 3 arrows pointing down. Can be used for diagram, graph, chart, report, web design. Vector illustration. Chart financial growth decrease vectors Infographic template with 3 arrows pointing down. Can be used for diagram, graph, chart, report, web design.
Free with trial Financial chart of revenue and loss. Chart financial growth decrease vectors Profit Revenue Chart. Financial chart of revenue and loss
Free with trial Forex market research conceptual icon. Forex chart vector design. Forex candlestick and magnifier illustration. Chart financial growth decrease vectors Forex market research conceptual icon. Forex chart vector design
Free with trial Coronabond coronavirus cells covid-19 influenza with color of europe euro, concept of corona bond crisis for economy finance business europe for pandemic health risk recession on blue financial economy chart background. Chart financial growth decrease illustrations Coronabond coronavirus cells covid-19 influenza with color of europe euro, concept of corona bond crisis for economy finance
Free with trial Stock Market - Falling stock prices drop down from Global economic and financial crisis red color tone. Chart financial growth decrease illustrations Stock Market - Falling stock prices drop down from Global economic and financial crisis. Stock Market - Falling stock prices drop down from Global economic and financial crisis red color tone
Free with trial Isometric Business on falling down the chart. Fail, Risk, Problem. Decline red arrow with businessman isolated on white background. Chart financial growth decrease vectors Isometric Business on falling down the chart. Fail, Risk, Problem. Decline red arrow with businessman isolated on white
Free with trial Bankrupt concept. People trying to keep downward financial trend arrow economic risk crisis, money lost business vector. Financial arrow increase, turnover orientation way after downward illustration. Chart financial growth decrease vectors Bankrupt concept. People trying to keep downward financial trend arrow economic risk and crisis, money lost business. Bankrupt concept. People trying to keep downward financial trend arrow economic risk crisis, money lost business vector. Financial arrow increase, turnover orientation way after downward illustration
Free with trial Modern vector illustration of world financial crisis. Oil price drop. ollapse of the economy. Bankruptcy. Down arrow stocks graph. Helping in financial crisis. Stock Market - Arrow Graph Going Down. Chart financial growth decrease vectors Modern vector illustration of world financial crisis. Oil price drop. ollapse of the economy. Bankruptcy. Down arrow. Modern vector illustration of world financial crisis. Oil price drop. ollapse of the economy. Bankruptcy. Down arrow stocks graph. Helping in financial crisis. Stock Market - Arrow Graph Going Down
Free with trial Money increase and decrease icons. Low or high total cost icon. Price, sale, rate or profit going up or down symbol with arrow and dollar sign. Chart financial growth decrease illustrations Money increase and decrease icons. Low or high total cost icon. Price, sale, rate or profit going up or down symbol. With arrow and dollar sign
Free with trial Money increase and decrease icons. Low or high total cost icon. Price, sale, rate or profit going up or down symbol with arrow and dollar sign. Chart financial growth decrease illustrations Money increase and decrease icons. Low or high total cost icon. Price, sale, rate or profit going up or down symbol
Free with trial Timeline chart infographic template elements. Flat vector illustration of business development steps. Isolated infographics arrow symbols for web, internet, print, presentations, social networks. Chart financial growth decrease vectors Timeline infographic vector template elements. Business development steps arrows chart. Timeline chart infographic template elements. Flat vector illustration of business development steps. Isolated infographics arrow symbols for web, internet, print, presentations, social networks.
Free with trial 3D decreasing red arrow on the chart. Chart financial growth decrease illustrations Decreasing red arrow on the chart
Free with trial Stocks fall. Candle stick graph chart of stock market investment trading. Bullish point, down trend of graph. Futuristic red signal trend drop down arrow chart. Chart financial growth decrease vectors Stocks fall. Candle stick graph chart of stock market investment trading. Bullish point, down trend of graph. Futuristic red. Stocks fall. Candle stick graph chart of stock market investment trading. Bullish point, down trend of graph. Futuristic red signal trend drop down arrow chart
Free with trial Global economic slowdown, world GDP growth decline or sluggish, recession or growth slowing down concept, businessman pushing slow snail with the earth on GDP growing arrow metaphor of world economy. Chart financial growth decrease vectors Global economic slowdown, world GDP growth decline or sluggish, recession or growth slowing down concept, businessman pushing slow
Free with trial Increasing piles of coins with going up graph. Concept for financial growth. illustration. Chart financial growth decrease vectors Increasing piles of coins with going up graph.
Free with trial Continuous one line drawing of up and down arrows. Minimalist vector illustration of business growth graph symbol. Single line art icon representing increase and decrease trends. Chart financial growth decrease vectors Continuous one line drawing of up and down arrows. Minimalist vector illustration of business growth graph symbol. Single line art
Free with trial Percent arrow down and up icon on circle line. Percentage decline and growth sign symbol vector. Chart financial growth decrease vectors Percent arrow down and up icon on circle line. Percentage decline and growth sign symbol
Free with trial Battery lithium energy storage price goes down drop decrease cheap in global commodity market trade export transaction vector. Chart financial growth decrease vectors Battery lithium energy storage price goes down drop decrease cheap in global commodity market trade export transaction
Free with trial Red and green arrows Stock exchange market analysis / Stock crisis red price chart fall and green arrow up profits growth / Stock or forex business and finance money - economic inflation and deflation. Chart financial growth decrease illustrations Red and green arrows Stock exchange market analysis / Stock crisis red price
Free with trial Money increase and decrease icons. Low or high total cost icon. Price, sale, rate or profit going up or down symbol with arrow and dollar sign. Vector illustration. Chart financial growth decrease vectors Money increase and decrease icons. Low or high total cost icon. Price, sale, rate or profit going up or down symbol
Free with trial Money increase and decrease icons. Low or high total cost icon. Price, sale, rate or profit going up or down symbol with arrow and dollar sign. Vector illustration. Chart financial growth decrease vectors Money increase and decrease icons. Low or high total cost icon. Price, sale, rate or profit going up or down symbol
Free with trial Money increase and decrease icons. Low or high total cost icon. Price, sale, rate or profit going up or down symbol with arrow and dollar sign. Vector illustration. Chart financial growth decrease vectors Money increase and decrease icons. Low or high total cost icon. Price, sale, rate or profit going up or down symbol
Free with trial Stock crisis red price drop down chart fall / Stock market exchange analysis or forex graph business and finance crash money losing moving economic investment loss. Chart financial growth decrease illustrations Stock crisis red price drop down chart fall
Free with trial Abstract blue gowing down chart. Low poly style design. Abstract geometric background. Wireframe light connection structure. Modern 3d graphic concept. Isolated vector illustration. Chart financial growth decrease vectors Low poly abstract blue gowing down chart. Abstract blue gowing down chart. Low poly style design. Abstract geometric background. Wireframe light connection structure. Modern 3d graphic concept. Isolated vector illustration.
Free with trial Germany Stock Exchange market crisis red market price down chart fall / Stock analysis or forex charts graph Business and finance money crisis red negative drop in sales economic fall. Chart financial growth decrease illustrations Germany Stock Exchange market crisis red market price down chart fall Business and finance money crisis red negative drop in sales. Germany Stock Exchange market crisis red market price down chart fall / Stock analysis or forex charts graph Business and finance money crisis red negative drop in sales economic fall
Free with trial Increasing piles of coins with going up graph. Concept for financial growth. illustration. Chart financial growth decrease vectors Increasing piles of coins with going up graph.
Free with trial Illustration of Global Financial Crisis, Currencies Falling Down Financial Recession. Chart financial growth decrease vectors Global Financial Crisis Illustration, Currencies Falling Down. Illustration of Global Financial Crisis, Currencies Falling Down Financial Recession
Free with trial India business economy growth country with map and finance condition - vector illustration. Chart financial growth decrease illustrations India business economy growth country with map and finance condition - vector illustration
Free with trial Philippine business economy growth country with map and finance condition - vector illustration. Chart financial growth decrease illustrations Philippine business economy growth country with map and finance condition - vector illustration
Free with trial Crisis finance graph chart icon. Outline crisis finance graph chart vector icon for web design isolated on white background. Chart financial growth decrease vectors Crisis finance graph chart icon, outline style. Crisis finance graph chart icon. Outline crisis finance graph chart vector icon for web design isolated on white background
Free with trial UK. London Stock Exchange market crisis red market price down chart fall / Stock analysis or forex charts graph Business and finance money crisis background red negative drop in sales economic fall. Chart financial growth decrease illustrations UK. London Stock Exchange market crisis red market price down chart fall Business and finance money crisis background red negative. UK. London Stock Exchange market crisis red market price down chart fall / Stock analysis or forex charts graph Business and finance money crisis background red negative drop in sales economic fall
Free with trial Decline chart icon isolated on dark background. Simple vector logo. Chart financial growth decrease vectors Decline chart icon isolated on dark background
Free with trial The growth and decline concept with businessmen. Chart financial growth decrease illustrations The growth and decline concept with businessmen
Free with trial Growth graph, business decline graph or diagram with arrow up, down icon design black symbol isolated on white background. Vector EPS 10. Chart financial growth decrease vectors Growth graph, business decline graph or diagram with arrow up, down icon design black symbol isolated on white background. Vector
Free with trial Malaysia business economy growth country with map and finance condition - vector illustration. Chart financial growth decrease illustrations Malaysia business economy growth country with map and finance condition - vector illustration
Free with trial Thick textbook on economics in hardcover with bookmark inside and colorful statistical chart isolated vector illustration on white background. Chart financial growth decrease vectors Textbook on Economics and Bright Statistical Chart. Thick textbook on economics in hardcover with bookmark inside and colorful statistical chart isolated vector illustration on white background.