Free with trial Colorful Financial growth decrease icon isolated on white background. Increasing revenue. Minimalism concept. 3D render illustration. Chart financial growth decrease illustrations Colorful Financial growth decrease icon isolated on white background. Increasing revenue. Minimalism concept. 3D render
Free with trial White line Financial growth decrease icon isolated seamless pattern on red background. Increasing revenue. Vector. Chart financial growth decrease vectors White line Financial growth decrease icon isolated seamless pattern on red background. Increasing revenue. Vector
Free with trial Filled outline Financial growth decrease icon isolated on white background. Increasing revenue. Vector. Chart financial growth decrease vectors Filled outline Financial growth decrease icon isolated on white background. Increasing revenue. Vector
Free with trial This vibrant illustration depicts financial growth, showcasing a dramatic upward trend after an initial decline. The 3D bar chart and upward arrow, generated by AI, symbolize overcoming challenges and achieving significant financial success. The gold coin further emphasizes the positive outcome. Chart financial growth decrease illustrations AI-Generated Financial Growth Chart. This vibrant illustration depicts financial growth, showcasing a dramatic upward trend after an initial decline. The 3D bar chart and upward arrow, generated by AI, symbolize overcoming challenges and achieving significant financial success. The gold coin further emphasizes the positive outcome.
Free with trial Chart showcasing progress. The last bar stands out as a green arrow, symbolising positive growth. Accompanied by cash, it's a powerful representation of financial success. Chart financial growth decrease vectors Financial Growth Chart with Positive Momentum. Chart showcasing progress. The last bar stands out as a green arrow, symbolising positive growth. Accompanied by cash, it's a powerful representation of financial success...
Free with trial Line Financial growth decrease icon isolated on white background. Increasing revenue. Colorful outline concept. Vector. Chart financial growth decrease vectors Line Financial growth decrease icon isolated on white background. Increasing revenue. Colorful outline concept. Vector
Free with trial Isometric Financial growth decrease icon isolated on orange and red background. Increasing revenue. Circle button. Vector. Chart financial growth decrease vectors Isometric Financial growth decrease icon isolated on orange and red background. Increasing revenue. Circle button
Free with trial This abstract 3D rendered image showcases three prominent white candlestick-like objects, symbolizing financial growth and market trends. Positioned against a dark, gridded background, a subtle financial chart with smaller red and white candlesticks and wicks extends into the distance, reinforcing the theme of data analysis and investment. The clean, modern aesthetic makes it ideal for illustrating concepts related to stock market performance, cryptocurrency trading, economic growth, financial planning, and digital business strategies. It effectively conveys ideas of progress, success, and the dynamic nature of global markets. Chart financial growth decrease illustrations 3D Financial Candlestick Chart Representing Market Growth. This abstract 3D rendered image showcases three prominent white candlestick-like objects, symbolizing financial growth and market trends. Positioned against a dark, gridded background, a subtle financial chart with smaller red and white candlesticks and wicks extends into the distance, reinforcing the theme of data analysis and investment. The clean, modern aesthetic makes it ideal for illustrating concepts related to stock market performance, cryptocurrency trading, economic growth, financial planning, and digital business strategies. It effectively conveys ideas of progress, success, and the dynamic nature of global markets.
Free with trial A vibrant, modern icon depicting a financial growth chart, representing investment and market analysis. The design features ascending lines and bars, suggesting positive trends. This graphic was generated by AI for illustrative purposes. A representation of financial success. Chart financial growth decrease illustrations Financial Growth Chart Icon - Business Investment Concept. A vibrant, modern icon depicting a financial growth chart, representing investment and market analysis. The design features ascending lines and bars, suggesting positive trends. This graphic was generated by AI for illustrative purposes. A representation of financial success.
Free with trial Concept Abstract Art, Blue Watercolor, Financial Growth, Chart, Abstract Design Abstract Blue Watercolor Financial Growth Chart. Chart financial growth decrease illustrations Abstract Blue Watercolor Financial Growth Chart. Concept Abstract Art, Blue Watercolor, Financial. Concept Abstract Art, Blue Watercolor, Financial Growth, Chart, Abstract Design Abstract Blue Watercolor Financial Growth Chart
Free with trial 3D colorful bar chart, pie chart, rising arrow, dollar sign, and stacks of coins illustrate financial growth and success. Perfect for business, finance, and investment presentations. Chart financial growth decrease illustrations Financial Growth Chart with Dollar Sign and Coin Stacks. 3D colorful bar chart, pie chart, rising arrow, dollar sign, and stacks of coins illustrate financial growth and success. Perfect for business, finance, and investment presentations.
Free with trial Illustration of financial growth and decrease icons. The transparent background is valuable for designers. Chart financial growth decrease vectors Financial Growth and Decrease Icons on Transparent Background. Illustration of financial growth and decrease icons. The transparent background is valuable for designers
Free with trial Financial bar chart icon with up and down arrow. Economic growth and decline symbol in black circle. Chart financial growth decrease vectors Financial bar chart with up and down arrow. Economic growth and decline symbol in black circle
Free with trial A clear flat vector icon representing a bar chart with a downward-pointing red arrow, symbolizing decline, loss, or negative growth. This design is useful for financial reports, risk analysis, or any situation indicating a decrease in performance or value. It communicates challenges, vector design Generative AI. Chart financial growth decrease vectors Bar Chart Downtrend Icon, Decline, Loss, Negative Growth, Business, vector design Generative AI. A clear flat vector icon representing a bar chart with a downward-pointing red arrow, symbolizing decline, loss, or negative growth. This design is useful for financial reports, risk analysis, or any situation indicating a decrease in performance or value. It communicates challenges, vector design Generative AI
Free with trial Growth and decline graph report icon. Financial chart arrow up and down sign symbol illustration. Chart financial growth decrease vectors Growth and decline graph report icon. Financial chart arrow up and down sign symbol
Free with trial This 3D rendering showcases a vibrant bar graph and pie chart, ideal for visualizing business growth, financial reports, and data analysis. The colorful design makes it visually engaging and easy to understand. Chart financial growth decrease illustrations Colorful 3D Bar and Pie Chart Illustrating Business Growth and Financial Data. This 3D rendering showcases a vibrant bar graph and pie chart, ideal for visualizing business growth, financial reports, and data analysis. The colorful design makes it visually engaging and easy to understand.
Free with trial Line chart illustrating an upward trend, featuring candlestick patterns and glowing dots against a dark background. The arrangement indicates a positive movement in data, reflecting investment and financial growth. Blue and orange tones highlight data points and lines, providing a visual contrast that enhances readability. The abstract style conveys a modern financial theme, emphasizing success and progress in stock markets. Chart financial growth decrease illustrations Dynamic stock market chart showing upward trend for investment and financial growth success concept. Line chart illustrating an upward trend, featuring candlestick patterns and glowing dots against a dark background. The arrangement indicates a positive movement in data, reflecting investment and financial growth. Blue and orange tones highlight data points and lines, providing a visual contrast that enhances readability. The abstract style conveys a modern financial theme, emphasizing success and progress in stock markets.
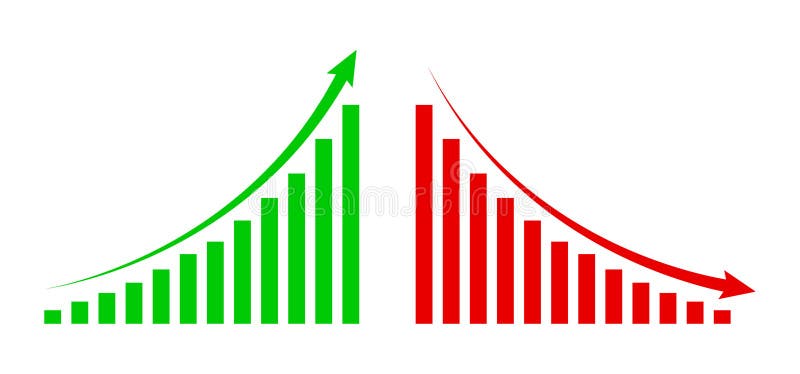
Free with trial Financial arrows up and down. Vector graph with green and red arrows. Chart with increase, decrease. Vector 10 EPS. Chart financial growth decrease vectors Financial arrows up and down. Vector graph with green and red arrows. Chart with increase, decrease.
Free with trial Graph going up and down sign financial arrows. chart increase, decrease sign with green and red arrows. vector graph with green and red arrows. Chart financial growth decrease vectors Graph going up and down sign financial arrows. chart increase, decrease sign with green and red arrows. vector graph
Free with trial Statistic graph progress, financial profit growth, increase and decrease line icons set. Infographic charts with arrow, circles and bars thin black and red outline symbols vector illustration. Chart financial growth decrease vectors Statistic graph progress, financial profit growth, increase and decrease line icons set
Free with trial Candlestick chart on a dark blue background illustrating stock market trends. Light blue and white candlesticks represent price fluctuations, with wicks indicating high and low values. The chart shows an upward trend, suggesting potential financial growth or investment opportunities. Candlestick charts are commonly used in financial analysis to depict market movements, assisting in forecasting stock behaviors for strategic decision-making. Chart financial growth decrease illustrations Rising stock market analysis chart for smart investment decisions and financial growth in modern business. Candlestick chart on a dark blue background. Candlestick chart on a dark blue background illustrating stock market trends. Light blue and white candlesticks represent price fluctuations, with wicks indicating high and low values. The chart shows an upward trend, suggesting potential financial growth or investment opportunities. Candlestick charts are commonly used in financial analysis to depict market movements, assisting in forecasting stock behaviors for strategic decision-making.
Free with trial Set Isometric Financial growth decrease and Cloud and shield icon. Vector. Chart financial growth decrease illustrations Set Isometric Financial growth, decrease and Cloud and shield icon. Vector
Free with trial This 3D rendering showcases a vibrant bar chart illustrating business growth and financial performance. The colorful cylinders represent data points, rising to show increasing success. A line graph adds additional information about trends over time. Chart financial growth decrease illustrations Colorful 3D Bar Chart with Growth Graph Showing Business Success and Financial Data. This 3D rendering showcases a vibrant bar chart illustrating business growth and financial performance. The colorful cylinders represent data points, rising to show increasing success. A line graph adds additional information about trends over time.
Free with trial Set line Financial growth decrease, increase, Diamond and Wallet with money icon. Vector. Chart financial growth decrease illustrations Set line Financial growth decrease, increase, Diamond and Wallet with money icon. Vector
Free with trial Financial chart arrow up and down icon illustration. Growth and decline graph symbol on black circle. Chart financial growth decrease vectors Financial chart arrow up and down icon. Growth and decline graph symbol on black circle
Free with trial A 3D illustration depicting financial growth. A line graph with blue and red data points ascends across a light blue background. Interspersed are green and red candlestick bars, representing market fluctuations. Stacks of gold coins and individual coins with dollar signs are arranged at the base of the chart, symbolizing wealth and investment. Chart financial growth decrease illustrations 3D Financial Growth Chart with Stacks of Gold Coins and Candlestick Bars finance graph. A 3D illustration depicting financial growth. A line graph with blue and red data points ascends across a light blue background. Interspersed are green and red candlestick bars, representing market fluctuations. Stacks of gold coins and individual coins with dollar signs are arranged at the base of the chart, symbolizing wealth and investment
Free with trial Set line Financial growth decrease, Casino signboard, increase and Dart arrow icon. Vector. Chart financial growth decrease vectors Set line Financial growth decrease, Casino signboard, increase and Dart arrow icon. Vector
Free with trial Business growth and decline icon set. Up and down trend chart symbol illustration. Increase and decrease bar graph concept. Chart financial growth decrease vectors Business growth and decline icon set. Up and down trend chart symbol. Increase and decrease bar graph concept
Free with trial Set Isometric line Financial growth decrease, Coal mine trolley, and Data analysis icon. Vector. Chart financial growth decrease vectors Set Isometric line Financial growth decrease, Coal mine trolley, and Data analysis icon. Vector
Free with trial Description: A vibrant 3D rendering showcasing a bar chart with orange, blue, and yellow bars, representing upward financial trends or business growth. Ideal for presentations and reports. Chart financial growth decrease illustrations Colorful 3D Bar Chart: Business Growth and Financial Success. Description: A vibrant 3D rendering showcasing a bar chart with orange, blue, and yellow bars, representing upward financial trends or business growth. Ideal for presentations and reports.
Free with trial Hand interacting with blue chart, analyzing growth, trends, and financial performance data ,Generative ai. Chart financial growth decrease illustrations Hand analyzing blue chart, deciphering growth trends and financial performance for business success. Hand interacting with blue chart, analyzing growth, trends, and financial performance data ,Generative ai
Free with trial Set Isometric Financial growth decrease Coal mine trolley and Data analysis icon. Vector. Chart financial growth decrease vectors Set Isometric Financial growth decrease, Coal mine trolley and Data analysis icon. Vector
Free with trial Set line Financial growth decrease, Binary code and icon. Vector. Chart financial growth decrease illustrations Set line Financial growth decrease, Binary code and icon. Vector
Free with trial Green Financial growth decrease icon isolated on green background. Increasing revenue. Long shadow style. Vector. Chart financial growth decrease vectors Green Financial growth decrease icon isolated on green background. Increasing revenue. Long shadow style. Vector
Free with trial Set line Graph chart infographic Server Data Browser window Financial growth decrease Laptop with browser Cloud technology data transfer and Secure your site HTTPS SSL icon. Vector. Chart financial growth decrease illustrations Set line Graph chart infographic, Server, Data, Browser window, Financial growth decrease, Laptop with browser, Cloud. Set line Graph chart infographic Server Data Browser window Financial growth decrease Laptop with browser Cloud technology data transfer and Secure your site HTTPS SSL icon. Vector.
Free with trial Bar Chart Growth And Decline Line And Solid Icon Set. Financial Performance, Economic Trends, Business Analysis Symbol Collection. Data Visualization And Market Trends. Isolated Vector Illustration. Chart financial growth decrease vectors Bar Chart Growth And Decline Line And Solid Icon Set. Financial Performance, Economic Trends, Business Analysis Symbol
Free with trial Set Financial growth decrease icon isolated on blue and white, black background. Increasing revenue. Vector. Chart financial growth decrease vectors Set Financial growth decrease icon isolated on blue and white, black background. Increasing revenue. Vector
Free with trial Abstract bar graph chart background representing stock market trade growth and financial investment success ideal for business analysis economic data visualization and corporate finance concept designs. Chart financial growth decrease illustrations Abstract bar graph chart stock market trade background showing upward growth financial investment concept. Abstract bar graph chart background representing stock market trade growth and financial investment success ideal for business analysis economic data visualization and corporate finance concept designs
Free with trial Red Financial growth decrease icon isolated seamless pattern on blue background. Increasing revenue. Vector. Chart financial growth decrease vectors Red Financial growth decrease icon isolated seamless pattern on blue background. Increasing revenue. Vector
Free with trial Business growth and decline icon in circular outline. Up and down trend chart symbol illustration. Increase and decrease bar graph concept. Chart financial growth decrease vectors Business growth and decline icon in circular outline. Up and down trend chart symbol. Increase and decrease bar graph concept
Free with trial Blue Financial growth decrease icon isolated on blue background. Increasing revenue. Minimalism concept. 3D render illustration. Chart financial growth decrease illustrations Blue Financial growth decrease icon isolated on blue background. Increasing revenue. Minimalism concept. 3D render
Free with trial Set Financial growth increase, Casino chips, decrease and Online sports betting icon with long shadow. Vector. Chart financial growth decrease vectors Set Financial growth increase, Casino chips, decrease and Online sports betting icon with long shadow. Vector
Free with trial Set Isometric line Binary code, Financial growth decrease, Processor CPU and Pie chart infographic icon. Vector. Chart financial growth decrease illustrations Set Isometric line Binary code, Financial growth decrease, Processor CPU and Pie chart infographic icon. Vector
Free with trial Set line Laptop with browser window Browser Financial growth decrease and Website stocks market. Business infographic template. Vector. Chart financial growth decrease illustrations Set line Laptop with browser window, Browser, Financial growth decrease and Website stocks market. Business infographic
Free with trial White line Financial growth decrease icon isolated on white background. Increasing revenue. Red circle button. Vector. Chart financial growth decrease vectors White line Financial growth decrease icon isolated on white background. Increasing revenue. Red circle button. Vector
Free with trial Black Financial growth decrease icon isolated seamless pattern on green background. Increasing revenue. Vector. Chart financial growth decrease vectors Black Financial growth decrease icon isolated seamless pattern on green background. Increasing revenue. Vector
Free with trial A dynamic stock market chart against a blurred city skyline, symbolizing financial growth and investment opportunities. it represents the intersection of urban finance and economic trends, showcasing potential. Chart financial growth decrease illustrations Stock market analysis chart with city skyline background for financial investment growth concept. a dynamic stock market chart against a blurred city skyline, symbolizing financial growth and investment opportunities. it represents the intersection of urban finance and economic trends, showcasing potential.
Free with trial Financial chart graphic with coins, blue bar graph, blurred orange line chart. Business profit, income growth, investment, financial analysis, marketing, economic saving money concept. Chart financial growth decrease illustrations Financial chart graphic with coins, blue bar graph, blurred orange line chart. Business profit, income growth, investment
Free with trial Colorful Financial growth decrease icon isolated on white background. Increasing revenue. Square button. 3D render illustration. Chart financial growth decrease illustrations Colorful Financial growth decrease icon isolated on white background. Increasing revenue. Square button. 3D render
Free with trial A captivating stock market analysis chart that visualizes financial data and business growth. The blue background enhances the modern design, perfect for illustrating investment trends and economic reports. Chart financial growth decrease illustrations Stock market analysis chart financial data graph business investment growth blue background vector illustration. a captivating stock market analysis chart that visualizes financial data and business growth. The blue background enhances the modern design, perfect for illustrating investment trends and economic reports.
Free with trial Black line Financial growth decrease icon isolated on white background. Increasing revenue. Random dynamic shapes. Vector. Chart financial growth decrease illustrations Black line Financial growth decrease icon isolated on white background. Increasing revenue. Random dynamic shapes
Free with trial Set line Casino chip with dollar, Financial growth decrease, increase and Lottery ticket. Glowing neon icon. Vector. Chart financial growth decrease vectors Set line Casino chip with dollar, Financial growth decrease, increase and Lottery ticket. Glowing neon icon. Vector
Free with trial Filled outline Financial growth decrease icon isolated on white background. Increasing revenue. Flat filled outline style with shadow. Vector. Chart financial growth decrease illustrations Filled outline Financial growth decrease icon isolated on white background. Increasing revenue. Flat filled outline
Free with trial Green Financial growth decrease icon isolated on blue background. Increasing revenue. Minimalism concept. 3D render illustration. Chart financial growth decrease illustrations Green Financial growth decrease icon isolated on blue background. Increasing revenue. Minimalism concept. 3D render
Free with trial Grunge Financial growth decrease icon isolated on white background. Increasing revenue. Monochrome vintage drawing. Vector. Chart financial growth decrease illustrations Grunge Financial growth decrease icon isolated on white background. Increasing revenue. Monochrome vintage drawing
Free with trial Set line Data analysis Financial growth decrease Cloud and shield and Browser with stocks market. Business infographic template. Vector. Chart financial growth decrease illustrations Set line Data analysis, Financial growth decrease, Cloud and shield and Browser with stocks market. Business infographic
Free with trial Black line Financial growth decrease icon isolated seamless pattern on green background. Increasing revenue. Vector. Chart financial growth decrease illustrations Black line Financial growth decrease icon isolated seamless pattern on green background. Increasing revenue. Vector
Free with trial Set Data analysis Financial growth and decrease on seamless pattern. Vector. Chart financial growth decrease vectors Set Data analysis, Financial growth and decrease on seamless pattern. Vector
Free with trial Glowing neon line Financial growth decrease icon isolated on black background. Increasing revenue. Colorful outline concept. Vector. Chart financial growth decrease vectors Glowing neon line Financial growth decrease icon isolated on black background. Increasing revenue. Colorful outline
Free with trial Isometric line Financial growth decrease icon isolated on yellow background. Increasing revenue. Black circle button. Vector. Chart financial growth decrease vectors Isometric line Financial growth decrease icon isolated on yellow background. Increasing revenue. Black circle button
Free with trial A set of hand-drawn financial graph and chart icons. These icons are suitable for business analysis, investment strategies, and economic growth presentations. Chart financial growth decrease vectors Vector art of hand drawn financial graph and chart icons for business analysis, investment, and economic growth in vector format. A set of hand-drawn financial graph and chart icons. These icons are suitable for business analysis, investment strategies, and economic growth presentations
Free with trial Color Financial growth decrease icon isolated on white background. Increasing revenue. Flat filled outline style with shadow. Vector. Chart financial growth decrease illustrations Color Financial growth decrease icon isolated on white background. Increasing revenue. Flat filled outline style with
Free with trial Glowing neon line Financial growth decrease icon isolated on blue background. Increasing revenue. Vector. Chart financial growth decrease illustrations Glowing neon line Financial growth decrease icon isolated on blue background. Increasing revenue. Vector
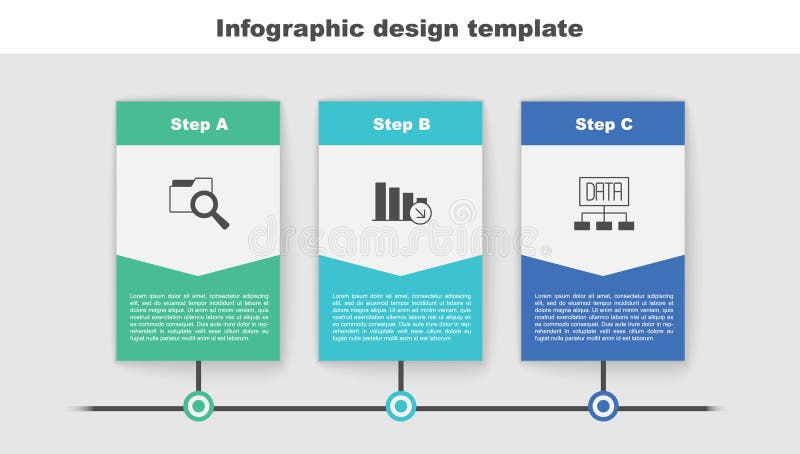
Free with trial Set Search with folder Financial growth decrease and Data analysis. Business infographic template. Vector. Chart financial growth decrease illustrations Set Search with folder, Financial growth decrease and Data analysis. Business infographic template. Vector
Free with trial Colorful Financial growth decrease icon isolated on white background. Increasing revenue. Minimalism concept. 3D render illustration. Chart financial growth decrease illustrations Colorful Financial growth decrease icon isolated on white background. Increasing revenue. Minimalism concept. 3D render
Free with trial Set line Website with stocks market Financial growth decrease Browser window and Cloud technology data transfer icon. Vector. Chart financial growth decrease illustrations Set line Website with stocks market, Financial growth decrease, Browser window and Cloud technology data transfer icon
Free with trial Line Graph Chart Icon. Data Analysis, Business Growth, And Statistical Trends Outline Symbol. Financial Performance Tracking. Editable Stroke. Isolated Vector Illustration. Chart financial growth decrease vectors Line Graph Chart Icon. Data Analysis, Business Growth, And Statistical Trends Outline Symbol. Financial Performance
Free with trial Isometric line Financial growth decrease icon isolated on pink and green background. Increasing revenue. Silver square button. Vector. Chart financial growth decrease vectors Isometric line Financial growth decrease icon isolated on pink and green background. Increasing revenue. Silver square
Free with trial White line Financial growth decrease icon isolated with long shadow background. Increasing revenue. Blue square button. Vector. Chart financial growth decrease vectors White line Financial growth decrease icon isolated with long shadow background. Increasing revenue. Blue square button
Free with trial Filled outline Financial growth decrease icon isolated on blue background. Increasing revenue. Turquoise square button. Vector. Chart financial growth decrease vectors Filled outline Financial growth decrease icon isolated on blue background. Increasing revenue. Turquoise square button
Free with trial Isometric Financial growth decrease icon isolated on pink, yellow and blue background. Increasing revenue. Square button. Vector. Chart financial growth decrease vectors Isometric Financial growth decrease icon isolated on pink, yellow and blue background. Increasing revenue. Square button
Free with trial Line Financial growth decrease icon isolated on white background. Increasing revenue. Abstract banner with liquid shapes. Vector. Chart financial growth decrease illustrations Line Financial growth decrease icon isolated on white background. Increasing revenue. Abstract banner with liquid shapes
Free with trial Line Financial growth decrease icon isolated on white and black background. Increasing revenue. Colorful outline concept. Vector. Chart financial growth decrease vectors Line Financial growth decrease icon isolated on white and black background. Increasing revenue. Colorful outline concept
Free with trial Set Isometric Server security with padlock, Financial growth decrease, and icon. Vector. Chart financial growth decrease illustrations Set Isometric Server security with padlock, Financial growth decrease, and icon. Vector
Free with trial A sleek logo featuring the letter C integrated with chart bars, symbolizing financial growth and business analytics, suitable for finance or investment companies. Chart financial growth decrease vectors Vector art of modern logo design with letter c and chart bars, representing financial growth and business success in a minimalist. A sleek logo featuring the letter C integrated with chart bars, symbolizing financial growth and business analytics, suitable for finance or investment companies
Free with trial Abstract digital graph with orange and blue lines. Concept represents finance marketing business chart growth financial trading, data analysis tech currency statistic index trend. Chart financial growth decrease illustrations Abstract digital graph with orange and blue lines. Concept represents finance marketing business chart growth financial trading
Free with trial Colorful Financial growth decrease icon isolated on white background. Increasing revenue. Minimalism concept. 3D render illustration. Chart financial growth decrease illustrations Colorful Financial growth decrease icon isolated on white background. Increasing revenue. Minimalism concept. 3D render
Free with trial Glowing neon line Financial growth decrease icon isolated on black background. Increasing revenue. Vector. Chart financial growth decrease illustrations Glowing neon line Financial growth decrease icon isolated on black background. Increasing revenue. Vector
Free with trial Glowing neon line Financial growth decrease icon isolated on black background. Increasing revenue. Vector. Chart financial growth decrease vectors Glowing neon line Financial growth decrease icon isolated on black background. Increasing revenue. Vector
Free with trial Black Financial growth decrease icon isolated on yellow background. Increasing revenue. Warning sign. Vector. Chart financial growth decrease vectors Black Financial growth decrease icon isolated on yellow background. Increasing revenue. Warning sign. Vector