Free with trial This image features colorful 3D bar graphs representing both growth and decline trends, ideal for business analytics and financial performance visualizations. Chart financial growth decrease illustrations Colorful 3D Bar Graphs Displaying Growth and Decline Trends in Business Analytics and Financial Performance on a Clean White. This image features colorful 3D bar graphs representing both growth and decline trends, ideal for business analytics and financial performance visualizations
Free with trial A vibrant 3D bar graph illustration shows financial growth trends with colorful bars. Perfect for business presentations, analytics, and creative projects. Chart financial growth decrease illustrations Colorful 3D bar graph illustration depicting financial growth and performance trends with vibrant hues and clean modern design for. A vibrant 3D bar graph. A vibrant 3D bar graph illustration shows financial growth trends with colorful bars. Perfect for business presentations, analytics, and creative projects
Free with trial Description: This abstract image depicts a financial stock market trading chart with a gold arrow pointing downwards on a blue background. The downtrend of the arrow symbolizes a decrease in stock prices or market performance. The contrasting colors and geometric shapes convey a sense of complexity and volatility in the financial market. This image can be used to represent concepts such as market analysis, investment strategies, and economic trends. Chart financial growth decrease illustrations Abstract Financial Stock Market Trading Chart with Gold Arrow Downtrend on Blue Background. Description: This abstract image depicts a financial stock market trading chart with a gold arrow pointing downwards on a blue background. The downtrend of the arrow symbolizes a decrease in stock prices or market performance. The contrasting colors and geometric shapes convey a sense of complexity and volatility in the financial market. This image can be used to represent concepts such as market analysis, investment strategies, and economic trends.
Free with trial Decrease financial condition graphic logo and vector icon. Chart financial growth decrease illustrations Decrease financial condition graphic logo and icon
Free with trial No decline icon. Prohibition symbol with graph. Red and black warning. Financial growth concept. EPS 10. Chart financial growth decrease vectors No decline icon. Prohibition symbol with graph. Red and black warning. Financial growth concept.
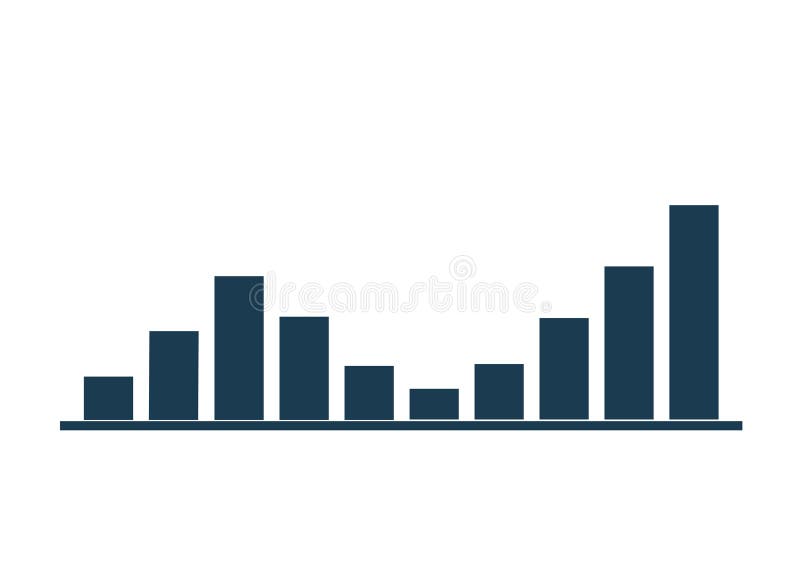
Free with trial The visual displays a clean and minimalist bar chart, illustrating a notable decrease in financial performance over a recent quarter, with a focus on dark blue tones to enhance impact. Chart financial growth decrease illustrations Minimalist financial bar chart showing significant decline in earnings over the past quarter. The visual displays a clean and minimalist bar chart, illustrating a notable decrease in financial performance over a recent quarter, with a focus on dark blue tones to enhance impact.
Free with trial Control interest. The decrease in interest rates. financial concept vector illustration. Chart financial growth decrease vectors Control interest. The decrease in interest rates. financial concept vector
Free with trial Vector illustration depicted a businessman holding a graph chart. Financial crisis had a huge impact on the economy, causing a sharp decline in the stock market and affecting many businesses. Chart financial growth decrease vectors Vector illustration depicted a businessman holding a graph chart. Financial crisis had a huge impact on the economy, causing a
Free with trial Abstract green dotted financial graph chart sparkling background. Vector minimal tech design. Chart financial growth decrease vectors Abstract green dotted financial graph chart sparkling background
Free with trial Financial crisis concept with down arrow symbol. Business profit loss, profit decrease. Flat vector illustration, eps10. Chart financial growth decrease vectors Financial crisis concept with down arrow symbol. Business profit loss, profit decrease. Flat vector illustration
Free with trial The chart showing financial crisis - 3d rendering. Chart financial growth decrease illustrations Chart showing financial crisis - 3d rendering
Free with trial Business and financial growth. Stock market and trading after Coronavirus or covid impact. Vector illustration design. Chart financial growth decrease vectors Business and financial growth. Stock market and trading after Coronavirus or covid impact. Vector illustration design
Free with trial The chart showing financial crisis - 3d rendering. Chart financial growth decrease illustrations The chart showing financial crisis - 3d rendering
Free with trial Financial Icons, showing a decrease in cash. A pile of coins in a pie chart with an arrow tends to zero. Chart financial growth decrease vectors Financial Icons, showing a decrease in cash. A pile of coins
Free with trial Financial business graph fixing, vector illustration. Tiny man character stand at stairs, huge hand hold chart arrow at screen technology. Success sales, finance profit at corporate work. Chart financial growth decrease vectors Financial business graph fixing, vector illustration, tiny man character stand at stairs, huge hand hold chart arrow at. Financial business graph fixing, vector illustration. Tiny man character stand at stairs, huge hand hold chart arrow at screen technology. Success sales, finance profit at corporate work.
Free with trial Clean animated bar chart visualizing rising and falling market trends with green bars representing growth, profit, and positive performance, and red bars indicating decline, loss, and negative movement. Symbolizes financial volatility, stock market cycles, economic fluctuations, investment performance, and business analytics. Ideal for illustrating bullish and bearish phases, economic indicators, trading activity, and financial data visualization. Chart financial growth decrease illustrations Financial Market Trend Animation Showing Upturn and Downturn Phases. Clean animated bar chart visualizing rising and falling market trends with green bars representing growth, profit, and positive performance, and red bars indicating decline, loss, and negative movement. Symbolizes financial volatility, stock market cycles, economic fluctuations, investment performance, and business analytics. Ideal for illustrating bullish and bearish phases, economic indicators, trading activity, and financial data visualization.
Free with trial The chart showing financial crisis - 3d rendering. Chart financial growth decrease illustrations Chart showing financial crisis - 3d rendering
Free with trial Business and financial growth. Stock market and trading after Coronavirus or covid impact. Vector illustration design. Chart financial growth decrease vectors Business and financial growth. Stock market and trading after Coronavirus or covid impact. Vector illustration design
Free with trial Candlestick chart down trend of stock chart, graphical analysis of financial markets. Graph of Japanese Candlestic models. Vector illustration. Chart financial growth decrease vectors Candlestick chart down trend of stock chart, graphical analysis of financial markets. Graph of Japanese Candlestic
Free with trial Winner, Uv protection and Financial diagram line icons set. Timeline process infograph. Loan percent sign. Best results, Skin cream, Candlestick chart. Decrease rate. Business set. Vector. Chart financial growth decrease vectors Winner, Uv protection and Financial diagram icons set. Loan percent sign. Vector. Winner, Uv protection and Financial diagram line icons set. Timeline process infograph. Loan percent sign. Best results, Skin cream, Candlestick chart. Decrease rate. Business set. Vector
Free with trial Dropping graph decrease decline growth vector illustration. Chart financial growth decrease vectors Dropping graph decrease decline growth
Free with trial Abstract dotted financial graph chart sparkling background. Vector minimal tech design. Chart financial growth decrease vectors Abstract dotted financial graph chart sparkling background
Free with trial Decrease graph down chart icon isolated flat design vector illustration on white background. Chart financial growth decrease vectors Decrease graph down chart icon isolated flat design vector illustration
Free with trial Increase and decrease. Business. Finance chart and abstract graph. Arrow up and down. Pixel Perfect Vector Thin Line Icons. Simple Minimal Pictogram. Chart financial growth decrease vectors Increase and decrease. Business. Finance chart. Increase and decrease. Business. Finance chart and abstract graph. Arrow up and down. Pixel Perfect Vector Thin Line Icons. Simple Minimal Pictogram
Free with trial Financial analytic chart graphs on computer monitor. Vector illustration. EPS 10. Stock image. Chart financial growth decrease vectors Financial analytic chart graphs on computer monitor. Vector illustration. EPS 10.
Free with trial A minimal style of a red down graph of the financial crisis, economic downturn, inflation, recession, failure, bankruptcy, and crisis concept. A businesswoman pushes decrease business chart diagram. Chart financial growth decrease vectors A minimal style of a red down graph of the financial crisis
Free with trial Growth chart, Analytics graph and Diagram chart icons simple set. Button with halftone dots. Salary sign. Upper arrows, Growth report, Presentation graph. Diplomat with money bag. Vector. Chart financial growth decrease vectors Growth chart, Analytics graph and Diagram chart icons set. Salary sign. Vector. Growth chart, Analytics graph and Diagram chart icons simple set. Button with halftone dots. Salary sign. Upper arrows, Growth report, Presentation graph. Diplomat with money bag. Vector
Free with trial Disease growth graph Coronavirus. chart decline in patients. Schedule of recovering and pandemic deaths COVID-19. Chart financial growth decrease vectors Disease growth graph Coronavirus. chart decline in patients. Schedule of recovering and pandemic deaths COVID-19
Free with trial Disease growth graph Coronavirus. chart decline in patients. Schedule of recovering and pandemic deaths COVID-19. Chart financial growth decrease vectors Disease growth graph Coronavirus. chart decline in patients. Schedule of recovering and pandemic deaths COVID-19
Free with trial Empty cylinder steps podium or platform on white background. Financial growth or loss. 3D rendering. Chart financial growth decrease illustrations Empty cylinder steps podium or platform on white background. Financial growth or loss
Free with trial Column re-growth trend chart isolated vector business information graphic image. Chart financial growth decrease vectors Column re-growth trend chart graphic image. Column re-growth trend chart isolated vector business information graphic image
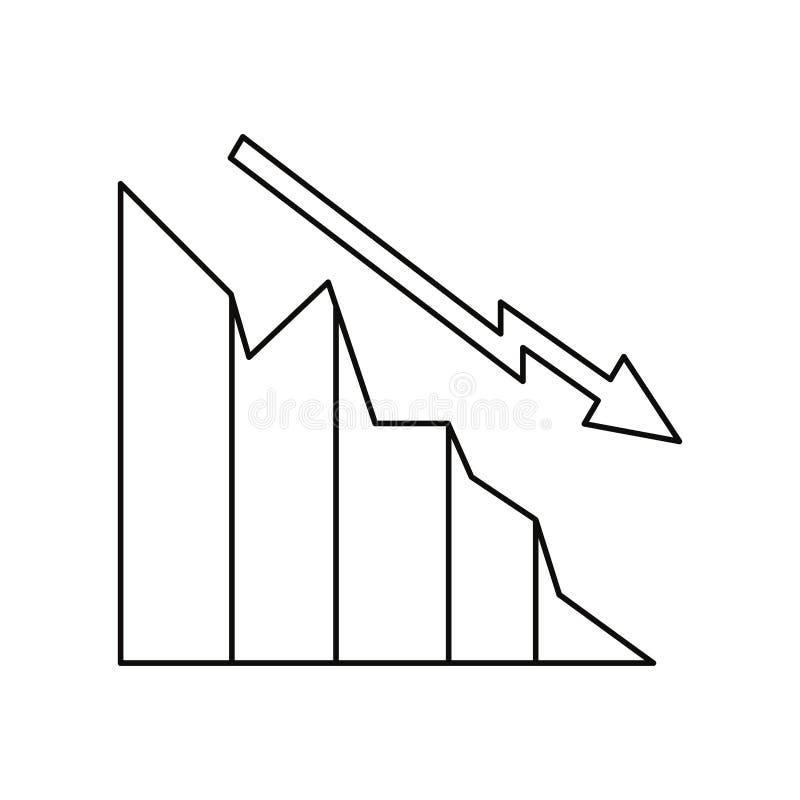
Free with trial Declining graph line icon. Decrease diagram symbol of bankrupt, Financial Economy investment crisis, low profit sale growth. Editable stroke. Vector illustration. Design on white background. EPS 10. Chart financial growth decrease vectors Declining graph line icon. Decrease diagram symbol of bankrupt
Free with trial Dropping graph decrease decline growth vector illustration. Chart financial growth decrease vectors Dropping graph decrease decline growth
Free with trial Growth and decrease icon on white background. Vector illustration. Chart financial growth decrease illustrations Growth and decrease icon on white background
Free with trial Stacks of golden coins arranged in ascending order, representing financial growth and investment. The background features a blurred stock market graph, symbolizing market trends and investment opportunities. The image conveys concepts of wealth accumulation, financial planning, and economic prosperity. Suitable for illustrating articles, presentations, or advertisements related to finance, investment, and business. Chart financial growth decrease illustrations Financial Growth and Investment
Free with trial Analyzing the business failure and decline. White magnifying glass analyzing a growth chart on a blue background, representing market analysis and business growth. 3D render. Chart financial growth decrease illustrations Magnifying glass analyzing growth chart on blue background. Analyzing the business failure and decline. White magnifying glass analyzing a growth chart on a blue background, representing market analysis and business growth. 3D render
Free with trial Set of Science icons, such as Financial diagram, Report timer, Recovery hdd symbols. Mobile screen mockup banners. Graph laptop line icons. Candlestick chart, Growth chart, Backup info. Vector. Chart financial growth decrease vectors Set of Science icons, such as Financial diagram, Report timer, Recovery hdd symbols. Graph laptop line icons. Vector. Set of Science icons, such as Financial diagram, Report timer, Recovery hdd symbols. Mobile screen mockup banners. Graph laptop line icons. Candlestick chart, Growth chart, Backup info. Vector
Free with trial A 3D rendered illustration depicting business growth. The image showcases two upward-trending arrow charts, one in gold and the other in blue, representing positive trends, progress, and success. The charts are set against a clean, light background, emphasizing the upward movement and potential for financial gain. Suitable for illustrating economic growth, investment strategies, and business performance. Chart financial growth decrease illustrations Growth Chart with Arrows. A 3D rendered illustration depicting business growth. The image showcases two upward-trending arrow charts, one in gold and the other in blue, representing positive trends, progress, and success. The charts are set against a clean, light background, emphasizing the upward movement and potential for financial gain. Suitable for illustrating economic growth, investment strategies, and business performance.
Free with trial Decrease diagram chart business report illustration. Chart financial growth decrease illustrations Decrease diagram chart business
Free with trial Vector image charts and diagrams for presentation or financial report. Infographics concept. Increase and decrease of indicators in graphic diagram. Colorful vector illustration. Chart financial growth decrease vectors Vector image charts and diagrams for presentation or financial report. Infographics concept.Increase and decrease of
Free with trial Stock market crash concept. Broken chart arrow. Stock market growth and sudden drawdown. Financial chart that presents stock crisis. Business bankruptcy. Investment risks. Vector illustration. Chart financial growth decrease vectors Stock market growth and sudden drawdown illustration. Stock market crash concept. Broken chart arrow. Stock market growth and sudden drawdown. Financial chart that presents stock crisis. Business bankruptcy. Investment risks. Vector illustration
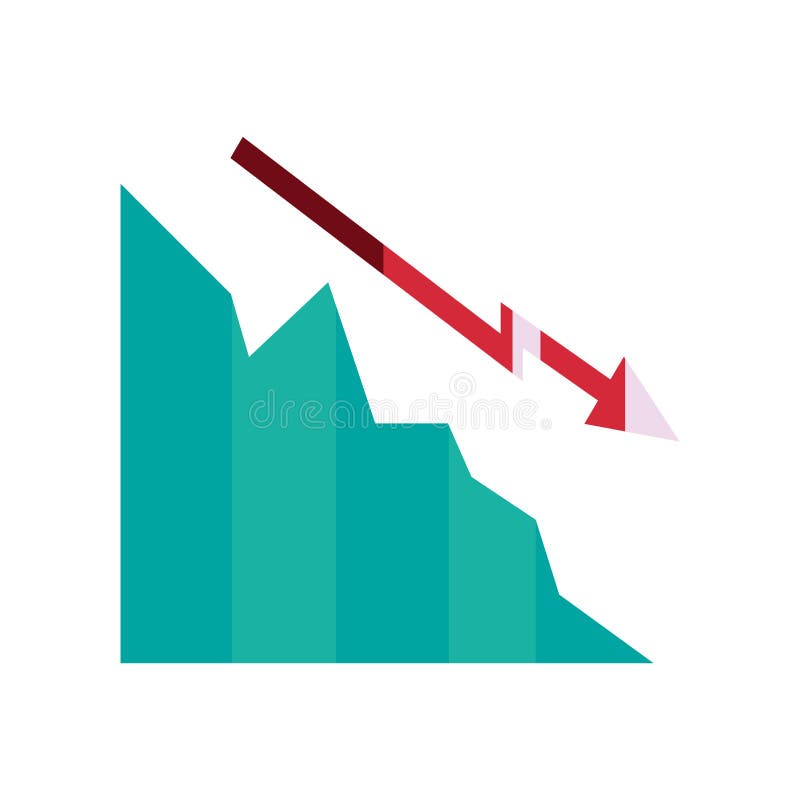
Free with trial An abstract financial chart with a downward trend in blue, representing market decline, economic downturn, and potential investment risks in the stock market. Chart financial growth decrease illustrations Abstract financial chart with downward trend in blue. An abstract financial chart with a downward trend in blue, representing market decline, economic downturn, and potential investment risks in the stock market
Free with trial Report document, Currency audit and Infochart icons simple set. Button with halftone dots. Column chart sign. Growth chart, Stock exchange, Financial graph. Finance set. Vector. Chart financial growth decrease vectors Report document, Currency audit and Infochart icons set. Column chart sign. Vector. Report document, Currency audit and Infochart icons simple set. Button with halftone dots. Column chart sign. Growth chart, Stock exchange, Financial graph. Finance set. Vector
Free with trial Finance increase and decrease chart outline and solid icon vector design illustration. Stock market symbol. Chart financial growth decrease vectors Finance increase and decrease chart outline and solid icon vector
Free with trial Hand of businessman point to the screen show financial market chart graphic. Stock market concept. By generative Ai. Chart financial growth decrease illustrations Hand of businessman point to the screen show financial market chart graphic. By generative Ai. Hand of businessman point to the screen show financial market chart graphic. Stock market concept. By generative Ai
Free with trial Growth chart neon icon. Up and Down icons in neon style. Simple thin line, outline vector of banking icons for ui and ux, website or mobile application. Chart financial growth decrease illustrations Growth chart neon icon.Up and Down icons in neon style. Simple thin line, outline vector of banking icons for ui and ux, website
Free with trial MInus growths chart collection. Deficit symbol. Bar diagram. Fail growth arrow icon. Non progress symbol. Chart decrease - stock vector. Chart financial growth decrease vectors Decreasing chart with bar, arrow, and Rupiah symbol. MInus growths chart collection. Deficit symbol. Bar diagram. Fail growth arrow icon. Non progress symbol. Chart decrease - stock vector.
Free with trial Disease growth graph Coronavirus. chart decline in patients. Schedule of recovering and pandemic deaths COVID-19. Chart financial growth decrease vectors Disease growth graph Coronavirus. chart decline in patients. Schedule of recovering and pandemic deaths COVID-19
Free with trial Business financial analytics bar chart / graphs on computer flat icons on a transparent background. Chart financial growth decrease vectors Business financial analytics bar chart / graphs on computer flat icons on a transparent background
Free with trial Dot plot, Air balloon and Pyramid chart icons simple set. Financial documents sign. Presentation graph, Sky travelling, Report analysis. Check docs. Education set. Linear dot plot icon. Vector. Chart financial growth decrease vectors Dot plot, Air balloon and Pyramid chart icons set. Financial documents sign. Vector. Dot plot, Air balloon and Pyramid chart icons simple set. Financial documents sign. Presentation graph, Sky travelling, Report analysis. Check docs. Education set. Linear dot plot icon. Vector
Free with trial 3d model of financial graph with red backlight on blue background, stock market financing chart, economic boom and bust, investment bankruptcy and inflation, global rising and falling economy. 3D rendering. Chart financial growth decrease illustrations 3d model of financial graph with red backlight on blue background, stock market financing chart, economic boom and bust
Free with trial A 3D bar chart illustrating financial data with green bars indicating growth and red bars indicating decline, presented in a clean visual format for analysis. Chart financial growth decrease illustrations Bar chart growth and decline on. A 3D bar chart illustrating financial data with green bars indicating growth and red bars indicating decline, presented in a clean visual format for analysis
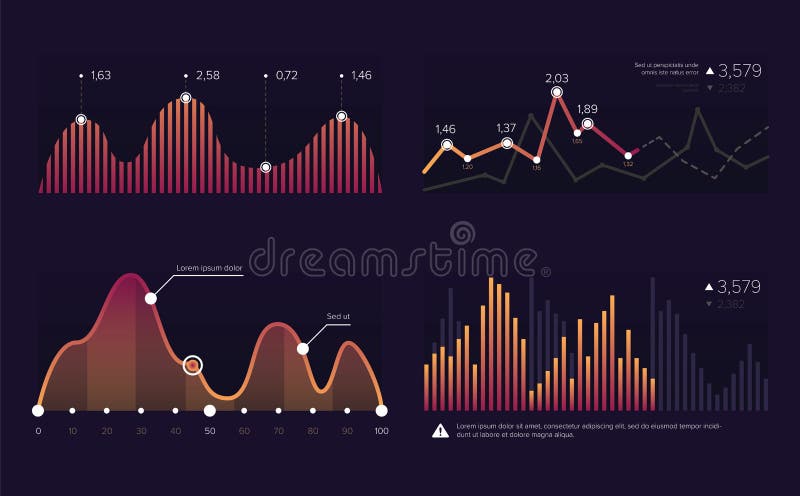
Free with trial A dynamic abstract financial graph with peaks in neon colors against a dark, gradient background, depicting growth and decline trends. Minimalism. Chart financial growth decrease illustrations A dynamic abstract financial graph with peaks in neon colors against a dark, gradient background, depicting growth and decline
Free with trial A conceptual illustration showing a financial bar chart in a steep decline. Chart financial growth decrease vectors Declining Green Growth Bar Chart. A conceptual illustration showing a financial bar chart in a steep decline
Free with trial A clean, minimalist 3D render of a blue bar chart with a blue trend line connecting circular data points. The bars vary in height, illustrating growth and fluctuations. The background is a bright, clean white, emphasizing the chart's elements. This graphic is ideal for representing financial data, business growth, market trends, statistics, and performance analysis in a modern and professional style. Chart financial growth decrease illustrations 3D Blue Bar Chart with Trend Line. A clean, minimalist 3D render of a blue bar chart with a blue trend line connecting circular data points. The bars vary in height, illustrating growth and fluctuations. The background is a bright, clean white, emphasizing the chart's elements. This graphic is ideal for representing financial data, business growth, market trends, statistics, and performance analysis in a modern and professional style.
Free with trial Graph rating icon outline vector. Growth chart. Money stock. Chart financial growth decrease vectors Graph rating icon outline vector. Growth chart
Free with trial Decrease vector symbol isolated on white background. Chart icon. Chart financial growth decrease vectors Decrease icon on white background. Chart icon. Decrease vector symbol isolated on white background. Chart icon.
Free with trial A stylized illustration depicts a bar chart with blue bars of varying heights against a dark blue grid background. A prominent red and yellow arrow, symbolizing a downward trend, dramatically descends across the chart. This graphic represents financial decline, market crash, economic recession, or negative growth. Its clean, vector-style design makes it suitable for presentations, reports, and articles on business, finance, and economics. Chart financial growth decrease illustrations Declining Bar Chart with Red Arrow. A stylized illustration depicts a bar chart with blue bars of varying heights against a dark blue grid background. A prominent red and yellow arrow, symbolizing a downward trend, dramatically descends across the chart. This graphic represents financial decline, market crash, economic recession, or negative growth. Its clean, vector-style design makes it suitable for presentations, reports, and articles on business, finance, and economics.
Free with trial Simple set of financial and graph minimal icon such as pie chart, statistics isolated. Modern outline on white background vector. Chart financial growth decrease vectors Simple set of financial and graph minimal icon such as pie chart, statistics isolated. Modern outline on white background
Free with trial Decrease diagram chart business report vector illustration. Chart financial growth decrease vectors Decrease diagram chart business
Free with trial Economics Financial Loss Analytics chart vector illustration. Chart financial growth decrease vectors Economics Financial Loss Analytics chart
Free with trial 3D render of covid-19 and incidence growth chart. Chart financial growth decrease illustrations 3D render of covid 19 and incidence growth chart.
Free with trial Stock market crash concept. Broken chart arrow. Stock market growth and sudden drawdown. Financial chart that presents stock crisis. Business bankruptcy. Investment risks. Vector illustration. Chart financial growth decrease vectors Stock market growth and sudden drawdown illustration. Stock market crash concept. Broken chart arrow. Stock market growth and sudden drawdown. Financial chart that presents stock crisis. Business bankruptcy. Investment risks. Vector illustration
Free with trial Graph chart, 24 hours and Diagram line icons set. Handshake deal, research and promotion complex icons. Checklist sign. Growth report, Repeat, Growth graph. Survey. Finance set. Vector. Chart financial growth decrease vectors Graph chart, 24 hours and Diagram icons set. Checklist sign. Growth report, Repeat, Growth graph. Survey. Vector. Graph chart, 24 hours and Diagram line icons set. Handshake deal, research and promotion complex icons. Checklist sign. Growth report, Repeat, Growth graph. Survey. Finance set. Vector
Free with trial Graph chart, 24 hours and Diagram line icons set. Timeline infographic. Checklist sign. Growth report, Repeat, Growth graph. Survey. Finance set. Graph chart icon. Timeline diagram. Vector. Chart financial growth decrease vectors Graph chart, 24 hours and Diagram icons set. Checklist sign. Growth report, Repeat, Growth graph. Survey. Vector. Graph chart, 24 hours and Diagram line icons set. Timeline infographic. Checklist sign. Growth report, Repeat, Growth graph. Survey. Finance set. Graph chart icon. Timeline diagram. Vector
Free with trial A modern flat design icon representing financial data analysis and market trends. This vector illustration features a combination of a green bar chart and a dark grey line graph, showing fluctuations in performance. An upward arrow indicates initial growth, followed by a volatile trend line symbolizing concepts like market instability, economic changes, profit and loss, or business analytics. This versatile graphic is perfect for infographics, financial reports, presentations, websites, and applications related to business, finance, statistics, and economics. Isolated on a white background for easy use. Chart financial growth decrease vectors Financial Market Fluctuation Graph Icon. A modern flat design icon representing financial data analysis and market trends. This vector illustration features a combination of a green bar chart and a dark grey line graph, showing fluctuations in performance. An upward arrow indicates initial growth, followed by a volatile trend line symbolizing concepts like market instability, economic changes, profit and loss, or business analytics. This versatile graphic is perfect for infographics, financial reports, presentations, websites, and applications related to business, finance, statistics, and economics. Isolated on a white background for easy use.
Free with trial White cylinders with different height. Bar graph. Column chart elements for finance statistical infographic. Growth or decrease signs. Vector 3d illustration. Chart financial growth decrease vectors White cylinders with different height. Bar graph. Column chart elements for finance statistical infographic. Growth or
Free with trial Abstract digital illustration of a financial chart. A glowing white line graph rises and falls against a blue background with a grid pattern made of dots. The image conveys concepts of market trends, stock analysis, investment, and economic fluctuations. Suitable for illustrating financial reports, business presentations, and technology-related articles. Chart financial growth decrease illustrations Abstract Financial Chart with Glowing Line. Abstract digital illustration of a financial chart. A glowing white line graph rises and falls against a blue background with a grid pattern made of dots. The image conveys concepts of market trends, stock analysis, investment, and economic fluctuations. Suitable for illustrating financial reports, business presentations, and technology-related articles.
Free with trial Do or Stop. Wallet, Pie chart and Report timer icons simple set. Histogram sign. Affordability, 3d graph, Growth chart. Economic trend. Finance set. Line wallet do icon. Prohibited ban stop. Vector. Chart financial growth decrease vectors Wallet, Pie chart and Report timer icons set. Histogram sign. Affordability, 3d graph, Growth chart. Vector. Do or Stop. Wallet, Pie chart and Report timer icons simple set. Histogram sign. Affordability, 3d graph, Growth chart. Economic trend. Finance set. Line wallet do icon. Prohibited ban stop. Vector
Free with trial Graphic design chart and Diagram icons. Business and financial concept. Flat icons collection set. Vector illustration. Chart financial growth decrease vectors Graphic design chart and Diagram icons. Business and financial concept. Flat icons collection set. Vector illustration
Free with trial A clean, minimalist bar chart illustration set against a solid green background. The chart features three white vertical bars of different heights, representing data points or progress over time. A simple white grid and axes are visible, indicating a clear visual representation of statistics. This versatile graphic is ideal for conveying concepts of business growth, financial analysis, market trends, statistical reporting, or educational content in a modern, easy-to-understand format. Perfect for presentations, infographics, websites, and applications. Chart financial growth decrease vectors Minimalist Bar Chart Icon on Green Background. A clean, minimalist bar chart illustration set against a solid green background. The chart features three white vertical bars of different heights, representing data points or progress over time. A simple white grid and axes are visible, indicating a clear visual representation of statistics. This versatile graphic is ideal for conveying concepts of business growth, financial analysis, market trends, statistical reporting, or educational content in a modern, easy-to-understand format. Perfect for presentations, infographics, websites, and applications.
Free with trial Start business, Time change and Graph chart icons simple set. Button with halftone dots. Money diagram sign. Launch idea, Clock, Growth report. Currency diagram. Education set. Vector. Chart financial growth decrease vectors Start business, Time change and Graph chart icons set. Money diagram sign. Launch idea, Clock, Growth report. Vector. Start business, Time change and Graph chart icons simple set. Button with halftone dots. Money diagram sign. Launch idea, Clock, Growth report. Currency diagram. Education set. Vector
Free with trial A 3D render illustrating the concept of financial decline and economic crisis. The image features a bar chart with progressively smaller bars and a prominent red arrow pointing downwards, signifying a sharp downturn. This visual metaphor represents a stock market crash, business failure, investment loss, or recession. The minimalist design on a yellow background is perfect for financial reports, business presentations, economic news articles, and web graphics discussing negative growth, losses, or bankruptcy. A small stack of coins reinforces the monetary theme. Chart financial growth decrease illustrations 3D Financial Decline Graph with Downward Arrow. A 3D render illustrating the concept of financial decline and economic crisis. The image features a bar chart with progressively smaller bars and a prominent red arrow pointing downwards, signifying a sharp downturn. This visual metaphor represents a stock market crash, business failure, investment loss, or recession. The minimalist design on a yellow background is perfect for financial reports, business presentations, economic news articles, and web graphics discussing negative growth, losses, or bankruptcy. A small stack of coins reinforces the monetary theme.
Free with trial Recession and growth chart set. Business data market elements dot bar pie charts diagrams and graphs with colorful dots and brush line arrow set isolated vector illustration. Chart financial growth decrease vectors Recession and growth chart set. Business data market elements dot bar pie charts diagrams and graphs with colorful dots and brush
Free with trial Checklist sign. Diploma certificate, save planet chat bubbles. Graph chart, 24 hours and Diagram line icons set. Growth report, Repeat, Growth graph. Survey. Finance set. Outline icons set. Vector. Chart financial growth decrease vectors Graph chart, 24 hours and Diagram icons set. Checklist sign. Growth report, Repeat, Growth graph. Survey. Vector. Checklist sign. Diploma certificate, save planet chat bubbles. Graph chart, 24 hours and Diagram line icons set. Growth report, Repeat, Growth graph. Survey. Finance set. Outline icons set. Vector
Free with trial Financial chart against urban cityscape background ,Generative AI. Chart financial growth decrease illustrations Financial chart against urban cityscape background
Free with trial A 3D white bar chart shows a significant downward trend indicated by a sharp, angled arrow pointing downwards. The bars decrease in height from left to right, illustrating a concept of decline or loss. The clean white background emphasizes the minimalist design and the stark visual representation of negative growth. Chart financial growth decrease illustrations 3D White Bar Chart with Downward Trending Arrow on White Background graph decline. A 3D white bar chart shows a significant downward trend indicated by a sharp, angled arrow pointing downwards. The bars decrease in height from left to right, illustrating a concept of decline or loss. The clean white background emphasizes the minimalist design and the stark visual representation of negative growth
Free with trial 3D Green and red arrows going Up and Down. Trade arrow. Exchange price chart. Growth and changes in value. Trendy and modern vector in 3d style. Chart financial growth decrease vectors 3D Green and red arrows going Up and Down. Trade arrow. Exchange price chart. Growth and changes in value
Free with trial A clean and simple vector illustration of a bar chart isolated on a white background. This minimalist graphic features three vertical bars in varying shades of blue, representing data, statistics, or progress. Ideal for business reports, financial presentations, infographics, websites, and educational materials. The flat design symbolizes concepts like growth, analysis, market research, and performance comparison, offering a modern and clear way to visualize information. Ample copy space is available. Chart financial growth decrease illustrations Simple Blue Bar Chart Vector Icon for Business Data. A clean and simple vector illustration of a bar chart isolated on a white background. This minimalist graphic features three vertical bars in varying shades of blue, representing data, statistics, or progress. Ideal for business reports, financial presentations, infographics, websites, and educational materials. The flat design symbolizes concepts like growth, analysis, market research, and performance comparison, offering a modern and clear way to visualize information. Ample copy space is available.
Free with trial Dot plot, Air balloon and Pyramid chart icons simple set. Infographic timeline. Financial documents sign. Presentation graph, Sky travelling, Report analysis. Check docs. Education set. Vector. Chart financial growth decrease vectors Dot plot, Air balloon and Pyramid chart icons set. Financial documents sign. Vector. Dot plot, Air balloon and Pyramid chart icons simple set. Infographic timeline. Financial documents sign. Presentation graph, Sky travelling, Report analysis. Check docs. Education set. Vector