Free with trial Calculator alongside arrows indicating increase and decrease, and a line graph with fluctuations. Ideal for finance, budgeting, economics, analysis, statistics, decision-making, simple flat metaphor. Chart financial growth decrease illustrations Calculator with Arrows and Graph Representing Financial Analysis and Data Trends. Calculator alongside arrows indicating increase and decrease, and a line graph with fluctuations. Ideal for finance, budgeting, economics, analysis, statistics, decision-making, simple flat metaphor
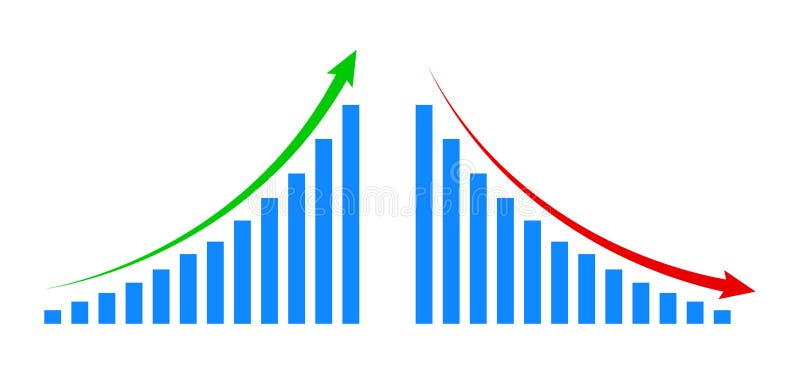
Free with trial Colorful bar chart on a blue background illustrating data trends ,Generative ai. Chart financial growth decrease illustrations Vibrant bar chart on blue background, visualizing data trends and insights colorful. Colorful bar chart on a blue background illustrating data trends ,Generative ai
Free with trial The pink chart for business concept 3d rendering. Chart financial growth decrease illustrations The pink chart for business concept 3d rendering
Free with trial Three identical green downward-pointing arrows are displayed side-by-side against a black background. Each arrow features a white percent symbol (%) prominently displayed on its surface. The visual suggests a decrease in percentage, a sale, or a financial reduction. Chart financial growth decrease illustrations Three green downward arrows with percent symbols percentage. Three identical green downward-pointing arrows are displayed side-by-side against a black background. Each arrow features a white percent symbol (%) prominently displayed on its surface. The visual suggests a decrease in percentage, a sale, or a financial reduction
Free with trial Declining financial data graph with decreasing bars and arrow. Chart financial growth decrease vectors Declining financial data graph with decreasing bars and arrow
Free with trial This image shows a bar graph depicting a downward trend. A red arrow highlights the decrease in quarterly sales from Q1 to Q4, indicating negative growth and financial loss. Chart financial growth decrease illustrations Declining Bar Graph with Red Arrow Depicts Sales Performance. This image shows a bar graph depicting a downward trend. A red arrow highlights the decrease in quarterly sales from Q1 to Q4, indicating negative growth and financial loss.
Free with trial Green bar chart showing a downward trend with a down arrow graphic. Chart financial growth decrease vectors Green bar chart showing a downward trend with a down arrow graphic
Free with trial This image shows colorful financial charts and graphs, generated by AI, illustrating various data points and percentages. The overlaid arrows suggest a downward trend, potentially indicating a negative market shift or economic decline. The visual representation aids in quick understanding of compl. Chart financial growth decrease illustrations Financial Data Analysis. This image shows colorful financial charts and graphs, generated by AI, illustrating various data points and percentages. The overlaid arrows suggest a downward trend, potentially indicating a negative market shift or economic decline. The visual representation aids in quick understanding of compl
Free with trial Colorful bar graph showing market analysis, financial report and accounting on a digital tablet. Generative AI. Chart financial growth decrease illustrations Colorful bar graph showing market analysis and financial report. Colorful bar graph showing market analysis, financial report and accounting on a digital tablet. Generative AI
Free with trial This image depicts a close-up of a hand using a pen to review detailed financial data, generated by AI. The image emphasizes precision and attention to detail in financial analysis. The cool blue tones enhance the professional and analytical nature of the task. Chart financial growth decrease illustrations Analyzing Financial Data. This image depicts a close-up of a hand using a pen to review detailed financial data, generated by AI. The image emphasizes precision and attention to detail in financial analysis. The cool blue tones enhance the professional and analytical nature of the task.
Free with trial Red Line Graph Showing Growth and Fluctuation on White Grid Paper, generative Ai. Chart financial growth decrease illustrations Red Line Graph Showing Growth and Fluctuation on White Grid Paper
Free with trial Quality increase and cost optimization to improve efficiency and profit. Businessman with quality control growth graph and cost reduction, Effective business, Efficient Risk. Chart financial growth decrease vectors Quality increase and cost optimization to improve efficiency and profit. Businessman with quality control growth graph and cost
Free with trial Magnifying glass focuses on a graphic pie chart over document, highlighting trends and potential insights Use for data analysis and business concept. Chart financial growth decrease illustrations Analyzing Graphic Pie Chart with Magnifying Glass for Insights. Magnifying glass focuses on a graphic pie chart over document, highlighting trends and potential insights Use for data analysis and business concept
Free with trial Reduction chart icon set in thin line outline style and linear vector sign. Chart financial growth decrease vectors Reduction chart icon thin line illustration. Reduction chart icon set in thin line outline style and linear vector sign
Free with trial Reduction chart icon vector line logo mark or symbol set collection outline style. Chart financial growth decrease vectors Reduction chart icon thin line illustration. Reduction chart icon vector line logo mark or symbol set collection outline style
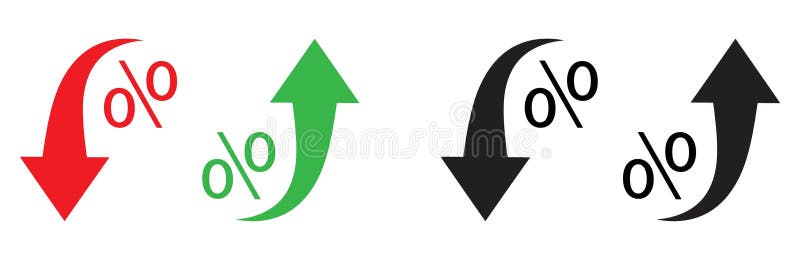
Free with trial Red and black arrows point downward, while green and black arrows point upward. Each arrow is curved, paired with a percentage symbol (%), indicating changes in rate or value. The red and black arrows denote decrease, and the green and black arrows denote increase, suggesting economic or statistical trends. The arrows and symbols are bold and stylized for emphasis. Chart financial growth decrease vectors Percent arrow icon. Growth, increase, decrease arrow filled icons. Up arrows, down arrows. Red and black arrows point downward, while green and black arrows point upward. Each arrow is curved, paired with a percentage symbol (%), indicating changes in rate or value. The red and black arrows denote decrease, and the green and black arrows denote increase, suggesting economic or statistical trends. The arrows and symbols are bold and stylized for emphasis.
Free with trial A 3D rendered icon depicting a downward trend, symbolizing financial decrease and economic challenges. Chart financial growth decrease illustrations Financial decline icon representing economic downturn and losses. A 3D rendered icon depicting a downward trend, symbolizing financial decrease and economic challenges
Free with trial Business chart is displaying market data analytics with a candlestick chart, pie chart and line graph. Chart financial growth decrease vectors Business chart displaying market data analytics with candlestick chart, pie chart and line graph
Free with trial Doodle style bar and line graph icon representing growth and analytics. Chart financial growth decrease vectors Doodle style bar and line graph icon representing growth and analytics
Free with trial Man Views Red Green Financial Data On Screen At Desk For Analysis , monochrome style. Chart financial growth decrease illustrations Man Views Red Green Financial Data On Screen At Desk For Analysis
Free with trial Stock market chart showing a downward trend with red and green candlesticks indicating price fluctuations. A moving average line overlays the candlesticks. Volume bars at the bottom correlate with trading activity, mostly red, suggesting higher selling pressure. Vertical axis shows price levels, and horizontal axis depicts time. The chart originates from Cendlewe (Bearits). Candlestick shapes and colors represent price movements over time, with red indicating a decrease and green an increase. Chart financial growth decrease illustrations Dynamic stock market chart shows downward trend with red and green candlesticks and volume bars. Stock market chart showing a downward trend with red and green candlesticks indicating price fluctuations. A moving average line overlays the candlesticks. Volume bars at the bottom correlate with trading activity, mostly red, suggesting higher selling pressure. Vertical axis shows price levels, and horizontal axis depicts time. The chart originates from Cendlewe (Bearits). Candlestick shapes and colors represent price movements over time, with red indicating a decrease and green an increase.
Free with trial This image features a striking red neon-style line graph on a black background, symbolizing decline, decrease, or downward trend in data visualization. Ideal for business, finance, and analytics concepts, it visually represents performance drops or negative growth in a modern, eye-catching manner. Chart financial growth decrease illustrations Red Neon Declining Graph Line Icon for Business Data Visualization. This image features a striking red neon-style line graph on a black background, symbolizing decline, decrease, or downward trend in data visualization. Ideal for business, finance, and analytics concepts, it visually represents performance drops or negative growth in a modern, eye-catching manner.
Free with trial Dynamic financial graphs and data analysis display on digital screen. That the image is generated using AI. Chart financial growth decrease illustrations Dynamic financial graphs and data analysis display on digital screen
Free with trial Up and down graph icon vector in circular line. Outline bar chart with uptrend and downtrend arrow symbol. Chart financial growth decrease vectors Up and down graph icon in circular line. Outline bar chart with uptrend and downtrend arrow symbol
Free with trial Graph up and down icon vector in circular line. Outline bar chart with arrow symbol. Analytics concept. Chart financial growth decrease vectors Graph up and down icon in circular line. Outline bar chart with arrow symbol. Analytics concept
Free with trial Declining bar graph illustration, business, financial, and economic data. Chart financial growth decrease vectors Declining bar graph illustration, business, financial, and economic data
Free with trial Downward trending chart with a declining arrow in vector illustration. Chart financial growth decrease vectors Downward trending chart with a declining arrow in vector illustration
Free with trial Graph going Up and Down sign with green and red arrows. graph increase, decrease sign design. Chart financial growth decrease vectors Graph going Up and Down sign with green and red arrows. graph increase, decrease sign
Free with trial Vector illustration of decreasing bar graph with arrow, financial concept. Chart financial growth decrease vectors Vector illustration of decreasing bar graph with arrow, financial concept
Free with trial Analyze Business Graph with Gold Coins and Pen, Financial Investment Theme , dreamy concept. Chart financial growth decrease illustrations Analyze Business Graph with Gold Coins and Pen, Financial Investment Theme
Free with trial A financial market graph on a blue background illustrating investment trends, this is a visual representation of market fluctuations and volume, reflecting economic movements, investment strategies and business performance analysis. Generative AI. Chart financial growth decrease illustrations Financial markets graph on a blue background showing investment trends. A financial market graph on a blue background illustrating investment trends, this is a visual representation of market fluctuations and volume, reflecting economic movements, investment strategies and business performance analysis. Generative AI
Free with trial A visual representation of data showing a decline over a period. The blue bars are arranged in descending order of height, each marked with numerical indicators, suggesting a decrease in value or quantity. Chart financial growth decrease illustrations Blue bar chart showing decreasing trend over time with numerical labels. A visual representation of data showing a decline over a period. The blue bars are arranged in descending order of height, each marked with numerical indicators, suggesting a decrease in value or quantity
Free with trial Line graph up and down icon in black circle. Outline bar chart with arrow symbol vector. Analytics concept. Chart financial growth decrease vectors Line graph up and down icon in black circle. Outline bar chart with arrow symbol. Analytics concept
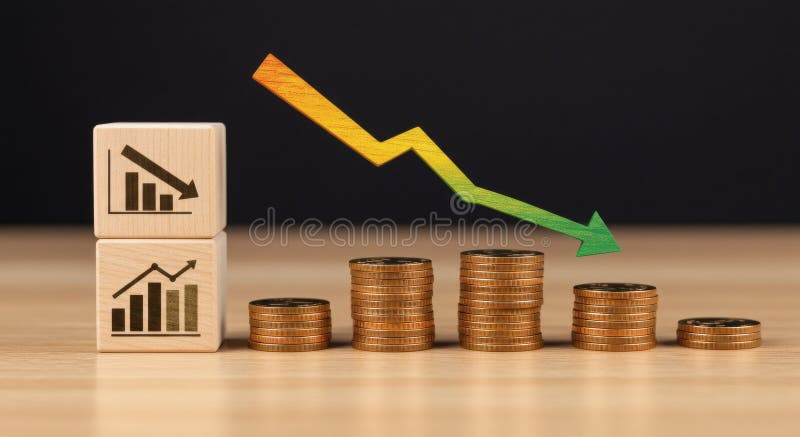
Free with trial Image shows wooden blocks forming a chart. It graphically represents a market decline or economic downturn, suitable for illustrating business graphs and financial crisis concepts. Chart financial growth decrease illustrations Wooden Blocks Graph Depicting Market Decline Good Resolution Stock Photo. Image shows wooden blocks forming a chart. It graphically represents a market decline or economic downturn, suitable for illustrating business graphs and financial crisis concepts.
Free with trial Simple bar chart graphic with rising and falling columns of varying heights. Chart financial growth decrease vectors Simple bar chart graphic with rising and falling columns of varying heights
Free with trial This 3D rendering shows vibrant bar and pie charts illustrating business growth, data analysis, and statistical visualization. Perfect for presentations, reports, or marketing materials. Chart financial growth decrease illustrations Colorful 3D Bar and Pie Charts Representing Business Growth and Data Analysis. This 3D rendering shows vibrant bar and pie charts illustrating business growth, data analysis, and statistical visualization. Perfect for presentations, reports, or marketing materials.
Free with trial A set of simple outline icons related to financial and investment themes, featuring dollar signs and clean, minimalistic designs. Chart financial growth decrease vectors Simple Outline Financial and Investment Icons Symbol Set with Dollar Sign. A set of simple outline icons related to financial and investment themes, featuring dollar signs and clean, minimalistic designs.
Free with trial View falling Trends in Market And Economic Downturn, Chart Analysis, Indicators , layered depth. Chart financial growth decrease illustrations View falling Trends in Market And Economic Downturn, Chart Analysis, Indicators
Free with trial Percent growth and decline icon in rounded corner. Percentage arrow up and down sign symbol vector. Chart financial growth decrease vectors Percent growth and decline icon in rounded corner. Percentage arrow up and down sign symbol
Free with trial Teal bar chart illustration for data visualization and statistical analysis. Chart financial growth decrease vectors Teal bar chart illustration for data visualization and statistical analysis
Free with trial Bitcoin and virtual money concept. Bitcoin stock growth. Business. Chart financial growth decrease illustrations Bitcoin and virtual money concept. Bitcoin stock growth
Free with trial Vector icons showing business growth and decline trends with arrows and magnifying glass for detailed analysis, representing financial and market data in a clear style. Professional and informative. Generative AI. Chart financial growth decrease vectors Business growth and decline infographic icons with arrows and magnifying glass for analysis. Vector icons showing business growth and decline trends with arrows and magnifying glass for detailed analysis, representing financial and market data in a clear style. Professional and informative. Generative AI
Free with trial Computer Monitor with a Graph Showing Decreasing Bar Chart for Data Analysis. Chart financial growth decrease vectors Computer Monitor with a Graph Showing Decreasing Bar Chart for Data Analysis
Free with trial Business financial graph showing decreasing trend of profits down with arrow. Chart financial growth decrease vectors Business financial graph showing decreasing trend of profits down with arrow
Free with trial Trend chart icons. Rising and falling bars. Arrow and bar graph. Economic data symbols. EPS 10. Chart financial growth decrease vectors Trend chart icons. Rising and falling bars. Arrow and bar graph. Economic data symbols.
Free with trial Drawn down arrow trend graph depicting financial decline and economic downturn. Chart financial growth decrease vectors Drawn down arrow trend graph depicting financial decline and economic downturn
Free with trial Money movement icon. Dollar coin arrows. Financial flow Vector. Market trend symbol. EPS 10. Chart financial growth decrease vectors Money movement icon. Dollar coin arrows. Financial flow Vector. Market trend symbol.
Free with trial Graph going Up and Down sign with green and red arrows vector set. Flat design vector set of a concept of sales bar chart symbol icon with arrow moving down and sales bar chart with arrow moving up. Chart financial growth decrease vectors Graph going Up and Down sign with green and red arrows vector set. Vector set of a concept of sales bar chart symbol icon. Graph going Up and Down sign with green and red arrows vector set. Flat design vector set of a concept of sales bar chart symbol icon with arrow moving down and sales bar chart with arrow moving up.
Free with trial Up and Down sign with green and red arrows set vector illustration. Set of a Concept of sales bar chart symbol icon with arrow moving down and sales bar chart with arrow moving up. Chart financial growth decrease vectors Up and Down sign with green and red arrows set vector illustration. Set of a Concept of sales bar chart symbol icon with arrows. Up and Down sign with green and red arrows set vector illustration. Set of a Concept of sales bar chart symbol icon with arrow moving down and sales bar chart with arrow moving up.
Free with trial Graph going Up and Down with red arrows vector. Blue chart bar vector illustration concept of sales bar chart symbol icon with arrow moving down and sales bar chart with arrow moving up. Chart financial growth decrease vectors Graph going Up and Down with red arrows vector. Blue chart bar vector illustration concept of sales bar chart symbol icon
Free with trial A 3D rendering of a vibrant red arrow pointing upwards and a bright green arrow pointing downwards, representing market fluctuations, economic changes, and data trends. Chart financial growth decrease illustrations Red up arrow and green down arrow symbolizing financial market trends growth decline. A 3D rendering of a vibrant red arrow pointing upwards and a bright green arrow pointing downwards, representing market fluctuations, economic changes, and data trends
Free with trial Graph going Up and Down with green and red arrows vector. Blue chart bar vector illustration concept of sales bar chart symbol icon with arrow moving down and sales bar chart with arrow moving up. Chart financial growth decrease vectors Graph going Up and Down with green and red arrows vector. Blue chart bar vector illustration concept of sales bar chart symbol. Graph going Up and Down with green and red arrows vector. Blue chart bar vector illustration concept of sales bar chart symbol icon with arrow moving down and sales bar chart with arrow moving up.
Free with trial Line graph up and down icon vector. Outline bar chart with arrow symbol. Analytics concept. Chart financial growth decrease vectors Line graph up and down icon. Outline bar chart with arrow symbol. Analytics concept
Free with trial Downward trend chart with falling interest rates or discounts depicted by price tag. Chart financial growth decrease vectors Downward trend chart with falling interest rates or discounts depicted by price tag
Free with trial A downward trending bar graph in sand symbolizes economic downturn. A dead branch emphasizes decline and crisis. Financial instability concept. Chart financial growth decrease illustrations Declining Business Graph Sand Desert Branch Stock Visual: Financial Crisis Metaphor. A downward trending bar graph in sand symbolizes economic downturn. A dead branch emphasizes decline and crisis. Financial instability concept
Free with trial The pink chart for business concept 3d rendering. Chart financial growth decrease illustrations The pink chart for business concept 3d rendering
Free with trial The pink chart for business concept 3d rendering. Chart financial growth decrease illustrations The pink chart for business concept 3d rendering
Free with trial The pink chart for business concept 3d rendering. Chart financial growth decrease illustrations The pink chart for business concept 3d rendering
Free with trial Contrasting close-up trading chart, the concept of stock price volatility and stock market instability. High quality photo. Chart financial growth decrease illustrations Contrasting close-up trading chart, the concept of stock price volatility and stock market instability
Free with trial This vibrant image showcases a 3D rendering of colorful cylinders arranged on a pink platform, overlaid with a rising line graph symbolizing upward trends and positive growth. Perfect for illustrating business success, financial progress, or marketing presentations. Chart financial growth decrease illustrations Colorful 3D Cylinders and Rising Line Graph on Pink Platform: Business Growth Concept. This vibrant image showcases a 3D rendering of colorful cylinders arranged on a pink platform, overlaid with a rising line graph symbolizing upward trends and positive growth. Perfect for illustrating business success, financial progress, or marketing presentations.
Free with trial 3D Pie chart icon. Circle divided into parts statistical diagram vector illustration. 3D render. Chart financial growth decrease vectors 3D Pie chart icon circle divided into parts statistical diagram vector illustration. 3D render.
Free with trial A 3D bar chart with teal and tan bars shows a pink arrow pointing downwards, representing a decline or negative trend. Clear details and vibrant colors enhance visual appeal. Chart financial growth decrease illustrations 3D Bar Chart With Teal Bars And Pink Downward Arrow Indicating Decline graph decrease. A 3D bar chart with teal and tan bars shows a pink arrow pointing. A 3D bar chart with teal and tan bars shows a pink arrow pointing downwards, representing a decline or negative trend. Clear details and vibrant colors enhance visual appeal
Free with trial Close-up view of a computer monitor displaying a vibrant bar chart, indicating data analysis and progress tracking ,Generative ai. Chart financial growth decrease illustrations Computer monitor displaying a colorful bar chart for data analysis and progress tracking. Close-up view of a computer monitor displaying a vibrant bar chart, indicating data analysis and progress tracking ,Generative ai
Free with trial Illustrated Percentage Sign with Radial Lines for Sales, Discounts, and Financial Concepts. Chart financial growth decrease vectors Illustrated Percentage Sign with Radial Lines for Sales, Discounts, and Financial Concepts
Free with trial A stylized stock market chart showing a downward trend with blue and orange bars on white. Generative AI. Chart financial growth decrease illustrations A stylized stock market chart showing a downward trend with blue and orange bars on white
Free with trial A 3D rendered image of a businessman presenting financial data on a large screen, showing various charts and graphs. Chart financial growth decrease illustrations Businessman Presenting Financial Charts and Graphs. A 3D rendered image of a businessman presenting financial data on a large screen, showing various charts and graphs.
Free with trial Falling red arrow illustrating financial downturn on dark grid drop business decline fall Suitable for digital platforms. Chart financial growth decrease illustrations Falling red arrow illustrating financial downturn on dark grid , drop, business decline, fall. Falling red arrow illustrating financial downturn on dark grid drop business decline fall Suitable for digital platforms
Free with trial Outline bar chart icon vector with upward and downward trend arrow. Uptrend and downtrend business graph symbol in black circle. Chart financial growth decrease vectors Outline bar chart icon with upward and downward trend arrow. Uptrend and downtrend business graph symbol in black circle
Free with trial A 3D bar chart displays a downward trend. The bars are alternating green and pink, decreasing in height from left to right. A bright yellow arrow points downwards, crossing over the bars and emphasizing the decline. The background is a solid, light blue. Chart financial growth decrease illustrations Downward Trending Bar Chart with Yellow Arrow Indicating Decline on Light Blue Background. A 3D bar chart displays a downward trend. The bars are alternating green and pink, decreasing in height from left to right. A bright yellow arrow points downwards, crossing over the bars and emphasizing the decline. The background is a solid, light blue
Free with trial Crystal magic ball and businessman hands with graph up or down inside. Oracle sphere. Investment forecast. Stock exchange volatility. Economy prediction. Financial growth prognosis. Vector concept. Chart financial growth decrease vectors Crystal magic ball and businessman hands with graph up or down inside. Investment forecast. Stock exchange volatility. Economy. Crystal magic ball and businessman hands with graph up or down inside. Oracle sphere. Investment forecast. Stock exchange volatility. Economy prediction. Financial growth prognosis. Vector concept
Free with trial Financial Data Graph With Falling And Rising Lines. Stock Market Volatility. Digital Business. , Generated by AI. Chart financial growth decrease illustrations Financial Data Graph With Falling And Rising Lines. Stock Market Volatility. Digital Business.
Free with trial Image depicts falling market values using coins and a downward arrow. It symbolizes economic downturn and financial instability. Chart financial growth decrease illustrations Economic Downturn: Visual Representation of Decreasing Market Value and Financial Instability. Image depicts falling market values using coins and a downward arrow. It symbolizes economic downturn and financial instability
Free with trial Graph going Up and Down sign with blue arrows vector. Flat design vector illustration concept of sales bar chart symbol icon with arrow moving down and sales bar chart with arrow moving up. Chart financial growth decrease vectors Graph going Up and Down sign with blue arrows vector. Flat design vector illustration concept of sales bar chart symbol icon. Graph going Up and Down sign with blue arrows vector. Flat design vector illustration concept of sales bar chart symbol icon with arrow moving down and sales bar chart with arrow moving up.
Free with trial Percent up and down icon. Percentage upward and downward sign. Growth and decline symbol vector. Chart financial growth decrease vectors Percent up and down icon. Percentage upward and downward sign. Growth and decline symbol
Free with trial A modern smartphone displays a stock market candlestick chart with a downward-trending red arrow indicating a significant loss. Several gold coins with dollar signs are scattered around the phone, and a red bell icon with an exclamation mark hovers above, suggesting an alert or warning. A label on the arrow reads "LOSS. Chart financial growth decrease illustrations Smartphone Displaying Stock Market Chart with Falling Red Arrow and Gold Coins mobile trading. A modern smartphone displays a stock market candlestick chart with a downward-trending red arrow indicating a significant loss. Several gold coins with dollar signs are scattered around the phone, and a red bell icon with an exclamation mark hovers above, suggesting an alert or warning. A label on the arrow reads "LOSS
Free with trial Reduction chart icon vector logo set collection for web app ui. Chart financial growth decrease vectors Reduction chart icon set depicting data reduction symbols, ideal for business analytics and performance visuals. Reduction chart icon vector logo set collection for web app ui
Free with trial A 3D rendered figure slumped over a declining stock market graph representing financial hardship and economic downturn. Chart financial growth decrease illustrations Depressed Figure Examining a Declining Stock Market Graph Financial Crisis Concept. A 3D rendered figure slumped over a declining stock market graph representing financial hardship and economic downturn
Free with trial A 3D rendered figure slumped over a declining stock market graph representing financial hardship and economic downturn. Chart financial growth decrease illustrations Depressed Figure Examining a Declining Stock Market Graph Financial Crisis Concept. A 3D rendered figure slumped over a declining stock market graph representing financial hardship and economic downturn
Free with trial Visualizes indian rupee devaluation with a falling graph over india's map, symbolizing financial crisis and economic downturn. It represents market decline and investment risk, showing currency loss. Chart financial growth decrease illustrations Indian rupee devaluation concept with falling graph and india map for financial crisis analysis. visualizes indian rupee devaluation with a falling graph over india's map, symbolizing financial crisis and economic downturn. It represents market decline and investment risk, showing currency loss.