Free with trial A chrome metallic arrow points diagonally downward, indicating direction. The glossy arrow with a polished reflection represents a symbol for a decline on reports, charts, business or investment losses. The arrow sign is isolated on transparent background and shows a sign of navigation, targeting and analysis. Decrease arrow chart vectors Metallic Downward Arrow Sign on transparent background AI Generated. A chrome metallic arrow points diagonally downward, indicating direction. The glossy arrow with a polished reflection represents a symbol for a decline on reports, charts, business or investment losses. The arrow sign is isolated on transparent background and shows a sign of navigation, targeting and analysis.
Free with trial A stark visual representing a business decline, featuring a silhouetted businessman standing beside a bar graph showing a sharp downward trend indicated by a red arrow. Decrease arrow chart illustrations Business downturn graphic with silhouetted businessman and falling arrow. A stark visual representing a business decline, featuring a silhouetted businessman standing beside a bar graph showing a sharp downward trend indicated by a red arrow
Free with trial Sharp downward sloping line graph red arrow pointing down red decline failure Vector illustration. Decrease arrow chart illustrations Sharp downward sloping line graph, red arrow pointing down, red, decline, failure. Sharp downward sloping line graph red arrow pointing down red decline failure Vector illustration.
Free with trial Simple bar graph showing downward trend with arrow, decline in progress. Decrease arrow chart vectors Simple bar graph showing downward trend with arrow, decline in progress
Free with trial Vector drawing illustration stacked coins and arrow trending down, decreasing statistical graphic concept, drawn in black and white color. Decrease arrow chart vectors Vector drawn illustration black and white icon coins and down arrow trend. vector drawing illustration stacked coins and arrow trending down, decreasing statistical graphic concept, drawn in black and white color
Free with trial A large green upward arrow stands tall, surrounded by multiple red downward arrows, symbolizing contrasting trends of growth and decline. Decrease arrow chart illustrations Green up arrow dominates red down arrows showing growth and decline. A large green upward arrow stands tall, surrounded by multiple red downward arrows, symbolizing contrasting trends of growth and decline
Free with trial Red financial chart with a sharp downward trend indicating a market crash or economic decline. The graph features jagged, descending lines with timestamps labeled on the x-axis as 06 231 and 08 231. The dark background enhances the focus on the bright red line, making the steep drop in value evident. Occasional data points are highlighted with small glowing dots, emphasizing key moments. The overall design conveys a sense of urgency and loss in financial markets. Decrease arrow chart illustrations Dramatic downward trend financial chart illustrating market crash, economic decline, and losses. Red financial chart with a sharp downward trend indicating a market crash or economic decline. The graph features jagged, descending lines with timestamps labeled on the x-axis as 06 231 and 08 231. The dark background enhances the focus on the bright red line, making the steep drop in value evident. Occasional data points are highlighted with small glowing dots, emphasizing key moments. The overall design conveys a sense of urgency and loss in financial markets.
Free with trial Growth vector icon. Graph or diagram with arrow going up and down. Vector illustration. Decrease arrow chart vectors Growth vector icon. Graph or diagram with arrow going up and down. Vector
Free with trial A red downward trending arrow is superimposed over a stack of gold bullion bars. The bars are arranged in a pyramid formation on a white background. The red arrow extends diagonally from the top of the stack towards the bottom right, indicating a decrease or decline. Gold bars symbolize wealth or financial investment, while the arrow suggests a drop in value or market trend. Decrease arrow chart illustrations Red downward trending arrow superimposed over a stack of gold bullion bars on a white background. A red downward trending arrow is superimposed over a stack of gold bullion bars. The bars are arranged in a pyramid formation on a white background. The red arrow extends diagonally from the top of the stack towards the bottom right, indicating a decrease or decline. Gold bars symbolize wealth or financial investment, while the arrow suggests a drop in value or market trend.
Free with trial Up and down arrow line icon. Upward and downward sign symbol vector. Decrease arrow chart vectors Up and down arrow line icon. Upward and downward sign symbol
Free with trial Decrease vector icon on the white background. EPS 10. Decrease arrow chart vectors Decrease thin line vector icon set. Decrease vector icon on the white background. EPS 10
Free with trial Decrease vector icon on the white background. EPS 10. Decrease arrow chart vectors Decrease thin line vector icon set. Decrease vector icon on the white background. EPS 10
Free with trial Graph going Up and Down sign with green and red arrows. graph increase, decrease sign design. Decrease arrow chart vectors Graph going Up and Down sign with green and red arrows. graph increase, decrease sign
Free with trial Decrease vector icon on the white background. EPS 10. Decrease arrow chart vectors Decrease thin line vector icon set. Decrease vector icon on the white background. EPS 10
Free with trial Decrease vector icon on the white background. EPS 10. Decrease arrow chart vectors Decrease thin line vector icon set. Decrease vector icon on the white background. EPS 10
Free with trial Decrease vector icon on the white background. EPS 10. Decrease arrow chart vectors Decrease thin line vector icon set. Decrease vector icon on the white background. EPS 10
Free with trial Decrease vector icon on the white background. EPS 10. Decrease arrow chart vectors Decrease thin line vector icon set. Decrease vector icon on the white background. EPS 10
Free with trial Decrease vector icon on the white background. EPS 10. Decrease arrow chart vectors Decrease thin line vector icon set. Decrease vector icon on the white background. EPS 10
Free with trial Decrease vector icon on the white background. EPS 10. Decrease arrow chart vectors Decrease thin line vector icon set. Decrease vector icon on the white background. EPS 10
Free with trial Decrease vector icon on the white background. EPS 10. Decrease arrow chart vectors Decrease thin line vector icon set. Decrease vector icon on the white background. EPS 10
Free with trial Decrease vector icon on the white background. EPS 10. Decrease arrow chart vectors Decrease thin line vector icon set. Decrease vector icon on the white background. EPS 10
Free with trial Decrease vector icon on the white background. EPS 10. Decrease arrow chart vectors Decrease thin line vector icon set. Decrease vector icon on the white background. EPS 10
Free with trial Decrease vector icon on the white background. EPS 10. Decrease arrow chart vectors Decrease thin line vector icon set. Decrease vector icon on the white background. EPS 10
Free with trial Simple, bold line icon of a platform displaying a dynamic financial market chart with currency trading ups and downs. Decrease arrow chart vectors Platform showing dynamic up and down financial market currency trading chart icon. Simple, bold line icon of a platform displaying a dynamic financial market chart with currency trading ups and downs
Free with trial A 3D rendering depicts a large red arrow pointing sharply downward, superimposed on a bar graph. The graph's bars are alternating gray and white, creating a textured pattern. The graph is positioned against a blurred backdrop of modern city skyscrapers. The overall color palette is cool, with the red arrow providing a stark contrast. The image suggests a negative economic trend or market decline. , generated by AI. Decrease arrow chart illustrations Red Downward Trend Arrow on Gray White Bar Graph Cityscape Background. A 3D rendering depicts a large red arrow pointing sharply downward, superimposed on a bar graph. The graph's bars are alternating gray and white, creating a textured pattern. The graph is positioned against a blurred backdrop of modern city skyscrapers. The overall color palette is cool, with the red arrow providing a stark contrast. The image suggests a negative economic trend or market decline., generated by AI.
Free with trial Vector illustration of decreasing bar graph with arrow, financial concept. Decrease arrow chart vectors Vector illustration of decreasing bar graph with arrow, financial concept
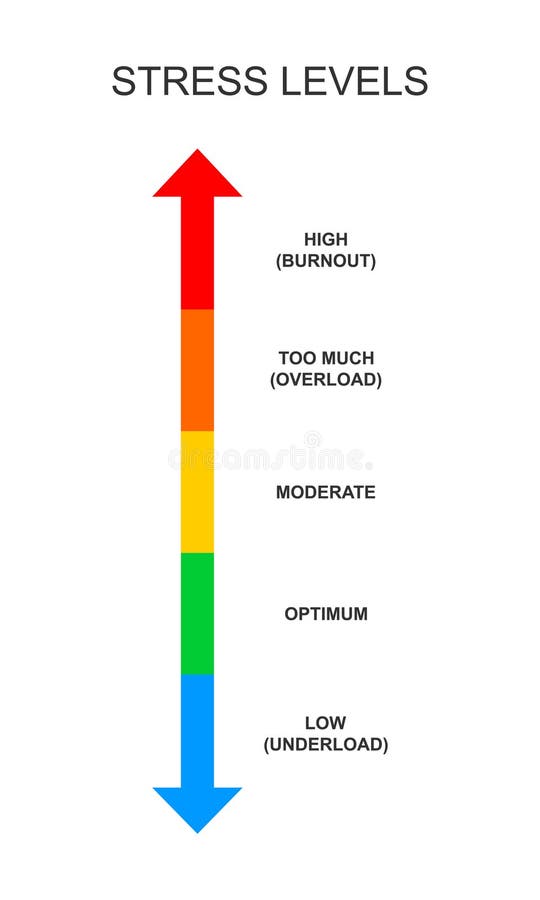
Free with trial Stress meter vertical scale. Mental or emotional pressure levels from underload to burnout. Colorful chart with opposites arrows for overworking, nervous, crisis diagnosis. Vector flat illustration. Decrease arrow chart vectors Stress meter vertical scale. Mental or emotional pressure levels from underload to burnout. Colorful chart with
Free with trial Laptop showing downward stock chart on screen, realistic graphic style, on white office desk background, concept of financial crisis. 3D Rendering. Decrease arrow chart illustrations Laptop displaying falling stock market chart on office desk showing financial crisis and global market crash in business. Laptop showing downward stock chart on screen, realistic graphic style, on white office desk background, concept of financial crisis. 3D Rendering
Free with trial Downward arrow next to analytics dashboard and currency symbol representing financial decline. Ideal for business analytics, finance, investment, economy, budgeting, strategy, simple landing page. Decrease arrow chart vectors Financial Loss Illustrated with Downward Arrow, Analytics Dashboard, and Currency Symbol. Downward arrow next to analytics dashboard and currency symbol. Downward arrow next to analytics dashboard and currency symbol representing financial decline. Ideal for business analytics, finance, investment, economy, budgeting, strategy, simple landing page
Free with trial Growth vector icon. Graph or diagram with arrow going up and down. Vector illustration. Decrease arrow chart vectors Growth vector icon. Graph or diagram with arrow going up and down. Vector
Free with trial Business man with a briefcase walking on an arrow suddenly falling down. Decrease arrow chart vectors Business man with a briefcase walking on an arrow suddenly falling down
Free with trial Growth vector icon. Graph or diagram with arrow going up and down. Vector illustration. Decrease arrow chart vectors Growth vector icon. Graph or diagram with arrow going up and down. Vector
Free with trial Growth vector icon. Graph or diagram with arrow going up and down. Vector illustration. Decrease arrow chart vectors Growth vector icon. Graph or diagram with arrow going up and down. Vector
Free with trial Growth vector icon. Graph or diagram with arrow going up and down. Vector illustration. Decrease arrow chart vectors Growth vector icon. Graph or diagram with arrow going up and down. Vector
Free with trial Growth vector icon. Graph or diagram with arrow going up and down. Vector illustration. Decrease arrow chart vectors Growth vector icon. Graph or diagram with arrow going up and down. Vector
Free with trial Growth vector icon. Graph or diagram with arrow going up and down. Vector illustration. Decrease arrow chart vectors Growth vector icon. Graph or diagram with arrow going up and down. Vector
Free with trial Growth vector icon. Graph or diagram with arrow going up and down. Vector illustration. Decrease arrow chart vectors Growth vector icon. Graph or diagram with arrow going up and down. Vector
Free with trial Growth vector icon. Graph or diagram with arrow going up and down. Vector illustration. Decrease arrow chart vectors Growth vector icon. Graph or diagram with arrow going up and down. Vector
Free with trial Business decline icon with downward arrow. Loss, failure, or economic crisis symbol vector in black circle. Decrease arrow chart vectors Business decline icon with downward arrow. Loss, failure, or economic crisis symbol in black circle
Free with trial Financial arrow up and down icon on circle line. Growth and decline graph sign symbol illustration. Decrease arrow chart vectors Financial arrow up and down icon on circle line. Growth and decline graph sign symbol
Free with trial Illustrating market decline and data analysis with modern visual elements. Decrease arrow chart vectors Red arrow downtrend graph and bar chart in digital and tech theme. Illustrating market decline and data analysis with modern visual elements.
Free with trial Illustrating market decline and data analysis with modern visual elements. Decrease arrow chart vectors Red arrow downtrend graph and bar chart in digital and tech theme. Illustrating market decline and data analysis with modern visual elements.
Free with trial A sharp, red arrow zigzags downwards, indicating a significant decline or negative trend in financial markets or business performance. Decrease arrow chart illustrations Red arrow pointing downwards isolated on white background. A sharp, red arrow zigzags downwards, indicating a significant decline or negative trend in financial markets or business performance
Free with trial Increase decrease editable stroke line icons isolated on white background. Decrease arrow chart vectors Increase decrease editable stroke line icons isolated on white background
Free with trial Simple up and down arrow line icon on black circle. Upward and downward sign symbol vector in rounded corner. Decrease arrow chart vectors Simple up and down arrow line icon on black circle. Upward and downward sign symbol in rounded corner
Free with trial A 3D bar chart with a red line graph indicating a significant decline, isolated on a white background. Decrease arrow chart illustrations Financial bar chart showing downward trend isolated on white background. A 3D bar chart with a red line graph indicating a significant decline, isolated on a white background
Free with trial Up and down arrow icon set on black circle. Upward and downward illustration. Decrease arrow chart vectors Up and down arrow icon set on black circle
Free with trial A solid black downward-pointing arrow is displayed centrally on a white background. A subtle shadow is cast beneath the arrow, giving it a slight sense of depth and separation from the surface. The arrow is a simple, bold graphic element. Decrease arrow chart illustrations Black Downward Arrow with Shadow on White Background direction movement. A solid black downward-pointing arrow is displayed centrally on a white background. A subtle shadow is cast beneath the arrow, giving it a slight sense of depth and separation from the surface. The arrow is a simple, bold graphic element
Free with trial Decrease vector icon on the white background. EPS 10. Decrease arrow chart vectors Decrease thin line vector icon set. Decrease vector icon on the white background. EPS 10
Free with trial Decrease vector icon on the white background. EPS 10. Decrease arrow chart vectors Decrease thin line vector icon set. Decrease vector icon on the white background. EPS 10
Free with trial Euro coin stack with a red arrow going down, illustrating the concept of euro depreciation. Decrease arrow chart illustrations Red arrow going down over euro coins stack illustrating economic crisis. Euro coin stack with a red arrow going down, illustrating the concept of euro depreciation
Free with trial Euro coin stack with a red arrow going down, illustrating the concept of euro depreciation. Decrease arrow chart vectors Red arrow going down over euro coins stack illustrating economic crisis. Euro coin stack with a red arrow going down, illustrating the concept of euro depreciation
Free with trial Recession concept with golden coins stacks and falling red arrow, 3D rendering isolated on white background. Decrease arrow chart illustrations Recession concept with golden coins stacks and falling red arrow, 3D rendering
Free with trial Charts and Diagrams line icons. Interest rate, AI generate, Inflation icons. Report, 3D Chart, Block diagram and Dot Plot graph linear icons. Trend, Pyramid and Pie chart report symbols. Vector. Decrease arrow chart vectors Charts and Diagrams line icons. Set of 3D Chart, Block diagram and Dot Plot graph icons. App line icons. Vector. Charts and Diagrams line icons. Interest rate, AI generate, Inflation icons. Report, 3D Chart, Block diagram and Dot Plot graph linear icons. Trend, Pyramid and Pie chart report symbols. Vector
Free with trial Report line icon. Continuous line with share plane. Column graph, pie chart sign. Market analytics symbol. 3d heart in speech bubble. Report single line ribbon. Loop curve pattern. Vector. Decrease arrow chart vectors Report line icon. Column graph, pie chart sign. Continuous line with plane. Vector. Report line icon. Continuous line with share plane. Column graph, pie chart sign. Market analytics symbol. 3d heart in speech bubble. Report single line ribbon. Loop curve pattern. Vector
Free with trial Red arrow showing downward trend over supermarket shelves with scarce product. Economic crisis and inflation impact on food supply or demand. Decrease arrow chart illustrations Red arrow showing downward trend over supermarket shelves with scarce product
Free with trial Falling fuel prices, reducing the cost of gasoline. Gas station pistol and downward arrow. Concept fuel, diesel fuel, oil production. 3D rendering, copy space. Decrease arrow chart illustrations Falling fuel prices, reducing the cost of gasoline. Gas station pistol and downward arrow. Concept fuel, diesel fuel, oil
Free with trial Falling fuel prices, reducing the cost of gasoline. Gas station pistol and downward arrow. Concept fuel, diesel fuel, oil production. 3D rendering, copy space. Decrease arrow chart illustrations Falling fuel prices, reducing the cost of gasoline. Gas station pistol and downward arrow. Concept fuel, diesel fuel, oil
Free with trial Laptop screen showing downward red stock chart and yellow trend line, with dark abstract background. Concept of market crash and recession. 3D Rendering. Decrease arrow chart illustrations Laptop displaying red and yellow falling stock chart on dark geometric background, symbolizing financial crisis and market. Laptop screen showing downward red stock chart and yellow trend line, with dark abstract background. Concept of market crash and recession. 3D Rendering
Free with trial A bold red arrow trends downwards, symbolizing financial loss or market decline, set against a somber gradient background Perfect for illustrating business failures. Decrease arrow chart illustrations Red Arrow Graph Symbolizing Economic Downturn or Market Crash. A bold red arrow trends downwards, symbolizing financial loss or market decline, set against a somber gradient background Perfect for illustrating business failures
Free with trial A bold red arrow trends downwards, symbolizing financial loss or market decline, set against a somber gradient background Perfect for illustrating business failures. Decrease arrow chart illustrations Red Arrow Graph Symbolizing Economic Downturn or Market Crash. A bold red arrow trends downwards, symbolizing financial loss or market decline, set against a somber gradient background Perfect for illustrating business failures
Free with trial A glossy red arrow depicting a downward trend or decline, isolated on a clean white background. Decrease arrow chart illustrations Red jagged downward trend arrow isolated on white background. A glossy red arrow depicting a downward trend or decline, isolated on a clean white background
Free with trial Percent growth and decline icon in rounded corner. Percentage arrow up and down sign symbol vector. Decrease arrow chart vectors Percent growth and decline icon in rounded corner. Percentage arrow up and down sign symbol
Free with trial Declining Bar Graph with Red Arrow Down and Sad Emoji, Financial Loss Symbol. Decrease arrow chart vectors Declining Bar Graph with Red Arrow Down and Sad Emoji, Financial Loss Symbol
Free with trial Growth and decline. Business chart icon. Profit loss symbol. Vector illustration. EPS 10. Decrease arrow chart vectors Growth and decline. Business chart icon. Profit loss symbol. Vector illustration.
Free with trial A striking red arrow diagonally points downwards, visually representing a significant drop or negative trend. This impactful graphic is perfect for conveying concepts of loss profit or falling stock. Decrease arrow chart illustrations Bold red arrow points downward illustrating decline and negative trends in business white background. A striking red arrow diagonally points downwards, visually representing a significant drop or negative trend. This impactful graphic is perfect for conveying concepts of loss profit or falling stock
Free with trial Percentage sign on the stack of coin bar chart and red graph trending downward with blur wall background on table. Economy recession crisis, inflation, stagflation, business and financial loss concept. Decrease arrow chart illustrations Percentage sign on the stack of coin bar chart and red graph trending downward with blur wall background on table.
Free with trial Hand drawn bar graph shows decreasing trend with downward arrow illustration. Decrease arrow chart vectors Hand drawn bar graph shows decreasing trend with downward arrow illustration
Free with trial Business financial graph showing decreasing trend of profits down with arrow. Decrease arrow chart vectors Business financial graph showing decreasing trend of profits down with arrow
Free with trial A hand-drawn chart illustrates a market decline, demonstrating decreasing financial figures. The graph shows a clear downward trend, indicating potential losses or an economic downturn. Decrease arrow chart illustrations Hand drawn chart displaying market decline and decreasing financial figures. A hand-drawn chart illustrates a market decline, demonstrating decreasing financial figures. The graph shows a clear downward trend, indicating potential losses or an economic downturn
Free with trial Data analysis graphs with up and down arrow line icons set. Increase and reduction of economy or trend charts, price boost, stock market research thin black and red outline symbols vector illustration. Decrease arrow chart vectors Data analysis graphs with up and down arrow, economy or trend charts line icons set. Data analysis graphs with up and down arrow line icons set. Increase and reduction of economy or trend charts, price boost, stock market research thin black and red outline symbols vector illustration
Free with trial Steeply falling graph arrow pointing down dark background sharp decline ruin Ideal for websites and social media. Decrease arrow chart illustrations Steeply falling graph, arrow pointing down, dark background, sharp decline, ruin. Steeply falling graph arrow pointing down dark background sharp decline ruin Ideal for websites and social media
Free with trial Circular buttons labeled "BUY" and "SELL" sit on a surface with a glowing stock market chart in the background. The chart features fluctuating orange lines on a dark grid, illustrating price movements and market volatility. The buttons are shiny and metallic, with embossed text, suggesting a dynamic financial environment. The composition emphasizes themes of trading and investment in the stock market. Decrease arrow chart illustrations Buy and sell buttons with stock market chart in background, financial concept. Circular buttons labeled "BUY" and "SELL" sit on a surface with a glowing stock market chart in the background. The chart features fluctuating orange lines on a dark grid, illustrating price movements and market volatility. The buttons are shiny and metallic, with embossed text, suggesting a dynamic financial environment. The composition emphasizes themes of trading and investment in the stock market.
Free with trial A neon pink stock market chart with a downward trend and candlestick indicators against a dark blue background, symbolizing financial loss and economic downturn. Decrease arrow chart illustrations Neon Pink Stock Market Crash Chart with Candlesticks on Dark Blue Background. A neon pink stock market chart with a downward trend and candlestick indicators against a dark blue background, symbolizing financial loss and economic downturn
Free with trial A series of wooden blocks, each marked with a percentage symbol, form a descending staircase. A bold red arrow dramatically points downwards, symbolizing financial decline. Decrease arrow chart illustrations A red arrow graph shows a sharp decline, indicating a significant drop in percentages. A series of wooden blocks, each marked with a percentage symbol, form a descending staircase. A bold red arrow dramatically points downwards, symbolizing financial decline
Free with trial Calculator with purple screen, upward-trending performance graph, and downward arrow. Ideal for finance, accounting, budgeting, data analysis, cost reduction, investment strategy simple flat. Decrease arrow chart vectors Financial calculation with a calculator, performance graph, and downward arrow for data analysis. Calculator with purple screen, upward-trending performance graph, and downward arrow. Ideal for finance, accounting, budgeting, data analysis, cost reduction, investment strategy simple flat
Free with trial Drawn down arrow trend graph depicting financial decline and economic downturn. Decrease arrow chart vectors Drawn down arrow trend graph depicting financial decline and economic downturn
Free with trial Hand drawn bar graph showing a downward trend with an arrow indicating decline. Decrease arrow chart vectors Hand drawn bar graph showing a downward trend with an arrow indicating decline
Free with trial Icon dollar money decrease or down, inflation currency, finance and economy. Editable file. Decrease arrow chart vectors Icon dollar money decrease or down, inflation currency