Free with trial Young stressed caucasian white bancrupt business woman standing on the background of decreasing chart while asian business woman shows growth graph. Vector cartoon illustration. Horizontal layout. Decrease business chart diagram vectors Young caucasian white bancrupt business woman. Young stressed caucasian white bancrupt business woman standing on the background of decreasing chart while asian business woman shows growth graph. Vector cartoon illustration. Horizontal layout.
Free with trial Grow up chart with heads business and finance uses. Decrease business chart diagram illustrations Grow up chart with heads
Free with trial A clean, minimalist illustration featuring a combined line graph and bar chart on a white background. The line graph, with circular data points, shows an upward trend with fluctuations. It is overlaid on a series of vertical bars, alternating in black and white, representing discrete data values. The grid lines behind the charts suggest a data analysis or financial context. This graphic is ideal for presentations, reports, and websites related to statistics, business growth, market trends, and data visualization. Decrease business chart diagram vectors Line and Bar Chart Combination. A clean, minimalist illustration featuring a combined line graph and bar chart on a white background. The line graph, with circular data points, shows an upward trend with fluctuations. It is overlaid on a series of vertical bars, alternating in black and white, representing discrete data values. The grid lines behind the charts suggest a data analysis or financial context. This graphic is ideal for presentations, reports, and websites related to statistics, business growth, market trends, and data visualization.
Free with trial Set of Business icons, such as Timer, 5g notebook, 3d chart symbols. Mobile screen banners. Consolidation line icons. Stopwatch gadget, Wireless laptop, Presentation column. Strategy. Vector. Decrease business chart diagram vectors Set of Business icons, such as Timer, 5g notebook, 3d chart symbols. Consolidation line icons. Vector. Set of Business icons, such as Timer, 5g notebook, 3d chart symbols. Mobile screen banners. Consolidation line icons. Stopwatch gadget, Wireless laptop, Presentation column. Strategy. Vector
Free with trial Abstract Graph Decrease Icon Set, vector editable design, can be used for business or presentation design. Decrease business chart diagram vectors Abstract Graph Decrease Icon Set
Free with trial Broker trader analyzing economic crisis. Trade exchange, financial decrease, bed business strategy, digital asset, loss investment fund, online broker, stock collapse and crisis concept. Decrease business chart diagram illustrations Broker trader analyzing economic crisis. Trade exchange, financial decrease
Free with trial A clean, minimalist vector illustration of a bar chart featuring three distinct columns. The columns are colored in vibrant orange, teal, and yellow, representing different data points or categories. The chart is set against a white background with a dark blue axis line, making it ideal for presentations, reports, and infographics focused on data visualization, business growth, or financial analysis. Decrease business chart diagram vectors Simple Bar Chart with Three Columns. A clean, minimalist vector illustration of a bar chart featuring three distinct columns. The columns are colored in vibrant orange, teal, and yellow, representing different data points or categories. The chart is set against a white background with a dark blue axis line, making it ideal for presentations, reports, and infographics focused on data visualization, business growth, or financial analysis.
Free with trial Infographic design template. Vector flat line infographic elements. Downward blue arrow and icons depict recession business. Vector illustration of decrease arrow and business icon set. Decrease business chart diagram vectors Recession Business Infographic Concept. Infographic design template. Vector flat line infographic elements. Downward blue arrow and icons depict recession business. Vector illustration of decrease arrow and business icon set
Free with trial Multicolor glossy bar chart showing decrease, with euro sign on Y axis, standing on gray background, front view. Decrease business chart diagram illustrations Bar chart with euro. Multicolor glossy bar chart showing decrease, with euro sign on Y axis, standing on gray background, front view
Free with trial Set of four vector illustrations with businessman standing in front of chart for business presentation isolated on grey background. Decrease business chart diagram vectors Business Presentation Cartoon Vector Illustration. Set of four vector illustrations with businessman standing in front of chart for business presentation isolated on grey background
Free with trial Multicolor glossy bar chart showing decrease, with dollar sign on Y axis, standing on gray background, front view. Decrease business chart diagram illustrations Bar chart with dollar. Multicolor glossy bar chart showing decrease, with dollar sign on Y axis, standing on gray background, front view
Free with trial A set of vector icons illustrating business process flow and funnel diagrams. The icons depict various stages of a process, including input, output, increase, decrease, equality, and filtration. These graphics can be used to represent sales funnels, customer journeys, or any other type of process flow in a business or marketing context. Decrease business chart diagram illustrations Business process flow funnel diagram icons. A set of vector icons illustrating business process flow and funnel diagrams. The icons depict various stages of a process, including input, output, increase, decrease, equality, and filtration. These graphics can be used to represent sales funnels, customer journeys, or any other type of process flow in a business or marketing context.
Free with trial Set of vector chart and graph icons for infographic. Thin line diagrams for business report or presentation. Decrease business chart diagram vectors Set of vector chart. Set of vector chart and graph icons for infographic. Thin line diagrams for business report or presentation.
Free with trial Accounting checklist, Payment methods and Growth chart icons simple set. Comparison table. Calendar graph sign. Calculator, Credit card, Sale diagram. Annual report. Finance set. Pricing plan. Vector. Decrease business chart diagram vectors Accounting checklist, Payment methods and Growth chart icons set. Calendar graph sign. Vector. Accounting checklist, Payment methods and Growth chart icons simple set. Comparison table. Calendar graph sign. Calculator, Credit card, Sale diagram. Annual report. Finance set. Pricing plan. Vector
Free with trial A set of three distinct candlestick chart icons, rendered in a clean, flat vector style against a white background. The green candle typically represents a bullish trend or price increase, the red candle signifies a bearish trend or price decrease, and the gray candle can denote neutrality or indecision in the market. These versatile symbols are ideal for illustrating financial concepts, stock market analysis, trading platforms, investment apps, economic reports, and educational materials related to forex, cryptocurrency, and general business trends. Decrease business chart diagram vectors Candlestick Chart Icons for Financial Analysis. A set of three distinct candlestick chart icons, rendered in a clean, flat vector style against a white background. The green candle typically represents a bullish trend or price increase, the red candle signifies a bearish trend or price decrease, and the gray candle can denote neutrality or indecision in the market. These versatile symbols are ideal for illustrating financial concepts, stock market analysis, trading platforms, investment apps, economic reports, and educational materials related to forex, cryptocurrency, and general business trends.
Free with trial A 3D rendered image displays a collection of business charts on a document. A colorful pie chart with six segments sits to the left of a bar graph with five vertical bars of varying heights and colors. A line graph with multiple colored lines is visible on the document below. The composition is set against a white background. Decrease business chart diagram illustrations 3D Rendered Pie Chart Bar Graph and Line Graph on a Document data statistics. A 3D rendered image displays a collection of business charts on a document. A colorful pie chart with six segments sits to the left of a bar graph with five vertical bars of varying heights and colors. A line graph with multiple colored lines is visible on the document below. The composition is set against a white background
Free with trial This graphic depicts a simple bar chart with two vertical bars. The left bar, colored blue, is shorter and labeled 'QUALITY' with an upward-pointing arrow, suggesting an increase. The right bar, colored green, is taller and labeled 'COST' with downward-pointing arrows, indicating a decrease. A diagonal arrow connects the top of the quality bar to the bottom of the cost bar, visually representing. Decrease business chart diagram vectors Bar chart illustrating the inverse relationship between quality and cost. This graphic depicts a simple bar chart with two vertical bars. The left bar, colored blue, is shorter and labeled 'QUALITY' with an upward-pointing arrow, suggesting an increase. The right bar, colored green, is taller and labeled 'COST' with downward-pointing arrows, indicating a decrease. A diagonal arrow connects the top of the quality bar to the bottom of the cost bar, visually representing
Free with trial Descending analytic graph showing loss and business downfall. data analytics descendant icon on white background. loss bar chart logo concept. flat style. chart with bars declining icon for your web site design, logo, app, UI. Decrease business chart diagram illustrations Descending analytic graph showing loss and business downfall. da
Free with trial Finance data analytics, decrease graph line icon. Business research report analysis, finance performance analytics or company statistic outline vector icon column infographics and pointing down arrow. Decrease business chart diagram illustrations Finance data analytics, decrease graph line icon
Free with trial A stock market crash illustration with red arrows pointing down indicating financial loss and economic downturn. a visual representation of recession and business failure on a blue grid 200. Decrease business chart diagram illustrations Stock market crash recession financial crisis chart falling down economic downturn graph business loss 100. a stock market crash illustration with red arrows pointing down indicating financial loss and economic downturn. a visual representation of recession and business failure on a blue grid 200
Free with trial A three-dimensional bar chart constructed from shiny golden bars depicts a clear downward trend. The bars decrease in height from left to right, creating a visual representation of decline or loss. The metallic gold material reflects light, giving the chart a polished and impactful appearance. The entire graphic is isolated on a clean white background, making the data visualization the sole focus. Decrease business chart diagram illustrations Golden 3D bar chart showing a downward trend on a white background graph data. A three-dimensional bar chart constructed from shiny golden bars depicts a clear downward trend. The bars decrease in height from left to right, creating a visual representation of decline or loss. The metallic gold material reflects light, giving the chart a polished and impactful appearance. The entire graphic is isolated on a clean white background, making the data visualization the sole focus
Free with trial Hand points at stock chart data on a bright screen, suggesting market analysis This visual is ideal for financial business content. Decrease business chart diagram illustrations Analyzing Stock Market Data on Screen with Hand Pointing to Chart. Hand points at stock chart data on a bright screen, suggesting market analysis This visual is ideal for financial business content
Free with trial Abstract 3D render of a colorful descending bar chart with cubes. Perfect for data visualization, business presentations, or illustrating trends. Representing financial, statistical or marketing information. Decrease business chart diagram illustrations Colorful 3D Bar Chart, Data Visualization Concept. Abstract 3D render of a colorful descending bar chart with cubes. Perfect for data visualization, business presentations, or illustrating trends. Representing financial, statistical or marketing information.
Free with trial Hand drawing a yellow downward trend chart on a black chalkboard depicting financial decline economic downturn or business losses. Illustrating concept of falling sales and decreasing profits. Decrease business chart diagram illustrations Hand Drawn Yellow Downward Trend Chart on Black Chalkboard Depicting Financial Decline. Hand drawing a yellow downward trend chart on a black chalkboard depicting financial decline economic downturn or business losses. Illustrating concept of falling sales and decreasing profits
Free with trial A collection of six black depicting various business analytics charts and graphs, including bar charts, a pie chart, and line graphs on presentation boards. Decrease business chart diagram vectors Black analytics chart and graph on white background. A collection of six black depicting various business analytics charts and graphs, including bar charts, a pie chart, and line graphs on presentation boards
Free with trial Decline, growth, success, recession business flat concept illustration. Graphs depict increase and decrease business. Vector template element for infographic, web, presentation, social networks. Decrease business chart diagram vectors Recession, decline, growth, increase, success business arrows. F. Decline, growth, success, recession business flat concept illustration. Graphs depict increase and decrease business. Vector template element for infographic, web, presentation, social networks.
Free with trial A grid of diverse icons representing different types of charts and graphs, including bar, line, and pie charts, symbolizing data analysis and business performance metrics. Decrease business chart diagram vectors Collection of various business and financial chart icons. A grid of diverse icons representing different types of charts and graphs, including bar, line, and pie charts, symbolizing data analysis and business performance metrics
Free with trial 3D rendered pyramid chart with a pie chart overlay and data icons on a light background. Useful for infographics and business presentations. Decrease business chart diagram illustrations 3d pyramid infographic with pie chart and data icons. 3D rendered pyramid chart with a pie chart overlay and data icons on a light background. Useful for. 3D rendered pyramid chart with a pie chart overlay and data icons on a light background. Useful for infographics and business presentations
Free with trial A flat style pie chart displays market shares in teal, green, and yellow, with a dollar coin icon representing financial data. Decrease business chart diagram vectors Flat design pie chart illustration representing business finance and market share analysis. A flat style pie chart displays market shares in teal, green, and yellow, with a dollar coin icon representing financial data.
Free with trial A minimalist 3D rendered white graph depicting a sharp downward trend with jagged peaks and valleys. The graph is isolated on a white background, casting a subtle shadow. The visual represents a decline or decrease, suitable for concepts related to finance, economics, or data analysis. Decrease business chart diagram illustrations White 3D Jagged Line Graph Showing Decline Isolated on White Background chart decrease. A minimalist 3D rendered white graph depicting a sharp downward trend with jagged peaks and valleys. The graph is isolated on a white background, casting a subtle shadow. The visual represents a decline or decrease, suitable for concepts related to finance, economics, or data analysis
Free with trial Stock and economic crisis graph background. Trade exchange, financial decrease, bed business strategy, digital asset, loss investment fund, online broker, stock collapse and crisis concept. Decrease business chart diagram illustrations Stock and economic crisis graph background. Trade exchange, financial decrease
Free with trial Three oil barrels are surrounded with COVID-19 and world economic suffers from recession with chart on blue background. Diagram that shows fall in oil prices because of coronavirus. Decrease business chart diagram vectors Oil price chart fall is caused by COVID-19. Three oil barrels are surrounded with COVID-19 and world economic suffers from recession with chart on blue background. Diagram that shows fall in oil prices because of coronavirus.
Free with trial Economic crisis line icon of freight traffic decrease and commercial economy downturn, vector symbol. Logistics business recession icon of freight truck, parcels and arrow down for financial crisis. Decrease business chart diagram vectors Economic crisis line icon freight traffic decrease. Economic crisis line icon of freight traffic decrease and commercial economy downturn, vector symbol. Logistics business recession icon of freight truck, parcels and arrow down for financial crisis
Free with trial This image shows two pie charts, representing data segments and fractions. Perfect for business presentations, reports, and statistical analysis. Clean and simple. Decrease business chart diagram vectors Vector art of pie chart showing data segments isolated on white background for business analysis and presentation. This image shows two pie charts, representing data segments and fractions. Perfect for business presentations, reports, and statistical analysis. Clean and simple
Free with trial A comprehensive set of financial and data visualization icons, perfect for illustrating business and economic concepts. This collection includes a growing bar chart with an upward trend, a declining bar chart with a downward trend, and a mixed bar chart. Also featured are stacks of global currencies (USD, Euro, INR), a segmented pie chart, and a world map colored green and red to signify global market conditions or data distribution. Ideal for presentations, reports, websites, and educational materials related to economics, finance, and market analysis. Decrease business chart diagram vectors Global Financial and Business Data Visualization Icons Set. A comprehensive set of financial and data visualization icons, perfect for illustrating business and economic concepts. This collection includes a growing bar chart with an upward trend, a declining bar chart with a downward trend, and a mixed bar chart. Also featured are stacks of global currencies (USD, Euro, INR), a segmented pie chart, and a world map colored green and red to signify global market conditions or data distribution. Ideal for presentations, reports, websites, and educational materials related to economics, finance, and market analysis.
Free with trial A close-up shot of a hand holding white chalk, drawing a bar chart with a clear downward trend on a dark green chalkboard. The chart features bars progressively decreasing in height from left to right, visually representing a decline. A large, prominent arrow drawn in chalk points diagonally downwards across the graph, powerfully emphasizing concepts of recession, loss, negative growth, or a falling market. This image is ideal for illustrating financial downturns, business challenges, economic crisis, or any concept of decreasing performance and negative statistics. Decrease business chart diagram illustrations Downward Trend Bar Chart with Chalk and Hand on Chalkboard. A close-up shot of a hand holding white chalk, drawing a bar chart with a clear downward trend on a dark green chalkboard. The chart features bars progressively decreasing in height from left to right, visually representing a decline. A large, prominent arrow drawn in chalk points diagonally downwards across the graph, powerfully emphasizing concepts of recession, loss, negative growth, or a falling market. This image is ideal for illustrating financial downturns, business challenges, economic crisis, or any concept of decreasing performance and negative statistics.
Free with trial Multicolor glossy bar chart showing decrease, with yuan sign on Y axis, standing on gray background, front view. Decrease business chart diagram illustrations Bar chart with yuan. Multicolor glossy bar chart showing decrease, with yuan sign on Y axis, standing on gray background, front view
Free with trial A simple line drawing depicts a person presenting a declining bar chart on a whiteboard, viewed through a magnifying. Decrease business chart diagram illustrations Decline Analysis Magnifying Glass on Falling Chart, Business. A simple line drawing depicts a person presenting a declining bar chart on a whiteboard, viewed through a magnifying.
Free with trial Decreasing unproductive business statistic bar chart isolated isometric 3d vector illustration on white background. Decrease business chart diagram vectors Decreasing bar chart Isometric 3D vector illustration. Decreasing unproductive business statistic bar chart isolated isometric 3d vector illustration on white background
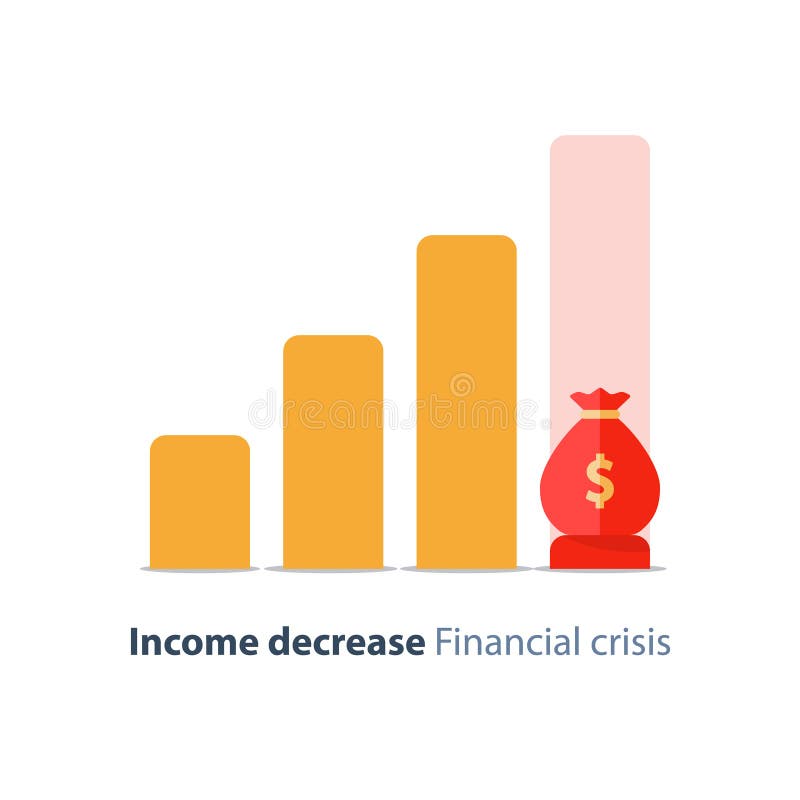
Free with trial Income decrease graph, financial crisis rate, revenue decline chart, economy downturn, investment risk, fund management, budget deficit, vector illustration, flat icon. Decrease business chart diagram vectors Budget deficit, income decrease, economy decline, financial crisis, investment risk. Income decrease graph, financial crisis rate, revenue decline chart, economy downturn, investment risk, fund management, budget deficit, vector illustration, flat icon
Free with trial Set of black and white icons illustrating various business analytics and data concepts including downward trend charts, funnel, report, magnifying glass, computer display, and focused chart with arrows. Generative AI. Decrease business chart diagram vectors Black and white business analytics and data icons set with charts and graphs. Set of black and white icons illustrating various business analytics and data concepts including downward trend charts, funnel, report, magnifying glass, computer display, and focused chart with arrows. Generative AI
Free with trial Collection of simple black vector icons representing financial charts, data analysis graphs, and business statistics. Includes trend arrows, magnifier, and settings symbols. Decrease business chart diagram illustrations Set of black business graph and chart icons for data analysis. Collection of simple black vector icons representing financial charts, data analysis graphs, and business statistics. Includes trend arrows, magnifier, and settings symbols
Free with trial Colorful 3D pie chart render with segments in green, orange, yellow against soft green background. Minimalist design highlights data visualization concept. Useful for business reports. Decrease business chart diagram illustrations Colorful 3D pie chart render with segments in green, orange, yellow against soft green background. Minimalist design highlights
Free with trial Collection of colorful and modern chart and graph icons for business presentations reports and web applications Illustrates various data visualization methods and analytics Perfect for illustrating business success and data trends. Generative AI. Decrease business chart diagram illustrations Colorful Data Charts Graphs Icons Business Infographic Elements. Collection of colorful and modern chart and graph icons for business presentations reports and web applications Illustrates various data visualization methods and analytics Perfect for illustrating business success and data trends. Generative AI
Free with trial 3D silver column chart depicting a decreasing sequence of bars from left to right. Each bar is rectangular and has a metallic finish, giving a sleek and reflective appearance. The chart suggests a downward trend, possibly illustrating declining values or losses. The bars are evenly spaced on a flat surface with no additional labels or axes visible. Suitable for representing financial data or general decrease in values. Decrease business chart diagram vectors Silver 3D column chart or bar chart showing decreasing financial values and losses. 3D silver column chart depicting a decreasing sequence of bars from left to right. Each bar is rectangular and has a metallic finish, giving a sleek and reflective appearance. The chart suggests a downward trend, possibly illustrating declining values or losses. The bars are evenly spaced on a flat surface with no additional labels or axes visible. Suitable for representing financial data or general decrease in values.
Free with trial A 3D bar chart displays a downward trend, with bars decreasing in height from left to right. A red arrow follows the trend, pointing downwards. The chart is placed on a reflective glass table, casting a clear reflection. Sunlight casts diagonal shadows on a plain white wall in the background. The overall composition suggests a financial or business decline. Decrease business chart diagram illustrations Downward Trend Bar Chart with Red Arrow on Glass Table graph data. A 3D bar chart displays a downward trend, with bars decreasing in height from left to right. A red arrow follows the trend, pointing downwards. The chart is placed on a reflective glass table, casting a clear reflection. Sunlight casts diagonal shadows on a plain white wall in the background. The overall composition suggests a financial or business decline
Free with trial Colorful bar chart visualizing business data, financial growth, and market analysis with a retro aesthetic. Decrease business chart diagram illustrations Colorful geometric bar chart displaying data visualization progress. Colorful bar chart visualizing business data, financial growth, and market analysis with a retro aesthetic
Free with trial An isometric bar chart illustrating a negative financial trend with a downward red arrow, isolated on a white background, representing economic decline and business challenges. Decrease business chart diagram illustrations Bar chart with downward trending arrow isolated on white background. An isometric bar chart illustrating a negative financial trend with a downward red arrow, isolated on a white background, representing economic decline and business challenges
Free with trial Business finance crisis concept. stack pile coins and money bag icon. arrow decrease economy stretching rising drop. lost bankrupt declining. cost reduction. loss of income. vector illustration. Decrease business chart diagram vectors Business finance crisis concept. stack pile coins and money bag icon. arrow decrease economy stretching rising drop. lost bankrupt
Free with trial Income decrease graph, financial crisis rate, revenue decline chart, economy downturn, investment risk, fund management, budget deficit, vector illustration, flat icon. Decrease business chart diagram vectors Budget deficit, income decrease, economy decline, financial crisis, investment risk. Income decrease graph, financial crisis rate, revenue decline chart, economy downturn, investment risk, fund management, budget deficit, vector illustration, flat icon
Free with trial A red graph with arrows illustrating decrease and increase, representing data analysis and performance evaluation in business. Suitable for reports and presentations. Decrease business chart diagram vectors Vector art of red graph with arrow, illustrating decrease and increase, representing data analysis and performance evaluation in. A red graph with arrows illustrating decrease and increase, representing data analysis and performance evaluation in business. Suitable for reports and presentations
Free with trial Red arrow pointing downwards financial chart. Economic recession. Financial crisis, stock market crash. Losses, decline, decrease, financial risk. Graph shows falling sales revenue. Decrease business chart diagram illustrations Red arrow pointing downwards financial chart. Economic recession. Financial crisis, stock market crash. Losses, decline
Free with trial Financial graph with candlestick chart and world map on a light background. Concept of global business and finance. 3D Rendering. Decrease business chart diagram illustrations Financial graph with candlestick chart and world map on light background. 3D Rendering. Financial graph with candlestick chart and world map on a light background. Concept of global business and finance. 3D Rendering
Free with trial This is a 3D rendering of a bar chart depicting a decrease in data. The bars are colored red, blue, and yellow on a transparent backdrop. Decrease business chart diagram vectors Minimalist chart bars showing decrease trend on transparent background. This is a 3D rendering of a bar chart depicting a decrease in data. The bars are colored red, blue, and yellow on a transparent backdrop.
Free with trial Declining graph flat icon, business and finance, chart sign vector graphics, a colorful solid pattern on a white background, eps 10. Decrease business chart diagram vectors Declining graph flat icon, business and finance
Free with trial A black bar chart icon with bars of decreasing height and a downward arrow indicating a decline. Decrease business chart diagram illustrations Black Bar Chart Icon Showing Decline With Downward Arrow graph decrease. A black bar chart icon with bars of decreasing height and a downward arrow indicating a decline
Free with trial Partnership, Project edit and 3d chart line icons set. Timeline process infograph. Idea sign. Business startup, Settings, Presentation column. Light bulb. Science set. Vector. Decrease business chart diagram vectors Partnership, Project edit and 3d chart icons set. Idea sign. Business startup, Settings, Presentation column. Vector. Partnership, Project edit and 3d chart line icons set. Timeline process infograph. Idea sign. Business startup, Settings, Presentation column. Light bulb. Science set. Vector
Free with trial Line chart with bars and a red arrow going downwards to signify a financial decrease. Decrease business chart diagram vectors Declining stock market chart with red arrow indicating loss, economy crisis. Line chart with bars and a red arrow going downwards to signify a financial decrease.
Free with trial Multicolor glossy bar chart showing decrease, with red arrow and two black axis, standing on gray background. Decrease business chart diagram illustrations Bar chart with axis. Multicolor glossy bar chart showing decrease, with red arrow and two black axis, standing on gray background
Free with trial Bar chart with downward trending arrow, representing loss, decrease, or recession. Decrease business chart diagram vectors Bar chart with downward trending arrow, representing loss, decrease, or recession
Free with trial A dramatic red stock market chart showing a significant downturn. it illustrates a financial crisis, economic recession, or a major market crash. a visual representation of loss and investment risk. Decrease business chart diagram illustrations Stock market crash financial crisis economic recession downtrend chart red graph business loss investment. a dramatic red stock market chart showing a significant downturn. it illustrates a financial crisis, economic recession, or a major market crash. a visual representation of loss and investment risk.
Free with trial 3D pie chart illustrating data segments with percentage values, alongside a bar graph in the background, showcasing financial or business data. Decrease business chart diagram illustrations 3D pie chart illustrating data segments with percentage values, alongside a bar graph in the background, showcasing financial or
Free with trial Three dimensional red bar chart graphic illustrating a continuous downward trend in business statistics or performance indicators. Decrease business chart diagram vectors Three dimensional red bar chart showing decreasing metrics on white background. Three dimensional red bar chart graphic illustrating a continuous downward trend in business statistics or performance indicators.
Free with trial Money FInance Chart for business. Decrease business chart diagram illustrations Money Finance Chart
Free with trial Multicolor glossy bar chart of yuans showing decrease, standing on gray background. Decrease business chart diagram illustrations Bar chart of yuans
Free with trial Analyze the crash in the stock market crash. Learn from investment failure mistakes. Assess the damage from the business sector. Experts find the cause of the stock chart fall. Decrease business chart diagram vectors Analyze the crash in the stock market crash. Learn from investment failure mistakes. Assess the damage from the business
Free with trial Business finance crisis concept. money fall down symbol. arrow decrease economy stretching rising drop. lost crisis bankrupt declining. cost reduction. loss of income. vector illustration. Decrease business chart diagram vectors Business finance crisis concept. money fall down symbol. arrow decrease economy stretching rising drop. lost crisis bankrupt decli
Free with trial Visualize cost reduction with a downward trending graph held in a hand. Illustrates finance, business strategy, and expense management. Shows efficiency and financial planning concepts. Decrease business chart diagram illustrations Cost reduction strategy business finance graph chart decreasing costs expense management efficiency concept. Visualize cost reduction with a downward trending graph held in a hand. Illustrates finance, business strategy, and expense management. Shows efficiency and financial planning concepts.
Free with trial Multicolor glossy bar chart of ruble signs showing decrease, standing on gray background. Decrease business chart diagram illustrations Bar chart of rubles. Multicolor glossy bar chart of ruble signs showing decrease, standing on gray background
Free with trial Multicolor glossy bar chart of euro signs showing decrease, standing on gray background. Decrease business chart diagram illustrations Bar chart of euros. Multicolor glossy bar chart of euro signs showing decrease, standing on gray background
Free with trial Multicolor glossy bar chart showing decrease, with ruble sign on Y axis, standing on gray background, front view. Decrease business chart diagram illustrations Bar chart with ruble. Multicolor glossy bar chart showing decrease, with ruble sign on Y axis, standing on gray background, front view
Free with trial A monochrome illustration depicts a man in a suit sitting at a desk with his head in his hands, appearing stressed. A chart on the desk titled "Monthly Revenue" displays a downward trend in bar graph format. Crumpled papers are scattered on the floor, and a mug rests on the desk. The scene communicates a sense of financial or business-related stress. Decrease business chart diagram vectors Stressed Businessman at Desk with Declining Monthly Revenue Chart and Financial Loss. A monochrome illustration depicts a man in a suit sitting at a desk with his head in his hands, appearing stressed. A chart on the desk titled "Monthly Revenue" displays a downward trend in bar graph format. Crumpled papers are scattered on the floor, and a mug rests on the desk. The scene communicates a sense of financial or business-related stress.
Free with trial Multicolor glossy bar chart of dollar signs showing decrease, standing on gray background. Decrease business chart diagram illustrations Bar chart of dollars. Multicolor glossy bar chart of dollar signs showing decrease, standing on gray background
Free with trial This image shows a sharp red arrow pointing downward across a financial style chart, suggesting a rapid drop in performance or a sudden shift in economic conditions. The arrow cuts through the center of the layout, drawing attention to the idea of instability or pressure within a financial setting. Behind the chart is a muted city skyline that adds context by hinting at broader urban or corporate environments affected by the decline. The word critical appears at the bottom in bold letters, reinforcing the seriousness of the situation being represented. The combination of the arrow, chart, and city outline creates a clear message about financial stress, market volatility, or urgent business challenges. The overall composition is direct and functional, making it suitable for use in presentations, reports, or articles that discuss downturns, risk exposure, or sudden changes in economic performance. The image can support topics such as market corrections, operational strain, or external events that influence financial outcomes. Its straightforward design helps viewers quickly understand the theme without unnecessary detail. Decrease business chart diagram illustrations Red crisis arrow over falling financial chart with critical text and city backdrop. This image shows a sharp red arrow pointing downward across a financial style chart, suggesting a rapid drop in performance or a sudden shift in economic conditions. The arrow cuts through the center of the layout, drawing attention to the idea of instability or pressure within a financial setting. Behind the chart is a muted city skyline that adds context by hinting at broader urban or corporate environments affected by the decline. The word critical appears at the bottom in bold letters, reinforcing the seriousness of the situation being represented. The combination of the arrow, chart, and city outline creates a clear message about financial stress, market volatility, or urgent business challenges. The overall composition is direct and functional, making it suitable for use in presentations, reports, or articles that discuss downturns, risk exposure, or sudden changes in economic performance. The image can support topics such as market corrections, operational strain, or external events that influence financial outcomes. Its straightforward design helps viewers quickly understand the theme without unnecessary detail.
Free with trial Line art illustration of a financial chart depicting a decrease in money for economic reports. Decrease business chart diagram vectors Line art illustration of a financial chart depicting a decrease in money for economic reports
Free with trial Simple graphic illustration of a bar chart depicting a downward trend for business and finance. Decrease business chart diagram vectors Simple graphic illustration of a bar chart depicting a downward trend for business and finance
Free with trial Set of vector chart and graph icons for infographic. Thin line diagrams for business report or presentation. Decrease business chart diagram vectors Set of vector chart
Free with trial Decreasing Bar Chart with Arrow: Business Decline, Negative Trend, Financial Loss and Downturn. Decrease business chart diagram vectors Decreasing Bar Chart with Arrow: Business Decline, Negative Trend, Financial Loss and Downturn