Free with trial Indian Rupee crisis concept, Golden Indian Rupee Symbol Down to Ground. isolated on white background. 3D rendering. Decrease business concept illustrations Indian Rupee crisis concept, Golden Indian Rupee Symbol Down to Ground
Free with trial Business concept vector illustration of businessman falling down on arrow graphic, business failure, crisis concept. Decrease business concept vectors Businessman falling down from arrow graphic. Business concept vector illustration of businessman falling down on arrow graphic, business failure, crisis concept
Free with trial Doge coin decrease exchange value digital virtual price down chart red vector. Decrease business concept vectors Doge coin decrease exchange value digital virtual price down chart red
Free with trial Footwear barefoot man metaphor economic financial crisis business ruin. Color vector illustration EPS8. Decrease business concept vectors Footwear barefoot man metaphor economic financial crisis business ruin
Free with trial Bankrupt. Cost reduction and crisis financial. Business and finances concepts. A businessman is cutting expenses. Piggy bank with tighten belt. Decrease business concept vectors Business and finances concepts. Cost reduction and crisis financial. Bankrupt. Bankrupt. Cost reduction and crisis financial. Business and finances concepts. A businessman is cutting expenses. Piggy bank with tighten belt
Free with trial Businessman falling into hole vector concept. Symbol of debt, bankruptcy, financial crisis. Loss of job, unemployment, hopeless situation and depression. Eps10 illustration. Decrease business concept vectors Businessman falling into hole vector concept. Symbol of debt, bankruptcy, financial crisis.
Free with trial Reduction of carbon emissions, climate action concept. Renewable and clean energy. Net zero greenhouse gas emissions target. Reducing carbon footprint. Businessman holding circle of carbon reduction. Decrease business concept illustrations Reduction of carbon emissions, climate action concept. Renewable and clean energy.
Free with trial Retired Golden parachute financial compensation in the business. Comic book vintage pop art retro style illustration vector. Decrease business concept vectors Retired Golden parachute financial compensation in the business
Free with trial Ripple coin decrease exchange value digital virtual price down chart red vector. Decrease business concept vectors Ripple coin decrease exchange value digital virtual price down chart red
Free with trial Monero coin decrease exchange value digital virtual price down chart red vector. Decrease business concept vectors Monero coin decrease exchange value digital virtual price down chart red
Free with trial Bull and bear economy concept with 3d rendering bull and bear on stock market chart background. Decrease business concept illustrations Bull and bear economy concept with bull and bear on stock market chart background
Free with trial Cartoon stick man conceptual illustration of business man businessman walking carefully on graph chart line. Decrease business concept vectors Cartoon Illustration of Business Man Walking Carefully on Graph. Cartoon stick man conceptual illustration of business man businessman walking carefully on graph chart line.
Free with trial Cost reduction icon. Image isolated on white background. Vector illustration. Costs cut and financial optimization business concept. Descending arrow with dollar symbol. Business budget investments. Decrease business concept illustrations Cost reduction icon. Image isolated on white background. Vector
Free with trial Concept of stock market bearish or business metaphor, graphic of bear chess piece with stock market element. Decrease business concept vectors BearChess. Concept of stock market bearish or business metaphor, graphic of bear chess piece with stock market element
Free with trial Business recession diagram with falling bars and downward arrow indicating economic decline and bankruptcy. Decrease business concept vectors Economic crisis concept illustration with negative trend graph and bankruptcy symbol. Business recession diagram with falling bars and downward arrow indicating. Business recession diagram with falling bars and downward arrow indicating economic decline and bankruptcy
Free with trial Digital illustration of business arrow in colour background. Decrease business concept illustrations Business arrow
Free with trial Dollar Down icon. Value decrease symbol. Currency fall concept. Decrease business concept vectors Dollar Down icon. Value decrease symbol
Free with trial Inflation concept of hamburger. Vector illustration. Decrease business concept vectors Inflation concept of hamburger
Free with trial Falling down business red chart. Vector illustration of fail, risk or recession problem. Decrease business concept vectors Falling down business red chart.
Free with trial Origami paper green growth finance arrow business stock market concept. Decrease business concept vectors Origami paper green growth finance arrow
Free with trial Cartoon stick man conceptual illustration of smiling business man businessman walking on graph chart line expecting great future and ignoring the near fall. Decrease business concept vectors Cartoon Illustration of Business Man Walking on Graph. Cartoon stick man conceptual illustration of smiling business man businessman walking on graph chart line expecting great future and ignoring the near fall.
Free with trial Storjoin coin storj decrease exchange value digital virtual price down chart red vector. Decrease business concept vectors Storjoin coin storj decrease exchange value digital virtual price down chart red
Free with trial Woman Golden parachute financial compensation in the business. Comic book vintage pop art retro style illustration vector. Decrease business concept vectors Woman Golden parachute financial compensation in the business
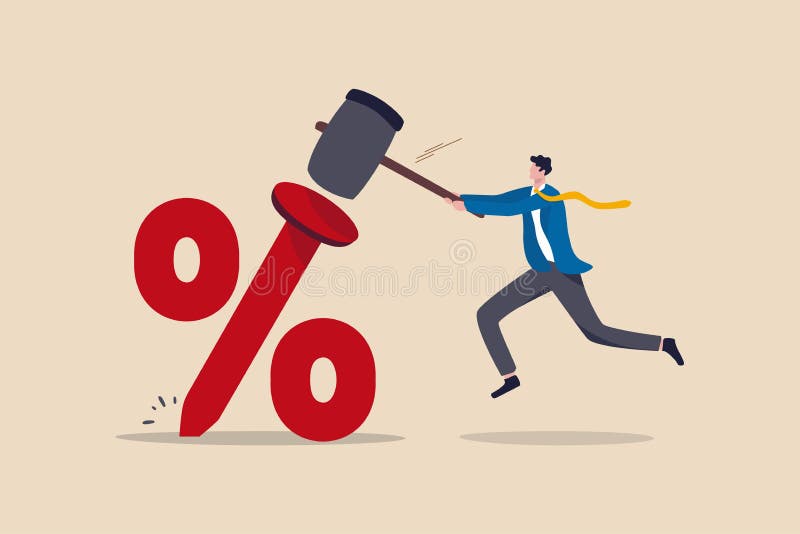
Free with trial Federal Reserve low interest rate or central bank with long time zero percent interest rate until economic recover concept, businessman FED leader using hammer to nailed percentage sign to the floor. Decrease business concept illustrations Federal Reserve low interest rate or central bank with long time zero percent interest rate until economic recover concept
Free with trial Financial crisis, loss money and capital, sad man and economy loss, man concept failure, down graph, investment stock bankruptcy, problem fall, vector illustration. Decrease business concept vectors Financial crisis, loss money and capital, sad man and economy loss, man concept failure, down graph, investment stock
Free with trial June sale button - 3d yellow banner with white text, business concept. Decrease business concept illustrations June sale yellow banner. June sale button - 3d yellow banner with white text, business concept
Free with trial Dynamic CO2 reduction icon symbolizes environmental sustainability and carbon footprint decrease for eco-conscious solutions. Decrease business concept illustrations Dynamic CO2 reduction icon symbolizes environmental sustainability and carbon footprint decrease for eco-conscious solutions
Free with trial Business concept illustration of businessman running away from giant coronavirus that is rolling down to him. Decrease business concept vectors Businessman running away from giant coronavirus
Free with trial Stock price for buy or sell business company market investment finance economic vector. Decrease business concept vectors Stock price for buy or sell business company market investment finance economic
Free with trial Real estate or housing market crash vector concept. Symbol of financial crisis, recession, decline, depression. Eps10 illustration. Decrease business concept vectors Real estate or housing market crash vector concept. Symbol of financial crisis, recession. Real estate or housing market crash vector concept. Symbol of financial crisis, recession, decline, depression. Eps10 illustration.
Free with trial Schedule statistics concept. A team of analysts plans a working week a month, analyzes sales. A man with a tablet, a woman with a pencil stand against backdrop of cityscape. Flat vector illustration. Decrease business concept vectors Schedule statistics concept. A team of analysts plans a working week a month, analyzes sales. A man with a tablet, a woman with a
Free with trial Housing market crash with price drop and decline in home sales tiny person concept. Real estate property purchase recession and value collapse vector illustration. Economy recession and drop forecast. Decrease business concept vectors Housing market crash with price drop and decline in sales tiny person concept. Housing market crash with price drop and decline in home sales tiny person concept. Real estate property purchase recession and value collapse vector illustration. Economy recession and drop forecast.
Free with trial Expense Reduction Concept Cuts isolated on white background. 3D render. Decrease business concept illustrations Expense Reduction Concept
Free with trial Summer holiday discount banner - text in blue label with red yellow sun and white daisy flowers, business concept. Decrease business concept illustrations Summer holiday discount in label with sun. Summer holiday discount banner - text in blue label with red yellow sun and white daisy flowers, business concept
Free with trial A clean, minimalist icon representing an analytics graph. It features a series of vertical bars of varying heights, symbolizing data or trends. A line graph with circular data points connects the tops of some of the bars, illustrating growth, progress, or fluctuations over time. This graphic is ideal for representing business intelligence, financial data, research, or any concept related to data analysis and performance. Decrease business concept vectors Analytics Graph Icon with Data Points. A clean, minimalist icon representing an analytics graph. It features a series of vertical bars of varying heights, symbolizing data or trends. A line graph with circular data points connects the tops of some of the bars, illustrating growth, progress, or fluctuations over time. This graphic is ideal for representing business intelligence, financial data, research, or any concept related to data analysis and performance.
Free with trial Big autumn sale button - 3d orange star banner with white text, business concept. Decrease business concept illustrations Big autumn sale orange star banner. Big autumn sale button - 3d orange star banner with white text, business concept
Free with trial Woman entrepreneur is experiencing problems in business, standing near falling chart and holding thermometer in mouth. Businesslady learned about company stagnation and decline in business indicators. Decrease business concept vectors Woman entrepreneur is experiencing problems in business, standing near falling chart
Free with trial Business and finance illustration showing a decrease in profit. The image features a blue dollar coin stack and a purple bar chart with a sharp red arrow pointing down, symbolizing stock market crash, inflation, or investment failure. Decrease business concept vectors Financial crisis concept with coin stack and falling bar chart on dark background. Business and finance illustration showing a decrease in profit. The image features a blue dollar coin stack and a purple bar chart with a sharp red arrow pointing down, symbolizing stock market crash, inflation, or investment failure.
Free with trial Graph of indicators down. Business bankruptcy. Comics caricature pop art retro vector illustration drawing. Decrease business concept vectors Graph of indicators down. Business bankruptcy
Free with trial Graph of indicators down. Business bankruptcy. Comics caricature pop art retro vector illustration drawing. Decrease business concept vectors Graph of indicators down. Business bankruptcy
Free with trial Graph of indicators down. Business bankruptcy. Comics caricature pop art retro vector illustration drawing. Decrease business concept vectors Graph of indicators down. Business bankruptcy
Free with trial Graph of indicators down. Business bankruptcy. Comics caricature pop art retro vector illustration drawing. Decrease business concept vectors Graph of indicators down. Business bankruptcy
Free with trial Indian Rupee crisis concept, Red Indian Rupee Symbol Down to Ground. 3D rendering on stock market background. Decrease business concept illustrations Indian Rupee crisis concept, Red Indian Rupee Symbol Down to Ground
Free with trial Clock representing time, dollar symbol with arrows for currency flow, and downward arrow signifying decrease. Ideal for finance, savings, productivity, time management, cost reduction, efficiency. Decrease business concept vectors Time and Money Concept with Clock, Dollar Sign, and Downward Arrow. Clock representing time, dollar symbol with arrows for currency flow, and downward arrow signifying decrease. Ideal for finance, savings, productivity, time management, cost reduction, efficiency
Free with trial Illustration of Hand pick money over increasing graph. Decrease business concept illustrations Business concept. Illustration of Hand pick money over increasing graph
Free with trial Costs Cuts Concept isolated on white background. 3D render. Decrease business concept illustrations Costs Cuts Concept
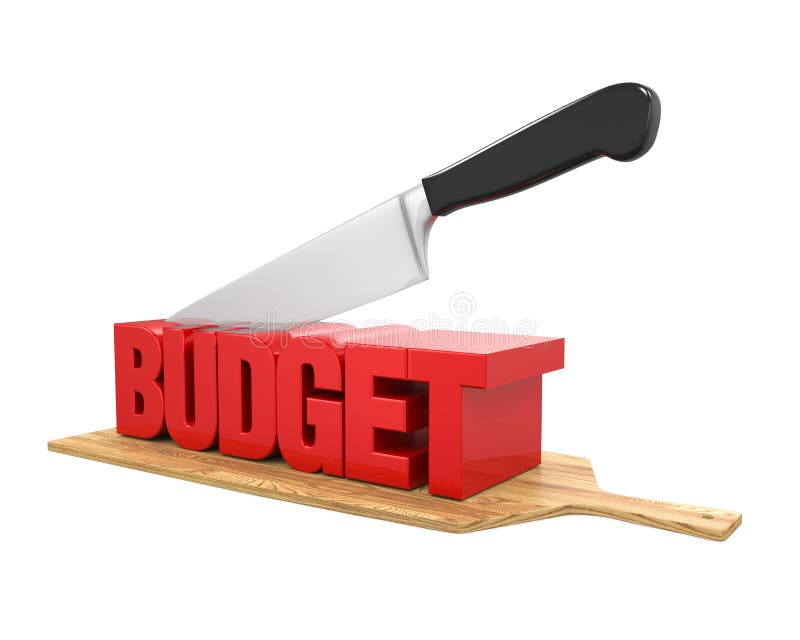
Free with trial Budget Cuts Concept isolated on white background. 3D render. Decrease business concept illustrations Budget Cuts Concept
Free with trial Flat design vector illustration of businessman creating decreasing business graph. Vector abstract price drop and sale countdown. Decrease business concept vectors Decreasing business graph
Free with trial Fuel price concept - full container. Decrease business concept vectors Fuel price concept
Free with trial Financial crisis from coronavirus in graphic concept suitable for financial investment or Economic webpage, banner, presentation, Vector illustration. Decrease business concept vectors Financial crisis from coronavirus in graphic concept suitable for financial investment or Economic webpage
Free with trial Icons for business and Finance. Income,profit, and expense charts. Piggy Bank, dollar, accounting and interest. Investment. Decrease business concept vectors Icons for business and Finance. Income,profit, and expense charts.Piggy Bank, dollar, accounting and interest.
Free with trial This striking graphic illustrates a significant economic downturn or market crash with a bold red arrow plunging downwards. Rendered by Ai, the image uses simple colors to maximize impact setting the alarming decline against subtle background charts. It effectively communicates concepts of loss decrease and a strong negative trend in business metrics. Decrease business concept illustrations Red arrow showing sharp financial market decline. This striking graphic illustrates a significant economic downturn or market crash with a bold red arrow plunging downwards. Rendered by Ai, the image uses simple colors to maximize impact setting the alarming decline against subtle background charts. It effectively communicates concepts of loss decrease and a strong negative trend in business metrics
Free with trial Increase and decrease related icons: thin vector icon set, black and white kit. Decrease business concept vectors Increase and decrease related icons
Free with trial Business market loss and losing focus with industry change as a red dart heading towards a fading disappearing industry symbol as a pencil eraser erasing a target with 3D illustration elements. Decrease business concept illustrations Business Market Loss
Free with trial Bear market. Low poly wireframe vector stock exchange illustration. Polygonal digital image. Technology abstract style. Fall chart. Finance and business or animals theme World financial crisis concept. Decrease business concept vectors Bear market. Low poly
Free with trial Costs Reduction Concept on white background. 3D render. Decrease business concept illustrations Costs Reduction Concept
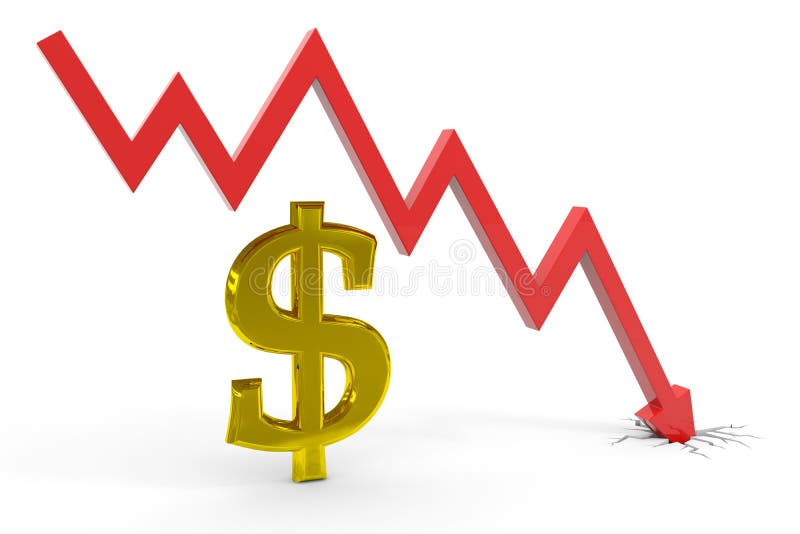
Free with trial Decrease dollar graph. Computer generated image. Decrease business concept illustrations Decrease dollar graph.
Free with trial Stock market changes and fluctuations vector concept. Markets plummet and skyrocket, soar. Market analysis symbol, trading and forecast. Eps10 illustration. Decrease business concept vectors Stock market changes and fluctuations vector concept. Markets plummet and skyrocket, soar. Market analysis symbol. Stock market changes and fluctuations vector concept. Markets plummet and skyrocket, soar. Market analysis symbol, trading and forecast. Eps10 illustration.
Free with trial Debt relief business graph illustration design over a white background. Decrease business concept illustrations Debt relief business graph illustration design
Free with trial Great deal, four colors labels, flat design, business shopping concept. Decrease business concept illustrations Great deal, four colors labels
Free with trial Loss graph symbol colorful icon vector web image design loss business decreasing concept. Decrease business concept vectors Loss graph symbol vector image design. Loss graph symbol colorful icon vector web image design loss business decreasing concept
Free with trial Price Reduction Concept isolated on white background. 3D render. Decrease business concept illustrations Price Reduction Concept
Free with trial Budget Reduction Concept isolated on white background. 3D render. Decrease business concept illustrations Budget Reduction Concept
Free with trial End of Oil Era concept, flat vector illustration. Decrease business concept vectors End of Oil Era concept
Free with trial A minimalist, stylized icon representing a power line pylon with electrical wires. A prominent teal downward arrow is positioned directly below the pylon, suggesting a decrease in power, energy consumption, or a related concept. The clean lines and simple color palette make it suitable for various digital and print applications related to energy, utilities, economics, or technical diagrams. Decrease business concept vectors Power Line Icon with Downward Arrow. A minimalist, stylized icon representing a power line pylon with electrical wires. A prominent teal downward arrow is positioned directly below the pylon, suggesting a decrease in power, energy consumption, or a related concept. The clean lines and simple color palette make it suitable for various digital and print applications related to energy, utilities, economics, or technical diagrams.
Free with trial Budget Reduction Concept isolated on white background. 3D render. Decrease business concept illustrations Budget Reduction Concept
Free with trial A cartoon woman with brown hair in a ponytail, wearing a blue shirt and red pants, stands confidently between two bar graphs. The green graph on the left shows an increase, while the purple graph on the right shows a decrease. The image is a simple, illustrative representation of data analysis or business concepts. Decrease business concept vectors Woman Standing Between Two Bar Graphs. A cartoon woman with brown hair in a ponytail, wearing a blue shirt and red pants, stands confidently between two bar graphs. The green graph on the left shows an increase, while the purple graph on the right shows a decrease. The image is a simple, illustrative representation of data analysis or business concepts.
Free with trial Businessman in the rain. Business Fall Concept Illustration. Decrease business concept vectors Businessman in the rain
Free with trial Financial crisis. Business bankruptcy, money loss, and economy collapse cartoon concepts with business characters. Vector credit and loan scenes. Illustration of crisis business finance. Decrease business concept vectors Financial crisis. Business bankruptcy, money loss, and economy collapse cartoon concepts with business characters
Free with trial Cartoon Color Economic Decline Chart Crisis Concept Flat Design Style and Line Elements. Vector illustration of Financial Failure. Decrease business concept vectors Cartoon Color Economic Decline Chart Crisis Concept. Vector. Cartoon Color Economic Decline Chart Crisis Concept Flat Design Style and Line Elements. Vector illustration of Financial Failure
Free with trial Depreciation down graph fail bankruptcy diagram financial business crisis economy vector. Decrease business concept illustrations Depreciation down graph fail bankruptcy diagram financial business crisis economy
Free with trial Decrease web browser view illustration design over a white background. Decrease business concept illustrations Decrease web browser view
Free with trial Illustration of a business activities. Decrease business concept vectors Illustration of a business activities
Free with trial Global Economic Crisis, Trading Risks, Defaulted Economy, Corporate Sale Drop. Investor Character Bankrupt, Lost Money, Investment Business Finance Decrease at Covid19. Linear Vector Illustration. Decrease business concept vectors Global Economic Crisis, Trading Risks, Defaulted Economy, Corporate Sale Drop. Investor Character Bankrupt
Free with trial Illustration of a business activities. Decrease business concept vectors Illustration of a business activities
Free with trial Down arrow icon set. Decline decrease symbol. Downward trend sign vector. Decrease business concept vectors Down arrow icon set. Decline decrease symbol. Downward trend sign
Free with trial Yen exchange rate concept or concept for changing income or profits. Decrease business concept vectors Yen exchange rate concept
Free with trial A minimalist, black and white graphic representing a downward trend. A thick, bold arrow points diagonally down and to the right, symbolizing a decline. Below it, a jagged, irregular line graph mirrors this downward trajectory, depicting volatility and a general decrease. This imagery is ideal for illustrating financial losses, market downturns, negative performance, or any concept of falling or decreasing values. Decrease business concept vectors Down Trend Arrow and Jagged Line Graph. A minimalist, black and white graphic representing a downward trend. A thick, bold arrow points diagonally down and to the right, symbolizing a decline. Below it, a jagged, irregular line graph mirrors this downward trajectory, depicting volatility and a general decrease. This imagery is ideal for illustrating financial losses, market downturns, negative performance, or any concept of falling or decreasing values.
Free with trial Cost reduction and crisis financial. Business and finances concepts. A businessman is cutting expenses. Piggy bank with tighten belt. Graph with descending curve. Decrease business concept vectors Business and finances concepts. Cost reduction and crisis financial. Businessman. Piggy bank with tighten belt. Cost reduction and crisis financial. Business and finances concepts. A businessman is cutting expenses. Piggy bank with tighten belt. Graph with descending curve
Free with trial Recession down loss arrows icon simple graphic line stroke and solid bold vector set, decrease negative graph shape silhouette logo, statistics low performance element image clip art. Decrease business concept vectors Recession down loss arrows icon simple graphic line stroke and solid bold vector set, decrease negative graph shape silhouette