Free with trial Yellow sad emoticon and green pants next to stylized line graph with nodes. Ideal for fashion industry, sales decrease, trends, dissatisfaction, analysis, loss, economics. Simple flat metaphor. Decrease business concept illustrations Sad face with pants and graph chart symbolizing loss or decline in trends or fashion demand. Yellow sad emoticon and green pants next to stylized line graph with nodes. Ideal for fashion industry, sales decrease, trends, dissatisfaction, analysis, loss, economics. Simple flat metaphor
Free with trial Decreasing arrow and golden coins heap. Crisis, money and loss concept. 3d rendering. Decrease business concept illustrations Decreasing arrow and golden coins heap
Free with trial A striking red 3D arrow is constructed from a series of connected cubes that gradually decrease in size as they form the arrow's shaft. The arrow points downwards and to the right, suggesting a trend or decline. The entire object is rendered in sharp detail against a clean white background. Decrease business concept illustrations Red 3D Arrow Composed of Cubes Progressing Downward on White Background blocks. A striking red 3D arrow is constructed from a series of connected cubes that gradually decrease in size as they form the arrow's shaft. The arrow points downwards and to the right, suggesting a trend or decline. The entire object is rendered in sharp detail against a clean white background
Free with trial Bar graph decreasing in height beside falling coins merging into cloud. Ideal for finance, economy, business risk, savings, investment, financial crisis, wealth management. Simple flat metaphor. Decrease business concept vectors Financial decline represented with bar graph and coins falling into cloud symbolizing loss. Bar graph decreasing in height beside falling coins merging into cloud. Ideal for finance, economy, business risk, savings, investment, financial crisis, wealth management. Simple flat metaphor
Free with trial Abstract illustration of a financial graph with glowing lines on a dark background. The graph shows two distinct curves, one starting in cool blue tones and transitioning to warm orange hues, suggesting a shift in market trends or performance. The image conveys concepts of data analysis, growth, decline, and financial forecasting. Suitable for illustrating business reports, presentations, or articles related to finance, investment, and economics. Decrease business concept illustrations Abstract Financial Graph Illustration. Abstract illustration of a financial graph with glowing lines on a dark background. The graph shows two distinct curves, one starting in cool blue tones and transitioning to warm orange hues, suggesting a shift in market trends or performance. The image conveys concepts of data analysis, growth, decline, and financial forecasting. Suitable for illustrating business reports, presentations, or articles related to finance, investment, and economics.
Free with trial This image displays a set of stylized bar chart icons representing financial and business trends. The leftmost icon features green bars increasing in height, accompanied by a green upward-pointing arrow, symbolizing growth and success. The middle icon shows red bars decreasing in height, with a black downward-pointing arrow indicating decline and loss. The right side presents two smaller black and white bar charts, also depicting downward trends. These icons are ideal for illustrating concepts like profit, loss, market trends, economic performance, and data analysis. Decrease business concept illustrations Growth and Decline Bar Chart Icons. This image displays a set of stylized bar chart icons representing financial and business trends. The leftmost icon features green bars increasing in height, accompanied by a green upward-pointing arrow, symbolizing growth and success. The middle icon shows red bars decreasing in height, with a black downward-pointing arrow indicating decline and loss. The right side presents two smaller black and white bar charts, also depicting downward trends. These icons are ideal for illustrating concepts like profit, loss, market trends, economic performance, and data analysis.
Free with trial Environmental awareness, sustainability, carbon tracking, ecological impact, climate change, emissions reduction. Magnifying glass with a CO2 footprint and downward arrow. Environmental awareness. Decrease business concept illustrations Carbon Footprint Monitoring and Reduction Concept with Magnifying Glass and CO2 Illustration. Environmental awareness, sustainability, carbon tracking, ecological impact, climate change, emissions reduction. Magnifying glass with a CO2 footprint and downward arrow. Environmental awareness
Free with trial Rocket taking off next to upward and downward arrows and a percentage sign. Ideal for growth, progress, performance, finance, business, fluctuation, and innovation themes. Simple flat metaphor. Decrease business concept vectors Rocket Launching Amid Upward and Downward Arrows with Percentage Symbol Emphasizing Growth Dynamics. Rocket taking off next to upward and downward arrows and a percentage sign. Ideal for growth, progress, performance, finance, business, fluctuation, and innovation themes. Simple flat metaphor
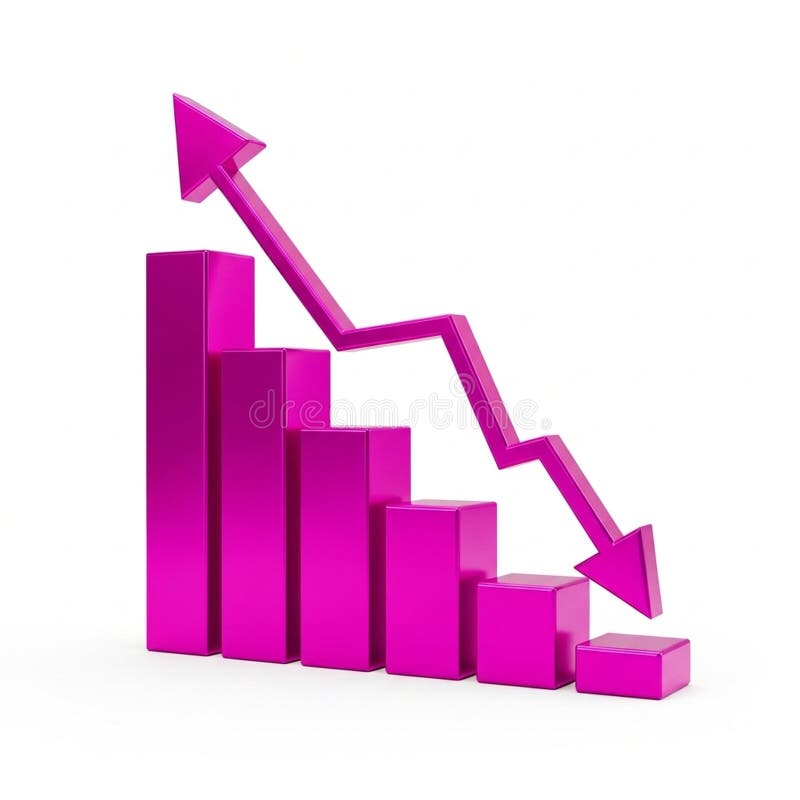
Free with trial A vibrant pink 3D bar chart illustrates financial data with a prominent downward-trending arrow superimposed. The bars decrease in height from left to right, signifying a decline. An upward-pointing arrow is positioned at the top left, indicating a contrasting upward trend. The graphic is isolated on a white background, making it suitable for presentations on financial performance, market trends,. Decrease business concept illustrations 3D Pink Bar Chart with Downward Trend Arrow and Upward Trend Arrow graph statistics. A vibrant pink 3D bar chart illustrates financial data with a prominent downward-trending arrow superimposed. The bars decrease in height from left to right, signifying a decline. An upward-pointing arrow is positioned at the top left, indicating a contrasting upward trend. The graphic is isolated on a white background, making it suitable for presentations on financial performance, market trends,
Free with trial This image showcases a large collection of minimalist, line-style icons representing various charts and graphs. These icons depict data visualization elements commonly used in business, analytics, and reporting. high-quality professional. Decrease business concept vectors Collection of diverse line style charts and graphs icons displayed neatly. This image showcases a large collection of minimalist, line-style icons representing various charts and graphs. These icons depict data visualization elements commonly used in business, analytics, and reporting. high-quality professional
Free with trial Flat vector illustration of a businessman holding cash that is breaking apart, symbolizing financial loss, investment risk, economic instability, and money depreciation. Decrease business concept vectors Financial Loss Concept Illustration with Money Breaking and Investment Risk. Flat vector illustration of a businessman holding cash that is breaking apart, symbolizing financial loss, investment risk, economic instability, and money depreciation
Free with trial Data performance, emotional analysis, trends, efficiency, technology, decision-making. Graph with declining curve, sad and happy faces gear mechanism. Data performance and emotional analysis concept. Decrease business concept vectors Data Analysis Chart with Declining Trend, Emotional Reactions, and Gear Mechanism Efficiency. Data performance, emotional analysis, trends, efficiency, technology, decision-making. Graph with declining curve, sad and happy faces gear mechanism. Data performance and emotional analysis concept
Free with trial Sustainability, carbon reduction, eco-friendly innovation, environmental monitoring, climate change, renewable practices. Blue location pin, CO2 footprint arrow cloud. Sustainability and carbon. Decrease business concept vectors Carbon Footprint Reduction and Environmental Awareness with Location Tracking Concept Icons. Sustainability, carbon reduction, eco-friendly innovation, environmental monitoring, climate change, renewable practices. Blue location pin, CO2 footprint arrow cloud. Sustainability and carbon
Free with trial Illustration of a growing sales funnel depth with a deep funnel filling with gold coins, a stream of downward arrows, and a simple payment terminal. Vector flat icon design on a white background for a prospect conversion illustration --chaos 30 --ar 16:9 --v 7 Job ID: 03afdd75-fca3-49f5-98d4-f73b21faf025. Decrease business concept illustrations Money Loss Concept Coins Falling Through Funnel into Pile, Money Decreasing Near Payment Terminal. Illustration of a growing sales funnel depth with a deep funnel filling with gold coins, a stream of downward arrows, and a simple payment terminal. Vector flat icon design on a white background for a prospect conversion illustration --chaos 30 --ar 16:9 --v 7 Job ID: 03afdd75-fca3-49f5-98d4-f73b21faf025
Free with trial A clean, minimalist background featuring a soft gradient from light blue to pale purple. The number '-5%' is prominently displayed in white text, suggesting a discount, sale, or negative growth. This versatile image is ideal for financial reports, marketing materials, retail promotions, or any concept related to price reduction or decline. Decrease business concept illustrations Negative Percentage Discount Background. A clean, minimalist background featuring a soft gradient from light blue to pale purple. The number '-5%' is prominently displayed in white text, suggesting a discount, sale, or negative growth. This versatile image is ideal for financial reports, marketing materials, retail promotions, or any concept related to price reduction or decline.
Free with trial Sustainability, environmental responsibility, green initiatives, carbon reduction, climate action, collaboration. Handshake, carbon footprint icon thermometer falling chart. Sustainability. Decrease business concept vectors Handshake Eco-Friendly Partnership with Carbon Footprint Reduction and Climate Action Concept. Sustainability, environmental responsibility, green initiatives, carbon reduction, climate action, collaboration. Handshake, carbon footprint icon thermometer falling chart. Sustainability
Free with trial Up and Down sign with green and red arrows vector illustration. Concept of sales bar chart symbol icon with arrow moving down and sales bar chart with arrow moving up. Decrease business concept vectors Up and Down sign with green and red arrows vector illustration. Concept of sales bar chart symbol icon
Free with trial Arrow 3d chart graph pointer, vector illustration. Up and down forward arrow, motion and navigation symbol, financial growth concept. Web design elements crease of decrease sign. Decrease business concept vectors Arrow navigation pointer, chart graph. Arrow 3d chart graph pointer, vector illustration. Up and down forward arrow, motion and navigation symbol, financial growth concept. Web design elements crease of decrease sign
Free with trial A 3D render depicting a financial concept. A purple bar chart shows increasing height from left to right, but a large yellow arrow curves downwards, indicating a significant decline. A single yellow coin is positioned above the tallest bar. The entire composition is isolated on a white background. Decrease business concept illustrations 3D Render of a Falling Yellow Arrow Over a Purple Bar Chart with a Yellow Coin falling arrow. A 3D render depicting a financial concept. A purple bar chart shows increasing height from left to right, but a large yellow arrow curves downwards, indicating a significant decline. A single yellow coin is positioned above the tallest bar. The entire composition is isolated on a white background
Free with trial Consumer behavior, sustainability, e-commerce, recycling awareness, monetary trends, sales decrease. Blue arrow pointing down, recycling sign on a shopping bag and dollar coin. Consumer behavior. Decrease business concept vectors Arrow Pointing Downward with Shopping Bag and Dollar Symbol - E-Commerce and Sustainability Concepts. Consumer behavior, sustainability, e-commerce, recycling. Consumer behavior, sustainability, e-commerce, recycling awareness, monetary trends, sales decrease. Blue arrow pointing down, recycling sign on a shopping bag and dollar coin. Consumer behavior
Free with trial Black glyph icon representing a broken downward arrow, symbolizing decline, financial crisis, market downturn, failure, or negative trends. Ideal for business presentations, economic reports, data visualization, infographics, and conceptual designs indicating loss, recession, or problems. Simple, clean graphic illustration on a white background. Generated by AI. Decrease business concept vectors Declining Trend Broken Downward Arrow Icon. Black glyph icon representing a broken downward arrow, symbolizing decline, financial crisis, market downturn, failure, or negative trends. Ideal for business presentations, economic reports, data visualization, infographics, and conceptual designs indicating loss, recession, or problems. Simple, clean graphic illustration on a white background. Generated by AI
Free with trial Rejection, negative feedback, failure, financial loss, poor performance, declining trends. Hand raised in stop gesture, sad face and declining bar graph. Rejection and negative feedback concept. Decrease business concept illustrations Hand Gesture with Sad Face and Declining Bar Graph Rejection, Negative Trends, or Failure Concepts. Rejection, negative feedback, failure, financial loss, poor performance, declining trends. Hand raised in stop gesture, sad face and declining bar graph. Rejection and negative feedback concept
Free with trial An illustrative bar chart depicts a clear financial decline, with five orange bars progressively decreasing in height from left to right. Each bar is topped with a black-outlined money bag containing a dollar sign, symbolizing diminishing wealth, income, or investment. This simple, flat design icon effectively conveys concepts of financial loss, economic downturn, decreasing profits, or budget cuts, suitable for business reports, presentations, and articles on market trends or investment risks. Decrease business concept vectors Financial Decline Bar Chart with Money Bags. An illustrative bar chart depicts a clear financial decline, with five orange bars progressively decreasing in height from left to right. Each bar is topped with a black-outlined money bag containing a dollar sign, symbolizing diminishing wealth, income, or investment. This simple, flat design icon effectively conveys concepts of financial loss, economic downturn, decreasing profits, or budget cuts, suitable for business reports, presentations, and articles on market trends or investment risks.
Free with trial A visual representation of an energy efficiency rating system is displayed on a white background. It consists of seven horizontal arrows, each labeled with a letter from A (green) at the top to G (red) at the bottom. The arrows decrease in size as they go down the scale, with intermediate colors like yellow and orange representing intermediate ratings. Decrease business concept illustrations Energy Efficiency Rating Chart with Colored Arrows from A to G graph. A visual representation of an energy efficiency rating system is displayed on a white background. It consists of seven horizontal arrows, each labeled with a letter from A (green) at the top to G (red) at the bottom. The arrows decrease in size as they go down the scale, with intermediate colors like yellow and orange representing intermediate ratings
Free with trial A bright red, three-dimensional arrow is depicted pointing directly downwards. The arrow has a glossy, reflective surface and is presented in isolation against a stark white background. This visual element commonly represents a downward trend, decrease, or negative movement. Decrease business concept illustrations Shiny Red 3D Arrow Pointing Downwards on a White Background direction. A bright red, three-dimensional arrow is depicted pointing directly downwards. The arrow has a glossy, reflective surface and is presented in isolation against a stark white background. This visual element commonly represents a downward trend, decrease, or negative movement
Free with trial A 3D bar graph with bars of decreasing height, representing a downward trend. A prominent red arrow points downwards, signifying a decline or loss. The background is a subtle gradient. This visual effectively communicates concepts like financial crisis, economic recession, market crash, or business failure. Decrease business concept illustrations Financial downturn illustrated by a declining bar graph and red arrow. A 3D bar graph with bars of decreasing height, representing a downward trend. A prominent red arrow points downwards, signifying a decline or loss. The background is a subtle gradient. This visual effectively communicates concepts like financial crisis, economic recession, market crash, or business failure
Free with trial Business charts, data visualization, financial analysis, progress tracking, statistics, graphs, analysis, charts bar in line, orange. Decrease business concept vectors Collection of diverse orange bar charts and line graph against a white background. Business charts, data visualization, financial analysis, progress tracking, statistics, graphs, analysis, charts bar in line, orange
Free with trial A 3D bar chart rendered in a vibrant pink color illustrates a significant downward trend. The bars decrease in height from left to right, culminating in a very short bar. A bold pink arrow, also in 3D, starts high on the left and sharply descends to the right, mirroring the decline shown by the bars. The entire graphic is isolated on a clean white background. Decrease business concept illustrations Pink 3D Bar Chart Showing a Downward Trend with an Arrow graph decline. A 3D bar chart rendered in a vibrant pink color illustrates a significant downward trend. The bars decrease in height from left to right, culminating in a very short bar. A bold pink arrow, also in 3D, starts high on the left and sharply descends to the right, mirroring the decline shown by the bars. The entire graphic is isolated on a clean white background
Free with trial Technological geometric vector illustration showing blue polygonal arrow aimed downwards. Modern digital art piece depicting financial decrease or direction using crystal triangulation technique. Decrease business concept vectors Abstract low poly blue arrow pointing down on dark background representing decline. Technological geometric vector illustration showing blue polygonal arrow aimed downwards. Modern digital art piece depicting financial decrease or direction using crystal triangulation technique
Free with trial A simple and clear graphic illustrating the concept of currency exchange rates on a white background. This vector illustration depicts the Euro symbol (�) with a green up arrow, indicating appreciation, and the US Dollar symbol ($) with a red down arrow, signifying depreciation. It effectively visualizes the fluctuation in the foreign exchange (Forex) market, specifically a strong Euro against a weak Dollar. Ideal for financial news, economic articles, business presentations, and educational content about international trade and investment. Decrease business concept vectors Euro vs Dollar Currency Exchange Rate Graphic. A simple and clear graphic illustrating the concept of currency exchange rates on a white background. This vector illustration depicts the Euro symbol (�) with a green up arrow, indicating appreciation, and the US Dollar symbol ($) with a red down arrow, signifying depreciation. It effectively visualizes the fluctuation in the foreign exchange (Forex) market, specifically a strong Euro against a weak Dollar. Ideal for financial news, economic articles, business presentations, and educational content about international trade and investment.
Free with trial This clear and concise vector illustration visually represents the concept of currency exchange rates between the US Dollar and the Euro. Featuring prominent dollar and euro symbols, it uses a green upward arrow and a red downward arrow to signify the fluctuating values or conversion dynamics between the two major global currencies. Ideal for financial news, economic reports, banking websites, investment presentations, or any content related to international trade, forex markets, and monetary policy. The simple design on a white background ensures versatility and easy integration. Decrease business concept vectors Dollar Euro Exchange Rate Fluctuation Concept. This clear and concise vector illustration visually represents the concept of currency exchange rates between the US Dollar and the Euro. Featuring prominent dollar and euro symbols, it uses a green upward arrow and a red downward arrow to signify the fluctuating values or conversion dynamics between the two major global currencies. Ideal for financial news, economic reports, banking websites, investment presentations, or any content related to international trade, forex markets, and monetary policy. The simple design on a white background ensures versatility and easy integration.
Free with trial A gleaming golden arrow is depicted in a 3D render, pointing diagonally downwards. The arrow has a sharp, angular design and appears to be made of polished metal, reflecting light. It is isolated on a clean white background, casting a subtle shadow beneath it, emphasizing its three-dimensional form and suggesting a concept of decline or downward movement. Decrease business concept illustrations Golden Arrow Pointing Downward Isolated on White Background image photo. A gleaming golden arrow is depicted in a 3D render, pointing diagonally downwards. The arrow has a sharp, angular design and appears to be made of polished metal, reflecting light. It is isolated on a clean white background, casting a subtle shadow beneath it, emphasizing its three-dimensional form and suggesting a concept of decline or downward movement
Free with trial Panic businesswoman watching red bar chart falling like domino effect, symbolizing financial crisis, economic downturn, business failure, risk, and market collapse concept illustration. Decrease business concept vectors Panic businesswoman watching falling red bar chart like domino effect. Panic businesswoman watching red bar chart falling like domino effect, symbolizing financial crisis, economic downturn, business failure, risk, and market collapse concept illustration
Free with trial Climate change, sustainability, carbon tracking, CO2 emissions reduction, environmental impact, data visualization. Line graph tracking data. Climate change and sustainability concepts. Decrease business concept vectors Carbon Footprint Reduction Concept with Line Graph, CO2 Symbol, and Decreasing Temperature Indicator. Climate change, sustainability, carbon tracking, CO2 emissions reduction, environmental impact, data visualization. Line graph tracking data. Climate change and sustainability concepts
Free with trial Declining graph trend with sad face, security lock symbol, and coding element. Ideal for failure analysis, cybersecurity, data breach awareness, risk management, technology flaws, business loss. Decrease business concept vectors Declining Data Trend on Graph with Security and Sad Expression. Declining graph trend with sad face, security lock symbol, and coding element. Ideal for failure analysis, cybersecurity, data breach awareness, risk management, technology flaws, business loss
Free with trial Circular chart icon presenting a bar graph visualizing statistical data, analytics, and business reports, symbolizing financial decline, data analysis, and market trends. Decrease business concept vectors Circular chart icon showing declining bar graph. Circular chart icon presenting a bar graph visualizing statistical data, analytics, and business reports, symbolizing financial decline, data analysis, and market trends
Free with trial Bull vs bear stock market trade volatility concept vector. Decrease business concept vectors Bull vs bear stock market trade volatility concept
Free with trial Wooden blocks spelling inflation surrounded by various coins on a wooden surface. Decrease business concept illustrations Inflation concept increasing prices for consumer goods. Wooden blocks spelling inflation surrounded by various coins on a wooden surface
Free with trial Financial crisis icon with dollar symbol, market decline arrow showing economic loss and business downturn concept. Decrease business concept vectors Financial crisis icon with dollar symbol, market decline arrow showing economic loss
Free with trial A 3D rendering of a bar graph with teal bars of decreasing height, indicating a downward trend. A bold red arrow overlays the graph, sharply descending and pointing towards the lowest bar, visually representing a significant loss or decline. The background is slightly blurred, suggesting a professional or office environment. Decrease business concept illustrations Business graph showing a sharp decline with a red arrow pointing downwards. A 3D rendering of a bar graph with teal bars of decreasing height, indicating a downward trend. A bold red arrow overlays the graph, sharply descending and pointing towards the lowest bar, visually representing a significant loss or decline. The background is slightly blurred, suggesting a professional or office environment
Free with trial A stylized logo featuring a bright yellow star at its center, enclosed within concentric blue circles. This emblem is flanked by a pair of abstract wings, composed of multiple horizontal blue stripes that decrease in length towards the tips. The design is clean, modern, and evokes a sense of achievement, aviation, or excellence. It's ideal for branding, badges, awards, or any concept related to success and aspiration. Decrease business concept vectors Winged Star Emblem Logo. A stylized logo featuring a bright yellow star at its center, enclosed within concentric blue circles. This emblem is flanked by a pair of abstract wings, composed of multiple horizontal blue stripes that decrease in length towards the tips. The design is clean, modern, and evokes a sense of achievement, aviation, or excellence. It's ideal for branding, badges, awards, or any concept related to success and aspiration.
Free with trial A minimalist flat design icon featuring a vertical separator bar. On the left, an upward-pointing arrow and a dark grey triangle symbolize "up" or "upload. " On the right, a downward-pointing arrow and an inverted dark grey triangle represent "down" or "download. " This versatile vector illustration is ideal for user interface elements, web design, mobile applications, data transfer concepts, navigation, or indicating directional movement and progress. Decrease business concept illustrations Up Down Arrows Icon for Upload Download Concept. A minimalist flat design icon featuring a vertical separator bar. On the left, an upward-pointing arrow and a dark grey triangle symbolize "up" or "upload." On the right, a downward-pointing arrow and an inverted dark grey triangle represent "down" or "download." This versatile vector illustration is ideal for user interface elements, web design, mobile applications, data transfer concepts, navigation, or indicating directional movement and progress.
Free with trial A striking 3D rendered image depicts a series of red cubes arranged to form a large arrow pointing downwards and to the right. The arrow is positioned on a clean white background, emphasizing its shape and the concept of decline or a negative trend. The cubes are uniformly colored and have a smooth, reflective surface, creating a modern and abstract visual. Decrease business concept illustrations Red 3D Arrow Formed by Cubes Pointing Downward on White Background decline. A striking 3D rendered image depicts a series of red cubes arranged to form a large arrow pointing downwards and to the right. The arrow is positioned on a clean white background, emphasizing its shape and the concept of decline or a negative trend. The cubes are uniformly colored and have a smooth, reflective surface, creating a modern and abstract visual
Free with trial Downward-sloping chart with a sad face, green shoe, and question mark in speech bubble. Ideal for decline, confusion, business struggles, feedback, decision-making search or mystery. Simple flat. Decrease business concept illustrations Declining Trend with Sad Face and a Shoe Mystery in Speech Bubble. Downward-sloping chart with a sad face, green shoe, and question mark in speech bubble. Ideal for decline, confusion, business struggles, feedback, decision-making search or mystery. Simple flat
Free with trial A stack of gold coins and bars sit on top of a chart with a downward trend. The chart shows a decrease in value, while the gold coins and bars remain valuable. Decrease business concept illustrations A stack of gold coins and bars sit on top of a chart with a downward trend
Free with trial A bold, glossy green arrow is depicted pointing directly downwards. The arrow has a smooth, reflective surface and is presented in a studio shot against a clean white background, making it isolated. Its clear directional cue makes it suitable for representing concepts of decline, decrease, or downward movement. Decrease business concept illustrations A large, glossy green arrow pointing downwards on a white background direction. A bold, glossy green arrow is depicted pointing directly downwards. The arrow has a smooth, reflective surface and is presented in a studio shot against a clean white background, making it isolated. Its clear directional cue makes it suitable for representing concepts of decline, decrease, or downward movement
Free with trial A 3D rendered graphic featuring a large, smooth blue arrow pointing downwards. Attached to the side of the arrow is a small, round pink icon containing a white percent symbol. The entire graphic is isolated on a white background, suggesting a concept related to discounts, price reductions, or negative trends. Decrease business concept illustrations 3D Render of a Blue Downward Arrow with a Pink Circle and Percent Symbol down arrow. A 3D rendered graphic featuring a large, smooth blue arrow pointing downwards. Attached to the side of the arrow is a small, round pink icon containing a white percent symbol. The entire graphic is isolated on a white background, suggesting a concept related to discounts, price reductions, or negative trends
Free with trial Red zigzag line graph with broken arrows pointing up and down. Business metaphor for market volatility and financial crisis. Handdrawn zig zag arrows. Decrease business concept vectors Red zigzag line graph with broken arrows pointing up and down. Market volatility and financial crisis. Zig zag arrows. Red zigzag line graph with broken arrows pointing up and down. Business metaphor for market volatility and financial crisis. Handdrawn zig zag arrows
Free with trial A sharp, faceted blue crystal arrow is depicted pointing diagonally downwards on a clean white background. The arrow exhibits reflective surfaces and sharp edges, giving it a modern and sleek appearance. This graphic element symbolizes decline, decrease, or a downward trend. Decrease business concept illustrations Blue Crystal Arrow Pointing Downward on a White Background direction decline. A sharp, faceted blue crystal arrow is depicted pointing diagonally downwards on a clean white background. The arrow exhibits reflective surfaces and sharp edges, giving it a modern and sleek appearance. This graphic element symbolizes decline, decrease, or a downward trend
Free with trial A vibrant red 80% sign, perfect for sales and promotions, stands out against a clean white background, ideal for business and marketing. Decrease business concept illustrations Eye-catching 80% off sign in bold red, ideal for promotional use and sales announcements. A vibrant red 80% sign, perfect for sales and promotions, stands out against a clean white background, ideal for business and marketing
Free with trial A sharp, blue glass arrow is depicted pointing directly downwards against a stark white background. The arrow is rendered in 3D, showcasing its glossy, reflective surface and faceted edges. The bright blue color and the downward direction suggest concepts of decrease, loss, or a negative trend. The object is isolated, highlighting its form and material. Decrease business concept illustrations 3D Rendered Blue Glass Arrow Pointing Downward on White Background direction. A sharp, blue glass arrow is depicted pointing directly downwards against a stark white background. The arrow is rendered in 3D, showcasing its glossy, reflective surface and faceted edges. The bright blue color and the downward direction suggest concepts of decrease, loss, or a negative trend. The object is isolated, highlighting its form and material
Free with trial This comprehensive vector icon set illustrates various financial market trends, economic indicators, and potential crises. Featuring line graphs, bar charts, pie charts, dollar signs, piggy banks, and warning sirens, the collection uses a striking red and black color palette to depict both growth and decline. Concepts like stock market volatility, investment risks, economic downturns, and business analytics are visually represented. Ideal for financial reports, business presentations, economic news, investment platforms, and educational materials requiring clear and impactful visual communication of market dynamics. Decrease business concept vectors Financial Market Trends and Crisis Vector Icons Set. This comprehensive vector icon set illustrates various financial market trends, economic indicators, and potential crises. Featuring line graphs, bar charts, pie charts, dollar signs, piggy banks, and warning sirens, the collection uses a striking red and black color palette to depict both growth and decline. Concepts like stock market volatility, investment risks, economic downturns, and business analytics are visually represented. Ideal for financial reports, business presentations, economic news, investment platforms, and educational materials requiring clear and impactful visual communication of market dynamics.
Free with trial A clean and minimalist illustration featuring a set of fundamental mathematical symbols in black against a pure white background. The symbols include plus (+), minus (-), division (�), multiplication (�), and equals ( ). This versatile graphic is ideal for educational materials, financial reports, business presentations, technology interfaces, or any design requiring clear representation of arithmetic operations, problem-solving, or logical concepts. Its simple design ensures high readability and adaptability across various media. Decrease business concept illustrations Basic Mathematical Symbols Set on White Background. A clean and minimalist illustration featuring a set of fundamental mathematical symbols in black against a pure white background. The symbols include plus (+), minus (-), division (�), multiplication (�), and equals ( ). This versatile graphic is ideal for educational materials, financial reports, business presentations, technology interfaces, or any design requiring clear representation of arithmetic operations, problem-solving, or logical concepts. Its simple design ensures high readability and adaptability across various media.
Free with trial Blue Cost reduction icon isolated on blue background. Minimalism concept. 3D render illustration. Decrease business concept illustrations Blue Cost reduction icon isolated on blue background. Minimalism concept. 3D render illustration
Free with trial Businessmans hands hold burning green money. Financial inflation. Recession or economy crisis. Banknotes in fire flame. Wealth loss. Currency devaluation. Blazing dollar. Cash ignition. Vector concept. Decrease business concept vectors Businessmans hands hold burning green money. Financial inflation. Recession or economy crisis. Banknotes in fire flame. Wealth
Free with trial A clean and modern isometric bar graph illustration. Three colored bars, blue, green, and yellow, represent data points with corresponding numerical values displayed above each bar. The graphic is set against a white background, making it suitable for various presentations, reports, or website designs related to data analysis, business, or education. The simple design offers a clear visual representation of data comparison. Decrease business concept illustrations Isometric Bar Graph Illustrating Data and Statistics. A clean and modern isometric bar graph illustration. Three colored bars, blue, green, and yellow, represent data points with corresponding numerical values displayed above each bar. The graphic is set against a white background, making it suitable for various presentations, reports, or website designs related to data analysis, business, or education. The simple design offers a clear visual representation of data comparison.
Free with trial A shiny golden arrow forms a path that initially moves upward, then dips down, and finally turns upward again, presented in a 3D render against a clean white background. This abstract representation symbolizes financial growth, market fluctuations, and business progress. Decrease business concept illustrations Golden Arrow Graph Showing Upward Trend and Downturn on White Background chart. A shiny golden arrow forms a path that initially moves upward, then dips down, and finally turns upward again, presented in a 3D render against a clean white background. This abstract representation symbolizes financial growth, market fluctuations, and business progress
Free with trial Currency depreciation. Visual elements showcase currency symbols, stackable coins, and a sad face indicating economic instability. Currency depreciation impacts markets, finance, global economy. Decrease business concept illustrations Currency Depreciation Concept with Growing Coins and Sad Face Symbol. Currency depreciation. Visual elements showcase currency symbols, stackable coins, and a sad face indicating economic instability. Currency depreciation impacts markets, finance, global economy
Free with trial Upward and downward arrows next to stacked coins and watering can. Ideal for economy, investment, growth, savings, financial strategy, productivity, management. Simple flat metaphor. Decrease business concept vectors Financial growth and investment concept with coins, watering can, and arrows. Upward and downward arrows next to stacked coins and watering can. Ideal for economy, investment, growth, savings, financial strategy, productivity, management. Simple flat metaphor
Free with trial A 3D bar chart rendered in a vibrant pink color illustrates a downward trend. The bars decrease in height from left to right, representing a decline in data or performance. A thick pink arrow with a sharp point follows the descending path of the bars, reinforcing the concept of a decrease. The chart is presented in isolation against a clean white background, making the visual elements stand out. Decrease business concept illustrations Pink Bar Chart with a Downward Trending Arrow Symbolizing Decline graph magenta. A 3D bar chart rendered in a vibrant pink color illustrates a downward trend. The bars decrease in height from left to right, representing a decline in data or performance. A thick pink arrow with a sharp point follows the descending path of the bars, reinforcing the concept of a decrease. The chart is presented in isolation against a clean white background, making the visual elements stand out
Free with trial This 3D render visually represents a financial crisis or economic recession. Four stacks of gold coins, decreasing in height from left to right, are depicted. A prominent red arrow, symbolizing a downward trend, points towards the smallest coin stack, emphasizing a significant decline. The clean, minimalist background with a reflective surface enhances the focus on the financial concept. This image is ideal for illustrating concepts like market crash, investment loss, bankruptcy, or economic instability. Decrease business concept vectors Financial Downturn: Declining Coin Stacks and Red Arrow. This 3D render visually represents a financial crisis or economic recession. Four stacks of gold coins, decreasing in height from left to right, are depicted. A prominent red arrow, symbolizing a downward trend, points towards the smallest coin stack, emphasizing a significant decline. The clean, minimalist background with a reflective surface enhances the focus on the financial concept. This image is ideal for illustrating concepts like market crash, investment loss, bankruptcy, or economic instability.
Free with trial Environmental awareness, carbon footprint reduction, renewable energy, climate change, sustainable living, eco-conscious habits. Factory emitting smoke, CO2 footprint, person promoting greenery. Decrease business concept vectors Reducing Carbon Footprint Concept with Factory Emissions, Sustainability, and Individual Environmental Action. Environmental awareness, carbon footprint reduction, renewable energy, climate change, sustainable living, eco-conscious habits. Factory emitting smoke, CO2 footprint, person promoting greenery
Free with trial A professional 3D rendering of a bar chart representing a negative trend or financial loss. The illustration features three textured blue metallic columns with a prominent, jagged red arrow pointing downwards across them. This graphic symbolizes economic recession, market crashes, or decreasing sales figures. It is mounted on a sleek grey base and isolated on a white background, making it perfect for business presentations, investment risk analysis, and economic reports. Decrease business concept vectors 3D Downward Bar Chart with Red Arrow - Financial Loss & Recession Concept. A professional 3D rendering of a bar chart representing a negative trend or financial loss. The illustration features three textured blue metallic columns with a prominent, jagged red arrow pointing downwards across them. This graphic symbolizes economic recession, market crashes, or decreasing sales figures. It is mounted on a sleek grey base and isolated on a white background, making it perfect for business presentations, investment risk analysis, and economic reports.
Free with trial This graphic depicts supply and demand curves balanced by a scale, illustrating economic principles and market equilibrium. It's suitable for business presentations and educational materials. Decrease business concept vectors Supply and demand graph with balance scale illustration. This graphic depicts supply and demand curves balanced by a scale, illustrating economic principles and market equilibrium. It's suitable for business presentations and educational materials
Free with trial A dynamic digital illustration of a financial chart on a dark, high-tech background. The image features two contrasting lines: a vibrant green line trending upwards with an arrow, symbolizing growth, profit, and success, and a blue line moving downwards with an arrow, representing decline, loss, and risk. Glowing data points and a network grid enhance the futuristic feel. This versatile graphic is perfect for concepts related to stock market analysis, business performance, investment volatility, economic forecasting, big data, and financial technology (fintech). Decrease business concept illustrations Futuristic Financial Graph with Growth and Decline Arrows. A dynamic digital illustration of a financial chart on a dark, high-tech background. The image features two contrasting lines: a vibrant green line trending upwards with an arrow, symbolizing growth, profit, and success, and a blue line moving downwards with an arrow, representing decline, loss, and risk. Glowing data points and a network grid enhance the futuristic feel. This versatile graphic is perfect for concepts related to stock market analysis, business performance, investment volatility, economic forecasting, big data, and financial technology (fintech).
Free with trial A 3D illustration of a financial chart showing a dramatic downward trend. A large red arrow points sharply down over a series of declining blue bar graphs, symbolizing a stock market crash, economic recession, or business failure. The background features complex data and grids, representing financial analysis and market data. This image is perfect for concepts related to economic crisis, investment loss, financial risk, bankruptcy, and negative business reports. Decrease business concept illustrations Stock Market Crash Financial Graph. A 3D illustration of a financial chart showing a dramatic downward trend. A large red arrow points sharply down over a series of declining blue bar graphs, symbolizing a stock market crash, economic recession, or business failure. The background features complex data and grids, representing financial analysis and market data. This image is perfect for concepts related to economic crisis, investment loss, financial risk, bankruptcy, and negative business reports.
Free with trial A minimalist 3D render featuring the number '5%' in a metallic gold finish, prominently displayed on a textured gold surface. To the right, a soft, gradient background transitions from a warm beige to a lighter cream, with a subtle vertical light strip adding depth. This image is ideal for representing discounts, interest rates, financial offers, or percentage-based promotions in marketing and business contexts. Decrease business concept illustrations Golden 5% Discount or Interest Rate with Soft Background. A minimalist 3D render featuring the number '5%' in a metallic gold finish, prominently displayed on a textured gold surface. To the right, a soft, gradient background transitions from a warm beige to a lighter cream, with a subtle vertical light strip adding depth. This image is ideal for representing discounts, interest rates, financial offers, or percentage-based promotions in marketing and business contexts.
Free with trial Conceptual line art depicting a decrease in gold prices. Decrease business concept illustrations Gold Price Drop Magnifying Glass Showing Decreasing Value. Conceptual line art depicting a decrease in gold prices.
Free with trial Icon collection with zero emission symbol concept. greenhouse gas carbon credit design set. protect ecological green vector silhouette. carbon net zero neutral natural. carbon footprint art pictogram. Decrease business concept vectors Icon collection with zero emissions esg symbol concept. greenhouse gas carbon credit design set. protect ecological. Icon collection with zero emission symbol concept. greenhouse gas carbon credit design set. protect ecological green vector silhouette. carbon net zero neutral natural. carbon footprint art pictogram.
Free with trial Icon collection with zero emission symbol concept. greenhouse gas carbon credit design set. protect ecological green vector silhouette. carbon net zero neutral natural. carbon footprint art pictogram. Decrease business concept vectors Icon collection with zero emissions esg symbol concept. greenhouse gas carbon credit design set. protect ecological. Icon collection with zero emission symbol concept. greenhouse gas carbon credit design set. protect ecological green vector silhouette. carbon net zero neutral natural. carbon footprint art pictogram.
Free with trial Net zero and ESG strategy concept with wooden blocks and sustainability icons representing carbon reduction, renewable energy, environmental responsibility and corporate sustainability goals. Decrease business concept illustrations Net zero and ESG strategy concept with wooden blocks and sustainability icons representing carbon reduction, renewable energy
Free with trial A 3D icon depicts a financial graph. The icon features a rounded purple square with a lighter purple top edge. Inside, a yellow line chart with circular data points shows an upward trend, overlaid on a series of yellow vertical bars representing a bar chart. The overall design is clean and modern, symbolizing data analysis, business growth, and financial performance. Decrease business concept illustrations 3D icon representing a financial graph with bars and a line chart on a purple background. A 3D icon depicts a financial graph. The icon features a rounded purple square with a lighter purple top edge. Inside, a yellow line chart with circular data points shows an upward trend, overlaid on a series of yellow vertical bars representing a bar chart. The overall design is clean and modern, symbolizing data analysis, business growth, and financial performance
Free with trial A bold, red arrow with a zig-zag pattern points downwards, symbolizing a decline or negative trend. The arrow is rendered in a 3D style with subtle shading, giving it depth. It is isolated on a transparent background, making it versatile for various design applications. This graphic is ideal for representing financial losses, market downturns, declining performance, or any concept associated with a downward trajectory. Decrease business concept illustrations Red Downward Trend Arrow. A bold, red arrow with a zig-zag pattern points downwards, symbolizing a decline or negative trend. The arrow is rendered in a 3D style with subtle shading, giving it depth. It is isolated on a transparent background, making it versatile for various design applications. This graphic is ideal for representing financial losses, market downturns, declining performance, or any concept associated with a downward trajectory.
Free with trial A bold, three-dimensional red arrow forms a jagged downward trend, symbolizing decline, loss, or negative performance. The arrow's sharp angles and bright red color convey urgency and a significant downturn. Isolated on a clean white background, this graphic is versatile for illustrating financial losses, market crashes, declining statistics, or any concept related to a negative trajectory. Its minimalist design makes it suitable for presentations, reports, and digital media. Decrease business concept illustrations Red Downward Trend Arrow. A bold, three-dimensional red arrow forms a jagged downward trend, symbolizing decline, loss, or negative performance. The arrow's sharp angles and bright red color convey urgency and a significant downturn. Isolated on a clean white background, this graphic is versatile for illustrating financial losses, market crashes, declining statistics, or any concept related to a negative trajectory. Its minimalist design makes it suitable for presentations, reports, and digital media.
Free with trial The image shows a close-up of several wooden blocks arranged in a row. Each block displays a percentage symbol or an arrow indicating a downward trend, suggesting a visual representation of decreasing interest rates or economic downturn. The focus is on the concept of declining percentages. Decrease business concept illustrations Wooden blocks showing percentage drop. The image shows a close-up of several wooden blocks arranged in a row. Each block displays a percentage symbol or an arrow indicating a downward trend, suggesting a visual representation of decreasing interest rates or economic downturn. The focus is on the concept of declining percentages
Free with trial Orange bar chart showing progressive data decline paired with a sad face icon suggesting disappointment. Ideal for business loss, failure, negative feedback, underperformance, worry, challenges. Decrease business concept vectors Bar Chart with Declining Data and Sad Face Icon Representing Negative Trends. Orange bar chart showing progressive data decline paired with a sad face icon suggesting disappointment. Ideal for business loss, failure, negative feedback, underperformance, worry, challenges
Free with trial Economic decline, financial loss, market trends, business analysis, payment reminder, schedule planning. Downward trend graph with sad face icon. Economic decline and financial loss. Decrease business concept vectors Economic Decline and Financial Trends with Calendar Reminder and Graph Symbols. Economic decline, financial loss, market trends, business analysis, payment reminder, schedule planning. Downward trend graph with sad face icon. Economic decline and financial loss
Free with trial A clean, minimalist icon representing the stock market. The image features a bull and a bear, symbolizing market trends, with a rising green arrow indicating an upward trend. The design is enclosed in a circular frame, suitable for financial reports, investment presentations, or business infographics. The simple line art style makes it versatile for various applications. Decrease business concept illustrations Stock Market Bull and Bear Trend Icon. A clean, minimalist icon representing the stock market. The image features a bull and a bear, symbolizing market trends, with a rising green arrow indicating an upward trend. The design is enclosed in a circular frame, suitable for financial reports, investment presentations, or business infographics. The simple line art style makes it versatile for various applications.