Free with trial An upset stickman faces a decreasing profits presented on a whiteboard with a colleague giving explanations isolated on a white background perfect for business concepts, financial analysis and. Decrease business concept illustrations Upset Stickman Faces Decreasing Profits on a Whiteboard Presentation with Colleague Giving Explanations in a Black and White. An upset stickman faces a decreasing profits presented on a whiteboard with a colleague giving explanations isolated on a white background perfect for business concepts, financial analysis and
Free with trial Hand points at stock chart data on a bright screen, suggesting market analysis This visual is ideal for financial business content. Decrease business concept illustrations Analyzing Stock Market Data on Screen with Hand Pointing to Chart. Hand points at stock chart data on a bright screen, suggesting market analysis This visual is ideal for financial business content
Free with trial Concept of decline and decrease. Red arrow showing downward trend, falling graph, negative movement. Decrease business concept vectors Red arrow pointing downwards staircase falling graph. Concept of decline and decrease. Red arrow showing downward trend, falling graph, negative movement
Free with trial Series bars shrink left to right. Bold arrow points downward. Strong visual drop emphasis. Business decline concept. Decrease business concept vectors Downward trend bar chart with falling arrow graphic illustration. Series bars shrink left to right. Bold arrow points downward. Strong visual drop emphasis. Business decline concept
Free with trial A 3D rendered image of a shiny red arrow pointing downwards, standing on a metallic circular base, isolated on a white background. The arrow is reflective and has a glossy finish, giving it a modern and sleek appearance. This image can be used to represent decline, decrease, or downward trend in various contexts such as finance, statistics, or presentations. Decrease business concept illustrations Red Arrow Down Symbol on Metallic Base. A 3D rendered image of a shiny red arrow pointing downwards, standing on a metallic circular base, isolated on a white background. The arrow is reflective and has a glossy finish, giving it a modern and sleek appearance. This image can be used to represent decline, decrease, or downward trend in various contexts such as finance, statistics, or presentations.
Free with trial White clouds illustrate CO2 levels. Green arrows show reduction, culminating in a smaller CO2 cloud with a leaf, symbolizing environmental progress. Clean, hopeful aesthetic. Decrease business concept illustrations Carbon Footprint Reduction: A Minimalist Visual Guide to CO2 Emission Decrease. White clouds illustrate CO2 levels. Green arrows show reduction, culminating in a smaller CO2 cloud with a leaf, symbolizing environmental progress. Clean, hopeful aesthetic
Free with trial Red bar chart depicting a downward trend on a white background. The bars progressively decrease in height from left to right. An upward-pointing arrow emerges from the first bar, indicating initial growth. A curved, downward-pointing arrow overlays the bars, emphasizing the overall decline. The clear design conveys concepts of financial loss, decreasing statistics, or declining data points. Decrease business concept vectors Red bar chart showing a downward trend with an upward arrow and a falling arrow isolated on white background. Red bar chart depicting a downward trend on a white background. The bars progressively decrease in height from left to right. An upward-pointing arrow emerges from the first bar, indicating initial growth. A curved, downward-pointing arrow overlays the bars, emphasizing the overall decline. The clear design conveys concepts of financial loss, decreasing statistics, or declining data points.
Free with trial A red arrow shaped like a declining graph illustrates a downward trend. This image can be used to represent financial loss, market crashes, or negative performance in business and economics. Decrease business concept illustrations Downward Trend Graph Red Arrow Decline. A red arrow shaped like a declining graph illustrates a downward trend. This image can be used to represent financial loss, market crashes, or negative performance in business and economics
Free with trial Red declining stock market graph over a world map on a white background. Concept of global financial crisis. 3D Rendering. Decrease business concept illustrations Red declining stock market graph on white background. 3D Rendering. Red declining stock market graph over a world map on a white background. Concept of global financial crisis. 3D Rendering
Free with trial A bold, three-dimensional blue arrow is depicted pointing downwards and to the right, indicating a downward trend. The arrow has a sharp, angular design, suggesting a sharp decline or a significant drop. It is presented in isolation against a clean white background, making it a clear and direct visual representation of negative movement, loss, or a declining trend in various contexts such as. Decrease business concept illustrations Blue downward trending arrow on white background decline decrease. A bold, three-dimensional blue arrow is depicted pointing downwards and to the right, indicating a downward trend. The arrow has a sharp, angular design, suggesting a sharp decline or a significant drop. It is presented in isolation against a clean white background, making it a clear and direct visual representation of negative movement, loss, or a declining trend in various contexts such as
Free with trial A hand holds a smartphone displaying a falling red arrow, symbolizing investment loss during a financial crisis. Stacked gold coins visually represent wealth reduction and the impact of a stock market crash or economic decline. This 3D rendering illustrates business failure, debt, and the negative trend of online trading in a recession, suitable for illustrating financial risk, bankruptcy, or. Decrease business concept illustrations Hand holding smartphone with falling red arrow and coin stacks financial crisis. A hand holds a smartphone displaying a falling red arrow, symbolizing investment loss during a financial crisis. Stacked gold coins visually represent wealth reduction and the impact of a stock market crash or economic decline. This 3D rendering illustrates business failure, debt, and the negative trend of online trading in a recession, suitable for illustrating financial risk, bankruptcy, or
Free with trial A visual representation of the indian economy facing a crisis, showing a downward trend on a graph against the backdrop of india's map, symbolizing financial recession and market decline. Decrease business concept illustrations India economy crisis financial recession india map chart graph business market investment stock market down trend. a visual representation of the indian economy facing a crisis, showing a downward trend on a graph against the backdrop of india's map, symbolizing financial recession and market decline.
Free with trial Financial Decline Concept with Green Calculator and Downward Arrow Sign. Decrease business concept illustrations Financial Decline Concept with Green Calculator and Downward Arrow Sign
Free with trial Single oil barrel casting shadow of downward financial chart, symbolizing falling oil prices, market decline, reduced demand, and economic downturn concept. Generative AI. Decrease business concept illustrations Oil Barrel Casting Falling Market Shadowgraph. Single oil barrel casting shadow of downward financial chart, symbolizing falling oil prices, market decline, reduced demand, and economic downturn concept. Generative AI
Free with trial Concept image of a jagged downward arrow hitting black liquid with ripples, representing market crash, financial loss, or economic decline. Generative AI. Decrease business concept illustrations Zigzag Arrow Falling Into Dark Liquid Surface. Concept image of a jagged downward arrow hitting black liquid with ripples, representing market crash, financial loss, or economic decline. Generative AI
Free with trial This 3D illustration features a vertical bar graph with columns of varying heights, indicating a clear decline in performance. Bright red arrows point downward, emphasizing the negative trend and loss of value. The clean, minimalist design uses a simple color palette against a neutral background, making it ideal for financial or business presentations. Decrease business concept vectors A three dimensional bar chart showing a downward trend with red arrows. This 3D illustration features a vertical bar graph with columns of varying heights. This 3D illustration features a vertical bar graph with columns of varying heights, indicating a clear decline in performance. Bright red arrows point downward, emphasizing the negative trend and loss of value. The clean, minimalist design uses a simple color palette against a neutral background, making it ideal for financial or business presentations
Free with trial A black dollar sign with a downward arrow, symbolizing financial decrease or cost reduction. Decrease business concept illustrations Black dollar sign with downward arrow icon. A black dollar sign with a downward arrow, symbolizing financial decrease or cost reduction
Free with trial Three vibrant green arrows point downwards, each adorned with a white percentage symbol, visually representing a decline in rates or financial losses. Evokes concepts of sales, discounts, and market trends. Decrease business concept illustrations Green downward arrows symbolizing percentage decrease and financial loss isolated on white background. Three vibrant green arrows point downwards, each adorned with a white percentage symbol, visually representing a decline in rates or financial losses. Evokes concepts of sales, discounts, and market trends
Free with trial A bright red downward-pointing arrow is positioned directly above a shiny gold coin. The coin features a prominent dollar sign in its center. The image is set against a stark white background, emphasizing the symbolic representation of a financial decrease or a drop in currency value. Decrease business concept illustrations Red Downward Arrow Pointing Towards a Gold Coin with Dollar Sign down arrow red arrow. A bright red downward-pointing arrow is positioned directly above a shiny gold coin. The coin features a prominent dollar sign in its center. The image is set against a stark white background, emphasizing the symbolic representation of a financial decrease or a drop in currency value
Free with trial The a 3D rendering of a blue arrow rising diagonally from the lower left to the upper right, positioned above a series of white cubes arranged in ascending order. The cubes decrease in size as they move toward the arrow's base, creating a sense of progression and growth. The background is a solid light blue color, providing contrast to the white cubes and the blue arrow. The overall style is clean. Decrease business concept illustrations 3 d blue arrow rising over white ascending cubes, growth chart concept. The a 3D rendering of a blue arrow rising diagonally from the lower left to the upper right, positioned above a series of white cubes arranged in ascending order. The cubes decrease in size as they move toward the arrow's base, creating a sense of progression and growth. The background is a solid light blue color, providing contrast to the white cubes and the blue arrow. The overall style is clean
Free with trial A stick figure businessman in a suit and tie looks worried and confused while holding a tablet displaying a downward-trending graph. The man has a question mark above his head, indicating confusion or concern about the negative financial data. This image can be used to illustrate financial loss, business failure, economic downturn, or market crash. Decrease business concept vectors Stick Figure Businessman with Falling Graph. A stick figure businessman in a suit and tie looks worried and confused while holding a tablet displaying a downward-trending graph. The man has a question mark above his head, indicating confusion or concern about the negative financial data. This image can be used to illustrate financial loss, business failure, economic downturn, or market crash.
Free with trial This vibrant 3D bar graph features various colorful bars with an upward arrow, symbolizing growth and success in financial and business metrics Generative Ai. Decrease business concept illustrations Colorful 3D Bar Graph Showing Growth with Upward Arrow Design. This vibrant 3D bar graph features various colorful bars with an upward arrow, symbolizing growth and success in financial and business metrics Generative Ai
Free with trial A hand-drawn illustration featuring a large percentage symbol at the center, surrounded by various financial and business-related doodles. Icons include bar charts, pie charts, stacks of coins, a calculator, dollar signs, and numerous arrows indicating direction, flow, or change. The style is simple, black and white line art, suitable for representing concepts like finance, economics, growth, discounts, and business analysis. Decrease business concept illustrations Doodle Financial Icons and Percentage Symbol. A hand-drawn illustration featuring a large percentage symbol at the center, surrounded by various financial and business-related doodles. Icons include bar charts, pie charts, stacks of coins, a calculator, dollar signs, and numerous arrows indicating direction, flow, or change. The style is simple, black and white line art, suitable for representing concepts like finance, economics, growth, discounts, and business analysis.
Free with trial Laptop with global market chart showing falling red candlesticks, world map on dark background, concept of financial crisis and stock collapse. 3D Rendering. Decrease business concept illustrations Laptop displaying global stock market crash data with red downward candlestick chart on world map screen, symbolizing economic. Laptop with global market chart showing falling red candlesticks, world map on dark background, concept of financial crisis and stock collapse. 3D Rendering
Free with trial A clean and contemporary vector illustration of a downward-pointing arrow, rendered in varying shades of blue to create a subtle gradient effect. The arrow features a smooth, rounded top and a distinct, angular bottom, clearly indicating a downward direction. Isolated on a pure white background, this versatile graphic is ideal for conveying concepts such as download, navigation, decrease, or general directional cues in web design, mobile applications, presentations, and infographics. Its minimalist style ensures broad applicability across digital and print media. Decrease business concept vectors Modern Blue Downward Arrow Icon with Gradient. A clean and contemporary vector illustration of a downward-pointing arrow, rendered in varying shades of blue to create a subtle gradient effect. The arrow features a smooth, rounded top and a distinct, angular bottom, clearly indicating a downward direction. Isolated on a pure white background, this versatile graphic is ideal for conveying concepts such as download, navigation, decrease, or general directional cues in web design, mobile applications, presentations, and infographics. Its minimalist style ensures broad applicability across digital and print media.
Free with trial Glowing Blue Price Drop Arrows Showing Discounts, Sales Promotion Concept, illustration. Decrease business concept illustrations Glowing Blue Price Drop Arrows Showing Discounts, Sales Promotion Concept
Free with trial A hand presents a cost reduction graph with a downward trend, symbolizing financial efficiency and savings Used for business and economic presentations. Decrease business concept illustrations Showing Cost Reduction Graph on Hand for Financial Efficiency. A hand presents a cost reduction graph with a downward trend, symbolizing financial efficiency and savings Used for business and economic presentations
Free with trial A vibrant 3D render features two glowing neon signs against a dark brick wall. On the left, a bright green neon sign displays a plus symbol (+) enclosed in a circle, radiating a positive aura. On the right, a cool blue neon sign shows a minus symbol (-) within a circle, representing negativity or subtraction. The contrasting colors and symbols create a striking visual, perfect for illustrating concepts like choice, decision-making, pros and cons, or mathematical operations. This modern yet retro design is ideal for technology, business, or educational contexts. Decrease business concept illustrations Neon Plus and Minus Signs on Dark Brick Wall. A vibrant 3D render features two glowing neon signs against a dark brick wall. On the left, a bright green neon sign displays a plus symbol (+) enclosed in a circle, radiating a positive aura. On the right, a cool blue neon sign shows a minus symbol (-) within a circle, representing negativity or subtraction. The contrasting colors and symbols create a striking visual, perfect for illustrating concepts like choice, decision-making, pros and cons, or mathematical operations. This modern yet retro design is ideal for technology, business, or educational contexts.
Free with trial Colorful graphic depicts a percentage sign with upward and downward arrows and a dollar symbol, suggesting financial growth or change. This illustration is suitable for business presentations or financial reports. Decrease business concept vectors Percentage sign with arrows and dollar symbol. Colorful graphic depicts a percentage sign with upward and downward arrows and a dollar symbol, suggesting financial growth or change. This illustration is suitable for business presentations or financial reports
Free with trial Golden Bull Statue on Coins with Falling Arrows, Market Volatility Concept, illustration. Decrease business concept illustrations Golden Bull Statue on Coins with Falling Arrows, Market Volatility Concept
Free with trial A set of three distinct candlestick chart icons, rendered in a clean, flat vector style against a white background. The green candle typically represents a bullish trend or price increase, the red candle signifies a bearish trend or price decrease, and the gray candle can denote neutrality or indecision in the market. These versatile symbols are ideal for illustrating financial concepts, stock market analysis, trading platforms, investment apps, economic reports, and educational materials related to forex, cryptocurrency, and general business trends. Decrease business concept vectors Candlestick Chart Icons for Financial Analysis. A set of three distinct candlestick chart icons, rendered in a clean, flat vector style against a white background. The green candle typically represents a bullish trend or price increase, the red candle signifies a bearish trend or price decrease, and the gray candle can denote neutrality or indecision in the market. These versatile symbols are ideal for illustrating financial concepts, stock market analysis, trading platforms, investment apps, economic reports, and educational materials related to forex, cryptocurrency, and general business trends.
Free with trial A 3D rendered image displays a collection of business charts on a document. A colorful pie chart with six segments sits to the left of a bar graph with five vertical bars of varying heights and colors. A line graph with multiple colored lines is visible on the document below. The composition is set against a white background. Decrease business concept illustrations 3D Rendered Pie Chart Bar Graph and Line Graph on a Document data statistics. A 3D rendered image displays a collection of business charts on a document. A colorful pie chart with six segments sits to the left of a bar graph with five vertical bars of varying heights and colors. A line graph with multiple colored lines is visible on the document below. The composition is set against a white background
Free with trial A creative visual representation of the impact of tax increases on savings, featuring a hand holding a 'TAX' block above stacks of coins with percentage blocks, a jar of coins, and a house model in the background. Decrease business concept illustrations Tax Increase Concept with Coins and House Model. A creative visual representation of the impact of tax increases on savings, featuring a hand holding a 'TAX' block above stacks of coins with percentage blocks, a jar of coins, and a house model in the background.
Free with trial This graphic depicts a simple bar chart with two vertical bars. The left bar, colored blue, is shorter and labeled 'QUALITY' with an upward-pointing arrow, suggesting an increase. The right bar, colored green, is taller and labeled 'COST' with downward-pointing arrows, indicating a decrease. A diagonal arrow connects the top of the quality bar to the bottom of the cost bar, visually representing. Decrease business concept vectors Bar chart illustrating the inverse relationship between quality and cost. This graphic depicts a simple bar chart with two vertical bars. The left bar, colored blue, is shorter and labeled 'QUALITY' with an upward-pointing arrow, suggesting an increase. The right bar, colored green, is taller and labeled 'COST' with downward-pointing arrows, indicating a decrease. A diagonal arrow connects the top of the quality bar to the bottom of the cost bar, visually representing
Free with trial This graphic illustrates a sharp decline in financial value. A bold red line forms a jagged downward path, symbolizing a negative trend or loss. The line culminates in a red circle containing a white currency symbol, representing a monetary unit. The stark contrast between the red line and the white symbol against a clean white background emphasizes the concept of financial downturn and economic. Decrease business concept vectors A red downward trending graph with a coin symbol indicating financial loss. This graphic illustrates a sharp decline in financial value. A bold red line forms a jagged downward path, symbolizing a negative trend or loss. The line culminates in a red circle containing a white currency symbol, representing a monetary unit. The stark contrast between the red line and the white symbol against a clean white background emphasizes the concept of financial downturn and economic
Free with trial A stylized illustration depicts a downward trending graph alongside a factory and a person moving away, suggesting economic hardship and relocation, suitable for business reports and financial visuals. Decrease business concept vectors Economic decline graph with factory and person. A stylized illustration depicts a downward trending graph alongside a factory and a person moving away, suggesting economic hardship and relocation, suitable for business reports and financial visuals
Free with trial A conceptual illustration depicting a line graph, structured like a broken bridge, dramatically falling and sinking into the water. This powerful visual metaphor represents a severe economic downturn, financial crisis, stock market crash, or business failure. The collapsing structure plunging into the sea symbolizes recession, bankruptcy, overwhelming debt, and hitting rock bottom. The minimalist vector art style makes it a versatile image for presentations and articles on finance, risk, and economic collapse. Decrease business concept vectors Economic Downturn and Financial Crisis Concept. A conceptual illustration depicting a line graph, structured like a broken bridge, dramatically falling and sinking into the water. This powerful visual metaphor represents a severe economic downturn, financial crisis, stock market crash, or business failure. The collapsing structure plunging into the sea symbolizes recession, bankruptcy, overwhelming debt, and hitting rock bottom. The minimalist vector art style makes it a versatile image for presentations and articles on finance, risk, and economic collapse.
Free with trial A person is pointing at a graph with the word buy on it. The graph is showing a downward trend, which could indicate a decrease in stock prices or a decline in the market. Decrease business concept illustrations A person is pointing at a graph with the word buy on it
Free with trial This abstract image features a silhouette of a bar graph against a clean white background. The bars vary in height and width, creating a dynamic, wave-like pattern that rises towards the center and then gradually descends. The overall impression is one of growth, progress, or data visualization. This versatile graphic can be used for concepts related to business, finance, technology, statistics, or any subject requiring a visual representation of change and trends. Decrease business concept vectors Abstract Silhouette Bar Graph with Rising Trend. This abstract image features a silhouette of a bar graph against a clean white background. The bars vary in height and width, creating a dynamic, wave-like pattern that rises towards the center and then gradually descends. The overall impression is one of growth, progress, or data visualization. This versatile graphic can be used for concepts related to business, finance, technology, statistics, or any subject requiring a visual representation of change and trends.
Free with trial A clean, top-down view of a minimalist white control dial featuring simple up and down arrows. This modern interface symbolizes choice, decision-making, and the elegant simplicity of user-centric design in technology and business. Decrease business concept illustrations Minimalist Control Dial with Up and Down Arrows. A clean, top-down view of a minimalist white control dial featuring simple up and down arrows. This modern interface symbolizes choice, decision-making, and the elegant simplicity of user-centric design in technology and business
Free with trial A stylized illustration depicts a person struggling under the burden of a large dollar sign, with downward-pointing arrows suggesting financial pressure, ideal for business and economic concepts. Decrease business concept vectors Man carrying dollar sign weight with red arrows. A stylized illustration depicts a person struggling under the burden of a large dollar sign, with downward-pointing arrows suggesting financial pressure, ideal for business and economic concepts
Free with trial Red percentage symbol and downward arrow with graph line, minimalist style, white background, concept of decline or economic drop. 3D Rendering. Decrease business concept illustrations Red percentage symbol with downward arrow and graph line on white background. 3D Rendering. Red percentage symbol and downward arrow with graph line, minimalist style, white background, concept of decline or economic drop. 3D Rendering
Free with trial A 3D rendered blue arrow symbol, depicted as a zig-zag line with an arrowhead pointing downwards, signifies a negative trend or decline. The object is isolated on a clean white background, making it suitable for representing financial data, economic downturns, or performance metrics. Decrease business concept illustrations 3D Blue Arrow Graph Showing Downward Trend on White Background decrease. A 3D rendered blue arrow symbol, depicted as a zig-zag line with an arrowhead pointing downwards, signifies a negative trend or decline. The object is isolated on a clean white background, making it suitable for representing financial data, economic downturns, or performance metrics
Free with trial A conceptual image depicting a downward trend in the global economy and stock market, featuring a globe, gold coins, and a red declining graph line. Decrease business concept illustrations Global economy and stock market decline concept. A conceptual image depicting a downward trend in the global economy and stock market, featuring a globe, gold coins, and a red declining graph line
Free with trial Stack of gold coins with a red down arrow indicates market fall or investment loss Perfect for financial and economic downturn illustrations. Decrease business concept illustrations Declining Value Gold Coins Stack with Red Arrow Showing Decrease. Stack of gold coins with a red down arrow indicates market fall or investment loss Perfect for financial and economic downturn illustrations
Free with trial This minimalist vector illustration depicts a declining line chart against a clean background. The graphic features a prominent red arrow pointing downward, symbolizing a negative trend or financial loss. The composition uses a professional color palette of muted grays and a bold red accent to highlight the downward movement of the data points. Decrease business concept vectors A simple line graph showing a downward trend in business performance metrics. This minimalist vector illustration depicts a declining line chart against a clean background. The graphic features a prominent red arrow pointing downward, symbolizing a negative trend or financial loss. The composition uses a professional color palette of muted grays and a bold red accent to highlight the downward movement of the data points
Free with trial Conceptual image depicting a decrease in the value of gold. Decrease business concept illustrations Gold Price Drop Magnifying Glass on Falling Gold Value. Conceptual image depicting a decrease in the value of gold.
Free with trial Vector illustration of money losing value due to inflation. Represents decreased purchasing power, financial loss, and rising economic pressure. Decrease business concept vectors Money Losing Value Inflation Concept with Shrinking Currency Vector. Vector illustration of money losing value due to inflation. Represents decreased purchasing power, financial loss, and rising economic pressure
Free with trial This image shows a bag of money, coins, and a gear, symbolizing investment and financial growth. Arrows pointing down indicate a potential decrease or loss. Decrease business concept vectors Vector art of a bag of money with coins and a gear, representing investment and financial growth, with arrows pointing down. This image shows a bag of money, coins, and a gear, symbolizing investment and financial growth. Arrows pointing down indicate a potential decrease or loss
Free with trial A conceptual 3D illustration of cybersecurity and digital safety. Three blocks represent key components of a security strategy: a glowing shield for protection, a padlock for defense, and a chart showing risk reduction. This image symbolizes the implementation of robust defense mechanisms to mitigate online threats and protect sensitive data. The technological background with network lines and graphs highlights the context of information technology, data analysis, and modern security challenges. Ideal for illustrating topics on internet security, data privacy, and risk management. Decrease business concept illustrations Cybersecurity Defense and Risk Management Concept. A conceptual 3D illustration of cybersecurity and digital safety. Three blocks represent key components of a security strategy: a glowing shield for protection, a padlock for defense, and a chart showing risk reduction. This image symbolizes the implementation of robust defense mechanisms to mitigate online threats and protect sensitive data. The technological background with network lines and graphs highlights the context of information technology, data analysis, and modern security challenges. Ideal for illustrating topics on internet security, data privacy, and risk management.
Free with trial Illustrating economic crisis with a red chart breaking, showing decreasing financial stability. Perfect for themes of crisis, finance, business, and market fluctuations. The image is generated with the use of an AI. Decrease business concept illustrations Red chart showing falling and breaking bars. Illustrating economic crisis with a red chart breaking, showing decreasing financial stability. Perfect for themes of crisis, finance, business, and market fluctuations. The image is generated with the use of an AI
Free with trial A three-dimensional bar chart constructed from shiny golden bars depicts a clear downward trend. The bars decrease in height from left to right, creating a visual representation of decline or loss. The metallic gold material reflects light, giving the chart a polished and impactful appearance. The entire graphic is isolated on a clean white background, making the data visualization the sole focus. Decrease business concept illustrations Golden 3D bar chart showing a downward trend on a white background graph data. A three-dimensional bar chart constructed from shiny golden bars depicts a clear downward trend. The bars decrease in height from left to right, creating a visual representation of decline or loss. The metallic gold material reflects light, giving the chart a polished and impactful appearance. The entire graphic is isolated on a clean white background, making the data visualization the sole focus
Free with trial Carbon emission reduction concept with CO2 cloud icon protected by hands for environment protection, climate change, sustainability, green energy, carbon footprint control and eco friendly. Decrease business concept illustrations Carbon emission reduction concept with CO2 cloud icon protected by hands for environment protection, climate change
Free with trial Fuel pump nozzle with a red handle drips oil against a gray background, accompanied by a downward trend graph indicating a decrease in fuel prices. Decrease business concept illustrations Fuel pump nozzle with a red handle drips oil against a gray background
Free with trial A clean, minimalist 3D rendering of a descending bar graph composed of sleek, white rectangular prisms. The graph is set against a bright, neutral background, creating a modern and versatile image ideal for presentations, reports, or website design related to business, finance, or data visualization. The image offers a clean, uncluttered aesthetic. Decrease business concept illustrations Abstract White Bar Graph: Minimalist 3D Render. A clean, minimalist 3D rendering of a descending bar graph composed of sleek, white rectangular prisms. The graph is set against a bright, neutral background, creating a modern and versatile image ideal for presentations, reports, or website design related to business, finance, or data visualization. The image offers a clean, uncluttered aesthetic.
Free with trial A collection of six black depicting various business analytics charts and graphs, including bar charts, a pie chart, and line graphs on presentation boards. Decrease business concept vectors Black analytics chart and graph on white background. A collection of six black depicting various business analytics charts and graphs, including bar charts, a pie chart, and line graphs on presentation boards
Free with trial Symbolic representation of negative financial trends. Red and green arrows pointing downwards, signifying market downturn, loss, or reduction in value. Decrease business concept vectors Red and green down arrows symbolizing decrease and loss. Symbolic representation of negative financial trends. Red and green arrows pointing downwards, signifying market downturn, loss, or reduction in value
Free with trial Up and Down Arrows Choice Decision Direction Concept, illustration. Decrease business concept illustrations Up and Down Arrows Choice Decision Direction Concept
Free with trial A black and white circular icon depicting a bar chart with three bars of decreasing height. A diagonal arrow points downwards from the tallest bar to the shortest, indicating a downward trend or decline. The icon is set against a white background. Decrease business concept illustrations Black and White Icon of a Downward Trending Bar Chart in a Circle graph decrease. A black and white circular icon depicting a bar chart with three bars of decreasing height. A diagonal arrow points downwards from the tallest bar to the shortest, indicating a downward trend or decline. The icon is set against a white background
Free with trial A visual representation of economic downturn shows a declining graph, a downward arrow, and a falling coin, conveying a sense of loss and financial instability perfect for illustrating business reports or financial articles. Decrease business concept vectors Financial decline graph with downward arrow and coin. A visual representation of economic downturn shows a declining graph, a downward arrow, and a falling coin, conveying a sense of loss and financial instability perfect for illustrating business reports or financial articles
Free with trial High-quality 3D render of wooden blocks displaying a green upward arrow, black percentage symbol, and red downward arrow, symbolizing financial trends, interest rates, and economic changes for business and investment concepts. Decrease business concept vectors Interest rate trend wooden blocks up down percentage. High-quality 3D render of wooden blocks displaying a green upward arrow, black percentage symbol, and red downward arrow, symbolizing financial trends, interest rates, and economic changes for business and investment concepts
Free with trial A stark red downward arrow dominates this compelling graphic, set against a pristine white background. This impactful 3D render visualizes a decreasing trend, effectively representing economic downturns and financial losses. The image's concise nature makes it ideal for illustrating negative market performance, business losses, or budget reduction. Use this conceptual illustration to depict. Decrease business concept illustrations Declining trend represented by a red arrow on a white background depicting economic downturn or financial losses. A stark red downward arrow dominates this compelling graphic, set against a pristine white background. This impactful 3D render visualizes a decreasing trend, effectively representing economic downturns and financial losses. The image's concise nature makes it ideal for illustrating negative market performance, business losses, or budget reduction. Use this conceptual illustration to depict
Free with trial A businessman holds wooden blocks showing upward quality and downward cost, symbolizing effective management and business strategy. Decrease business concept illustrations Balancing Quality Up and Cost Down with Wooden Blocks. A businessman holds wooden blocks showing upward quality and downward cost, symbolizing effective management and business strategy
Free with trial A line graph depicting a downward trend, symbolizing a decline in performance, sales, or economic activity, often used in business and financial contexts. Decrease business concept vectors Vector art of a line graph showing a downward trend, , indicating a decline in performance, sales, or economic activity in a. A line graph depicting a downward trend, symbolizing a decline in performance, sales, or economic activity, often used in business and financial contexts
Free with trial Gray bar chart with red line graph and downward arrow, illustrating decline, decrease, loss, and negative trend. Decrease business concept vectors Bar chart with downward red arrow, symbolizing decline. Gray bar chart with red line graph and downward arrow, illustrating decline, decrease, loss, and negative trend
Free with trial Red arrow pointing downwards over decreasing stacks of gold coins on a white background. Concept of financial loss, decline. 3D Rendering. Decrease business concept illustrations Red arrow descending over stacks of coins on white background. 3D Rendering. Red arrow pointing downwards over decreasing stacks of gold coins on a white background. Concept of financial loss, decline. 3D Rendering
Free with trial A vivid red zig-zag arrow illustrates a downward trend, symbolizing financial decline, market volatility, or negative progress. This versatile graphic is perfect for business and finance presentations. Decrease business concept vectors Red zig zag arrow isolated on transparent background transparent background. A vivid red zig-zag arrow illustrates a downward trend, symbolizing financial decline, market volatility, or negative progress. This versatile graphic is perfect for business and finance presentations
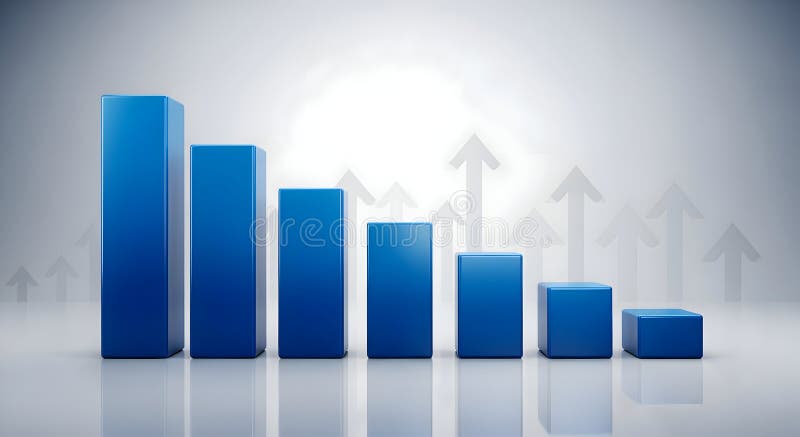
Free with trial A 3D render of a blue bar chart displaying a downward trend, with bars decreasing in height from left to right. The background features a subtle pattern of translucent upward-pointing arrows, suggesting growth or recovery despite the current decline. The scene is set against a clean, gradient gray backdrop with reflections, creating a modern and professional aesthetic. This image is ideal for representing financial downturns, market analysis, economic challenges, or the concept of overcoming obstacles. Decrease business concept illustrations Declining Blue Bar Chart with Upward Arrows Background. A 3D render of a blue bar chart displaying a downward trend, with bars decreasing in height from left to right. The background features a subtle pattern of translucent upward-pointing arrows, suggesting growth or recovery despite the current decline. The scene is set against a clean, gradient gray backdrop with reflections, creating a modern and professional aesthetic. This image is ideal for representing financial downturns, market analysis, economic challenges, or the concept of overcoming obstacles.
Free with trial A businessman showcases a glowing graphic signifying the relationship between rising quality and decreasing cost, emphasizing the importance of strategic management in business. Qubit. Decrease business concept illustrations Businessman presenting a graphic illustration of quality rising and cost decreasing, symbolizing effective management. A businessman showcases a glowing graphic signifying the relationship between rising quality and decreasing cost, emphasizing the importance of strategic management in business. Qubit
Free with trial Minimalist teal arrow points downward against soft blue background. Clean symbol indicates direction, decline, downward trend. Useful for concepts like sales decrease, loss reduction. Decrease business concept illustrations Minimalist teal arrow points downward against soft blue background. Clean symbol indicates direction, decline, downward trend.
Free with trial Smartphone with Downward Arrow Financial Decline Concept, illustration. Decrease business concept vectors Smartphone with Downward Arrow Financial Decline Concept
Free with trial A minimalist black and white icon representing a bar graph. The graph features several vertical bars of varying heights, arranged in a sequence that initially ascends to a peak and then descends. This versatile graphic symbolizes data, statistics, growth, decline, trends, and analysis. Its clean design makes it suitable for presentations, reports, websites, and applications related to finance, business, technology, and research. Decrease business concept vectors Black Bar Graph Icon with Ascending and Descending Bars. A minimalist black and white icon representing a bar graph. The graph features several vertical bars of varying heights, arranged in a sequence that initially ascends to a peak and then descends. This versatile graphic symbolizes data, statistics, growth, decline, trends, and analysis. Its clean design makes it suitable for presentations, reports, websites, and applications related to finance, business, technology, and research.
Free with trial A dynamic 3D visualization of financial data, featuring an upward trending blue arrow graph, a series of white and blue bar graphs, and two pie charts. The composition is set against a dark blue, grid-like background, symbolizing data analysis, business growth, and financial success. This image is ideal for presentations, reports, and websites related to finance, economics, and market trends. Decrease business concept illustrations 3D Financial Growth Chart with Pie Charts and Bar Graph. A dynamic 3D visualization of financial data, featuring an upward trending blue arrow graph, a series of white and blue bar graphs, and two pie charts. The composition is set against a dark blue, grid-like background, symbolizing data analysis, business growth, and financial success. This image is ideal for presentations, reports, and websites related to finance, economics, and market trends.
Free with trial This is an isometric 3D illustration depicting a dynamic data visualization. It features a combination of bar charts and a line graph, showcasing rising trends and fluctuating data points. The color palette includes shades of blue, teal, and coral, creating a modern and professional aesthetic. This graphic is ideal for representing financial reports, business analytics, market trends, growth, and performance metrics in a visually engaging and easy-to-understand format. Decrease business concept illustrations Isometric 3D Bar and Line Graph with Data Visualization. This is an isometric 3D illustration depicting a dynamic data visualization. It features a combination of bar charts and a line graph, showcasing rising trends and fluctuating data points. The color palette includes shades of blue, teal, and coral, creating a modern and professional aesthetic. This graphic is ideal for representing financial reports, business analytics, market trends, growth, and performance metrics in a visually engaging and easy-to-understand format.
Free with trial Red financial graph with bars and lines depicting a market decline. Isolated on a white background. Concept of financial crisis and recession. 3D Rendering. Decrease business concept illustrations Red financial graph showing market decline on white background. 3D Rendering. Red financial graph with bars and lines depicting a market decline. Isolated on a white background. Concept of financial crisis and recession. 3D Rendering
Free with trial A pyramid-like stack of six colorful building blocks, each featuring a white percentage symbol. The blocks are arranged in a stable formation on a clean white background. The colors include orange, yellow, green, turquoise, and blue, creating a vibrant and visually engaging composition related to finance and business. Decrease business concept illustrations Stack of Colorful Building Blocks with Percentage Symbols on White Background lego. A pyramid-like stack of six colorful building blocks, each featuring a white percentage symbol. The blocks are arranged in a stable formation on a clean white background. The colors include orange, yellow, green, turquoise, and blue, creating a vibrant and visually engaging composition related to finance and business
Free with trial A collection of Indian Rupee symbols presented in circular and square icons, some featuring downward-pointing arrows indicating a decrease in value. A stack of golden coins is also depicted. The icons are arranged in a grid on a white background. Decrease business concept illustrations Indian Rupee Currency Symbols with Downward Arrows and Stacked Coins money finance. A collection of Indian Rupee symbols presented in circular and square icons, some featuring downward-pointing arrows indicating a decrease in value. A stack of golden coins is also depicted. The icons are arranged in a grid on a white background
Free with trial Red percentage symbols and arrows indicate financial growth and decline. Abstract concept for sales, discounts, or market fluctuations. Decrease business concept vectors Red percentage signs and arrows pointing up and down upwards. Red percentage symbols and arrows indicate financial growth and decline. Abstract concept for sales, discounts, or market fluctuations
Free with trial Financial Decline Bar Chart Downward Arrow Crisis Concept, illustration. Decrease business concept illustrations Financial Decline Bar Chart Downward Arrow Crisis Concept