Free with trial Sharp downward trend line on graph red color rapid freefall business Ideal for websites and social media. Decrease business graph illustrations Sharp downward trend line on graph, red color, rapid, freefall, business. Sharp downward trend line on graph red color rapid freefall business Ideal for websites and social media
Free with trial Laptop Displaying Decreasing Graph, Business Downturn Visualization, Economic Recession Concept. Decrease business graph vectors Laptop Displaying Decreasing Graph, Business Downturn Visualization, Economic Recession Concept
Free with trial Declining business graph with downward trend line and colorful bars for financial loss concept, illustration. Decrease business graph vectors Declining business graph with downward trend line and colorful bars for financial loss concept
Free with trial A minimalist 3D rendered white graph depicting a sharp downward trend with jagged peaks and valleys. The graph is isolated on a white background, casting a subtle shadow. The visual represents a decline or decrease, suitable for concepts related to finance, economics, or data analysis. Decrease business graph illustrations White 3D Jagged Line Graph Showing Decline Isolated on White Background chart decrease. A minimalist 3D rendered white graph depicting a sharp downward trend with jagged peaks and valleys. The graph is isolated on a white background, casting a subtle shadow. The visual represents a decline or decrease, suitable for concepts related to finance, economics, or data analysis
Free with trial Simple line art business icons set featuring a magnifying glass, minus symbol, pie chart, and rising bar graph for financial data analysis. Decrease business graph illustrations Simple line art business icons set featuring a magnifying glass, minus symbol, pie chart, and rising bar graph for
Free with trial The image depicts a 3D bar graph with three orange bars of varying heights. A blue arrow curves downward from left to right, pointing to the percentage symbol on the right side of the image. The graph appears to illustrate a substantial decrease in percentage, likely representing a decline in data or performance. The background is a plain white surface, allowing the graph and its elements to take. Decrease business graph illustrations A bar graph showing a significant decrease in percentage. The image depicts a 3D bar graph with three orange bars of varying heights. A blue arrow curves downward from left to right, pointing to the percentage symbol on the right side of the image. The graph appears to illustrate a substantial decrease in percentage, likely representing a decline in data or performance. The background is a plain white surface, allowing the graph and its elements to take
Free with trial Outline bar chart icon with upward and downward trend arrow. Uptrend and downtrend business graph symbol vector. Decrease business graph vectors Outline bar chart icon with upward and downward trend arrow. Uptrend and downtrend business graph symbol
Free with trial A 3D illustration of a red arrow pointing downward on a graph, indicating a decline or negative trend in business, finance, or economy. The image represents a decrease or loss in value, and can be used to symbolize a crisis, recession, or failure. Decrease business graph illustrations A red arrow pointing downward on a graph indicating a decline. A 3D illustration of a red arrow pointing downward on a graph, indicating a decline or negative trend in business, finance, or economy. The image represents a decrease or loss in value, and can be used to symbolize a crisis, recession, or failure.
Free with trial Illustration of an angry boy holding a graph showing declining performance, representing business failure and loss. The image conveys frustration and disappointment with negative financial results and market downturns. Decrease business graph vectors Angry Boy with Falling Graph Business Failure, Loss Concept. Illustration of an angry boy holding a graph showing declining performance, representing business failure and loss. The image conveys frustration and disappointment with negative financial results and market downturns.
Free with trial Abstract pastel color blocks forming a bar graph on a pink base. Ideal for presentations and reports illustrating business growth or statistical data. Decrease business graph illustrations Colorful 3D Bar Chart Graph on Pink Base, Business Data Visualization. Abstract pastel color blocks forming a bar graph on a pink base. Ideal for presentations and reports illustrating business growth or statistical data.
Free with trial Business analytics concept showing quality up and cost down balance with rising and falling bar graph over keyboard. Financial performance analysis data , profit optimization and business decision. Decrease business graph illustrations Business analytics concept showing quality up and cost down balance with rising and falling bar graph over keyboard. Financial
Free with trial A business report illustration featuring a graph and chart, ideal for presentations and documents, conveying financial data and analysis in a clear and concise manner. Decrease business graph vectors Illustration of business report with graph and chart, showcasing financial data and analysis for presentations and documents. A business report illustration featuring a graph and chart, ideal for presentations and documents, conveying financial data and analysis in a clear and concise manner
Free with trial Dual trend line graph bar business growth and decline visualization. Decrease business graph vectors Profit growth and loss decline business graph bar. Dual trend line graph bar business growth and decline visualization
Free with trial Decline investment color line icon. Vector graph of cost reduction and financial decrease with down red arrow and money. Economy, business, finance crisis, stock market crash, bankruptcy outline sign. Decrease business graph vectors Decline investment arrow graph color line icon. Decline investment color line icon. Vector graph of cost reduction and financial decrease with down red arrow and money. Economy, business, finance crisis, stock market crash, bankruptcy outline sign
Free with trial Business Graph Declining Trend Downward Arrow Arrow Symbol Graph Statistics. Decrease business graph vectors Business Graph Declining Trend Downward Arrow Arrow Symbol Graph Statistics
Free with trial Declining Bar Graph with Downward Arrow Showing Loss or Decrease. Decrease business graph vectors Declining Bar Graph with Downward Arrow Showing Loss or Decrease
Free with trial Declining Bar Graph with Arrow Shows Downtrend and Loss in Business. Decrease business graph vectors Declining Bar Graph with Arrow Shows Downtrend and Loss in Business
Free with trial Graph and Chart icon set. Containing data, increase, growth, pie chart, data analytics, business and more. Vector graph icon set. Decrease business graph vectors Graph and Chart icon set. Containing data, increase, growth, pie chart, data analytics, business and more.
Free with trial A bar graph shows decreasing values with a downward trending arrow representing business failure and economic loss. Decrease business graph vectors Declining Bar Graph with Downward Arrow: Business Loss and Failure. A bar graph shows decreasing values with a downward trending arrow representing business failure and economic loss.
Free with trial Hand-drawn graph of business progress, with upward and downward arrows. Decrease business graph vectors Hand-drawn graph of business progress, with upward and downward arrows
Free with trial A visually appealing bar graph illustration against a sleek black background, showcasing business growth, data analysis, and statistical trends. The illustration is suitable for presentations, reports, and web content related to finance, marketing, and technology. Decrease business graph illustrations Bar Graph Illustration Business Growth, Data Analysis, and Statistics. A visually appealing bar graph illustration against a sleek black background, showcasing business growth, data analysis, and statistical trends. The illustration is suitable for presentations, reports, and web content related to finance, marketing, and technology.
Free with trial Decline investment color line icon. Vector graph of cost reduction and financial decrease with down red arrow and money. Economy, business, finance crisis, stock market crash, bankruptcy outline sign. Decrease business graph illustrations Decline investment arrow graph color line icon. Decline investment color line icon. Vector graph of cost reduction and financial decrease with down red arrow and money. Economy, business, finance crisis, stock market crash, bankruptcy outline sign
Free with trial A businessman in a suit is drawing a downward sloping graph illustrating the decline of profits against the rise of costs the image represents financial challenges business downturns and the need for cost reduction strategies for improved profitability. Decrease business graph illustrations Business person drawing a graph representing financial decline and reduced profits due to cost. A businessman in a suit is drawing a downward sloping graph illustrating the decline of profits against the rise of costs the image represents financial challenges business downturns and the need for cost reduction strategies for improved profitability
Free with trial Pencil draws diagram with line going down on checkered paper. Falling graph, business decline concept. Investment risk. Market crash, financial loss. Crisis analysis, business strategy. Decrease business graph illustrations Pencil draws diagram with line going down on checkered paper. Falling graph, business decline concept. Investment risk. Market
Free with trial Indian economy recession concept with a falling graph and chart. financial crisis and market crash. business downturn and economic decline. india rupee symbol. investment loss and risk. Decrease business graph illustrations India economy recession concept falling graph chart indian rupee symbol financial crisis market crash business down turn. indian economy recession concept with a falling graph and chart. financial crisis and market crash. business downturn and economic decline. india rupee symbol. investment loss and risk
Free with trial Blue arrow pointing downward on a grid. Business graph with falling trend line. Digital stock market data visualization for investment analysis. Decrease business graph illustrations Blue arrow pointing downward on a grid. Business graph with falling trend line
Free with trial Computer screen displaying a simple statistical business graph, perfect for illustrating concepts like data analysis. Decrease business graph illustrations Computer showing statistical business graph on screen. Computer screen displaying a simple statistical business graph, perfect for illustrating concepts like data analysis
Free with trial Magnifying Glass Over Declining Financial Graph, Business Analysis Concept, illustration. Decrease business graph illustrations Magnifying Glass Over Declining Financial Graph, Business Analysis Concept
Free with trial Decreasing graph icon Business chart with downward arrow Financial loss symbol. Decrease business graph vectors Decreasing graph icon Business chart with downward arrow Financial loss symbol
Free with trial Marketing. A vibrant and modern bar graph with glowing neon colors represents data and business growth. Decrease business graph illustrations Glowing Bar Graph Data Visualization, Business Growth, Statistics, marketing. marketing. A vibrant and modern bar graph with glowing neon colors represents data and business growth.
Free with trial A colorful bar graph showing an increase and decrease represented by wooden blocks. Decrease business graph illustrations Colorful wooden block bar graph showing increase and decrease of progress. A colorful bar graph showing an increase and decrease represented by wooden blocks
Free with trial Decrease graph icon on circle line. Statistic illustration concept. Decrease business graph vectors Decrease graph icon on circle line. Statistic concept. Decrease graph icon on circle line. Statistic illustration concept
Free with trial Down trend financial graph with arrow pointing down symbolizing business decline. Decrease business graph vectors Down trend financial graph with arrow pointing down symbolizing business decline
Free with trial Statistic icon in generic style. Decrease graph symbol illustration. Decrease business graph vectors Statistic icon in generic style. Decrease graph symbol
Free with trial A split-screen business concept image contrasts a blue line graph with downward-pointing red arrows against a black background on the left side, symbolizing declining metrics or negative financial performance, with a right side featuring a pink line-drawn person icon with a sad expression wearing a blue shirt against a grey-to-white gradient background, representing human emotional response to. Decrease business graph illustrations Business concept showing declining graph with sad person icon representing negative financial performance and economic downturn. A split-screen business concept image contrasts a blue line graph with downward-pointing red arrows against a black background on the left side, symbolizing declining metrics or negative financial performance, with a right side featuring a pink line-drawn person icon with a sad expression wearing a blue shirt against a grey-to-white gradient background, representing human emotional response to
Free with trial A graph showing a downward trend with a red arrow pointing downwards, indicating a decline or decrease in value or quantity over time. Decrease business graph illustrations Declining trend indicated by red arrow on graph showing decrease over time. A graph showing a downward trend with a red arrow pointing downwards, indicating a decline or decrease in value or quantity over time
Free with trial Illustration of financial line graph showing growth. Upward trending arrow, chart, bar chart, income, finance, business, statistics development. Visual representation of success. Decrease business graph illustrations Illustration of financial line graph showing growth. Upward trending arrow, chart, bar chart, income, finance, business
Free with trial Wooden blocks arranged as a declining graph on a red background, business concept. Decrease business graph illustrations Wooden blocks arranged as a declining graph on a red background, business concept
Free with trial The image depicts a person in a business suit pressing down on a large, bold red downward-pointing arrow graph, symbolizing a decline or decrease in something, likely related to financial or economic performance. The hand is positioned to emphasize control or influence over the downward trend. Decrease business graph illustrations A hand pressing down on a downward-trending red graph against a plain background. The image depicts a person in a business suit pressing down on a large, bold red downward-pointing arrow graph, symbolizing a decline or decrease in something, likely related to financial or economic performance. The hand is positioned to emphasize control or influence over the downward trend
Free with trial Growth and decline bar chart icon illustration. Upward and downward arrow graph symbol. Business up and down trend concept. Decrease business graph vectors Growth and decline bar chart icon. Upward and downward arrow graph symbol. Business up and down trend concept
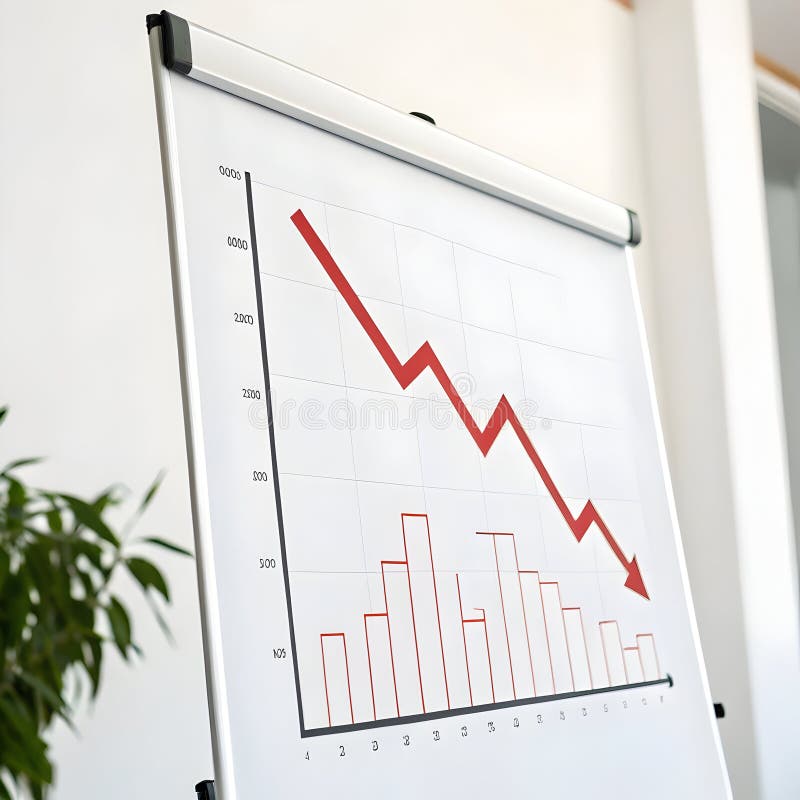
Free with trial The image shows a bar graph with a red line indicating a downward trend. The bars decrease in height from left to right, suggesting a significant decline in the measured data over time. Decrease business graph illustrations A downward trend graph illustrating a significant decrease in data over time. The image shows a bar graph with a red line indicating a downward trend. The bars decrease in height from left to right, suggesting a significant decline in the measured data over time
Free with trial Red arrow declining on bar graph, business finance chart, downward trend, recession, financial data, blue background. Decrease business graph illustrations Red arrow graph showing decline, business finance chart, downward trend, recession. Red arrow declining on bar graph, business finance chart, downward trend, recession, financial data, blue background
Free with trial Visualize cost reduction with a downward trending graph held in a hand. Illustrates finance, business strategy, and expense management. Shows efficiency and financial planning concepts. Decrease business graph illustrations Cost reduction strategy business finance graph chart decreasing costs expense management efficiency concept. Visualize cost reduction with a downward trending graph held in a hand. Illustrates finance, business strategy, and expense management. Shows efficiency and financial planning concepts.
Free with trial Growth and decline bar chart icon illustration. Upward and downward arrow graph symbol. Business up and down trend concept in black circle. Decrease business graph vectors Growth and decline bar chart icon. Upward and downward arrow graph symbol. Business up and down trend concept in black circle
Free with trial A visual representation of a stock market crash, featuring a downward trend arrow made of green and red cubes, symbolizing financial crisis and economic recession. It is a business loss graph chart. Decrease business graph illustrations Stock market crash concept downward trend arrow financial crisis economic recession business loss graph chart. a visual representation of a stock market crash, featuring a downward trend arrow made of green and red cubes, symbolizing financial crisis and economic recession. It is a business loss graph chart.
Free with trial Wooden blocks arranged as declining graph on vibrant red background, business concept. Decrease business graph illustrations Wooden blocks arranged as declining graph on vibrant red background, business concept
Free with trial A flat style illustration featuring a decreasing graph alongside a warning symbol, representing decline and potential business issues on a black background. Decrease business graph vectors Declining Graph with Warning Icon: Illustration of Failure or Business Downturn. A flat style illustration featuring a decreasing graph alongside a warning symbol, representing decline and potential business issues on a black background.
Free with trial A downward graph chart showing a decrease, isolated on a white background, perfect for business and financial presentations. Decrease business graph illustrations Downward graph chart isolated on white background. A downward graph chart showing a decrease, isolated on a white background, perfect for business and financial presentations
Free with trial A downward graph chart showing a decrease, isolated on a white background, perfect for business and financial presentations. Decrease business graph illustrations Downward graph chart isolated on white background. A downward graph chart showing a decrease, isolated on a white background, perfect for business and financial presentations
Free with trial Declining Bar Graph With Cursor Solid Icon. Business Performance, Financial Loss, And Market Downturn Silhouette Symbol. Economic Analysis. Isolated Vector Illustration. Decrease business graph vectors Declining Bar Graph With Cursor Solid Icon. Business Performance, Financial Loss, And Market Downturn Silhouette Symbol
Free with trial Decrease bar graph icon on black circle. Market crash illustration concept. Decrease business graph vectors Decrease bar graph icon on black circle. Market crash concept. Decrease bar graph icon on black circle. Market crash illustration concept
Free with trial Line art bar graph icon set featuring upward and downward trend arrows for business analysis. Decrease business graph vectors Line art bar graph icon set featuring upward and downward trend arrows for business analysis
Free with trial Line Graph Chart Line And Solid Icon Set. Data Analysis, Trend Visualization, And Business Growth Symbol Collection. Statistical Representation And Performance Tracking. Isolated Vector Illustration. Decrease business graph vectors Line Graph Chart Line And Solid Icon Set. Data Analysis, Trend Visualization, And Business Growth Symbol Collection
Free with trial Descending bar graph on blue background. 3D render data visualization. Financial market chart, business analysis concept. Economic loss, falling sales, statistics. Ideal for. Decrease business graph illustrations Descending bar graph on blue background. 3D render data visualization. Financial market chart, business analysis concept.
Free with trial This vector illustration shows business icons representing time management, financial growth, investment, profit increase and decrease with simple human figures in black. Professional mood. Generative AI. Decrease business graph vectors Business icons time management financial growth investment profit increase decrease vector illustration. This vector illustration shows business icons representing time management, financial growth, investment, profit increase and decrease with simple human figures in black. Professional mood. Generative AI
Free with trial Hand drawing falling bar graph with down arrow on chalkboard for business decline concept. Generative AI. Decrease business graph illustrations Hand drawing falling bar graph with down arrow on chalkboard for business decline concept
Free with trial Green line graph on a pink background with a downward arrow. Business trend showing decline and fall. Financial analysis and performance concept. Decrease business graph illustrations Green line graph on a pink background with a downward arrow. Business trend showing decline and fall
Free with trial The image depicts a bar graph with blue bars that increase in height initially, then gradually decrease, symbolizing growth followed by decline. An upward-pointing arrow overlays the graph, indicating an overall upward trend or potential future growth despite the current decline in the bars' heights. This visual is often used in business, finance, and analytics to illustrate performance trends. Decrease business graph illustrations Growth trend represented by increasing and then decreasing blue bar graph with upward arrow. The image depicts a bar graph with blue bars that increase in height initially, then gradually decrease, symbolizing growth followed by decline. An upward-pointing arrow overlays the graph, indicating an overall upward trend or potential future growth despite the current decline in the bars' heights. This visual is often used in business, finance, and analytics to illustrate performance trends
Free with trial Set line Financial growth decrease, Graph, chart, diagram and Clock icon. Vector. Decrease business graph illustrations Set line Financial growth decrease, Graph, chart, diagram and Clock icon. Vector
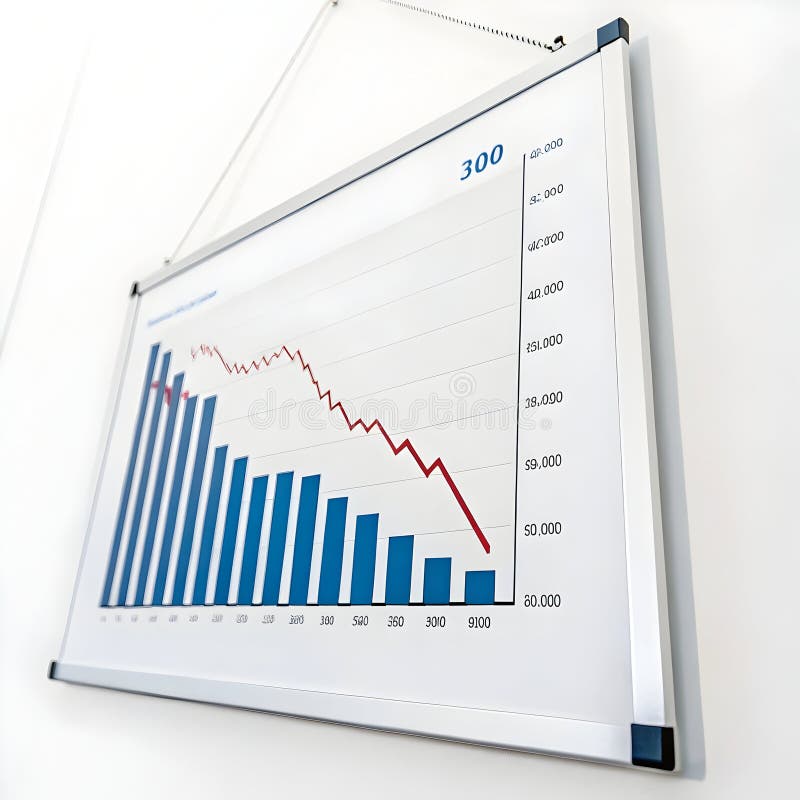
Free with trial Computer Screen Showing Downward Trend Graph in Red. Stock Market Decrease and Economic Problems. Decrease business graph vectors Computer Screen Showing Downward Trend Graph in Red. Stock Market Decrease and Economic Problems
Free with trial Hand Drawn Smartphone Screen Displaying Financial Decline Graph Arrow Business Downturn Loss Concept. Decrease business graph vectors Hand Drawn Smartphone Screen Displaying Financial Decline Graph Arrow Business Downturn Loss Concept
Free with trial Blue bar graph with a downward trending arrow and a red heart above, representing a decrease in love or affection. Decrease business graph vectors Blue bar graph showing decrease in love and affection. Blue bar graph with a downward trending arrow and a red heart above, representing a decrease in love or affection
Free with trial Futuristic red stock market graph showing a sharp decline in business and finance Digital Display. Decrease business graph illustrations Red Stock Market Decline Graph Digital Display Futuristic Technology Finance Business Data Chart. Futuristic red stock market graph showing a sharp decline in business and finance Digital Display
Free with trial Red arrow pointing downwards declining market, financial downturn, investment loss, business crisis. Economic concepts decrease, failure, debt, bankruptcy, recession. Represents. Decrease business graph illustrations Red arrow pointing downwards, declining market, financial downturn, investment loss, business crisis. Economic concepts decrease. Red arrow pointing downwards declining market, financial downturn, investment loss, business crisis. Economic concepts decrease, failure, debt, bankruptcy, recession. Represents.
Free with trial Minimalistic red and white financial graph on downward trend for business design. Decrease business graph illustrations Minimalistic red and white financial graph on downward trend for business design
Free with trial A person in a blue suit holds a red bar graph with white arrows pointing downwards over their open palm. A bright light emanates from beneath the graph. The background is a blurred gray texture. business, finance, graph. man in blue suit holding red downward trending bar graph with white arrows business finance chart. Decrease business graph illustrations Man in blue suit holding red downward trending bar graph with white arrows business finance chart
Free with trial PNG 3D Bar Chart Data Visualization Business Analytics Performance Metrics Colorful Graph against transparent Background. Decrease business graph illustrations PNG 3D Bar Chart Data Visualization Business Analytics Performance Metrics Colorful Graph against transparent Background
Free with trial A man is giving a business presentation, pointing to a graph on a whiteboard. He is using a laptop and explaining the data. The scene is set in an office. Decrease business graph illustrations Business presentation with a man pointing to a graph isolated on white background. A man is giving a business presentation, pointing to a graph on a whiteboard. He is using a laptop and explaining the data. The scene is set in an office
Free with trial A clean vector illustration of a bar chart graph featuring pink striped bars and a yellow highlighted section against a white background. The chart is flat design style, ideal for data visualization, business presentations, or infographics. The bars decrease in height from left to right, with the yellow section emphasizing the bottom area. Decrease business graph illustrations Striped bar chart graph with yellow highlight and pink bars on white background vector illustration. A clean vector illustration of a bar chart graph featuring. A clean vector illustration of a bar chart graph featuring pink striped bars and a yellow highlighted section against a white background. The chart is flat design style, ideal for data visualization, business presentations, or infographics. The bars decrease in height from left to right, with the yellow section emphasizing the bottom area
Free with trial The image displays a line graph with a blue line that increases over time, with a shaded area underneath it, the graph has a white background with a light blue gradient and features various small icons related to business and finance such as bar graphs, pie charts, and dollar signs, the icons are light blue and scattered around the graph, the overall design is simple and clean, making it easy to. This image was generated using artificial intelligence. Decrease business graph illustrations A line graph showing revenue growth over time with various icons surrounding it to represent different aspects of business and. the image displays a line graph with a blue line that increases over time, with a shaded area underneath it, the graph has a white background with a light blue gradient and features various small icons related to business and finance such as bar graphs, pie charts, and dollar signs, the icons are light blue and scattered around the graph, the overall design is simple and clean, making it easy to. This image was generated using artificial intelligence.
Free with trial Red arrow pointing downward against dark background. Declining stock market graph represents financial loss. Economic downturn, business crisis concept, investment decrease budget. Decrease business graph illustrations Red arrow pointing downward against dark background. Declining stock market graph represents financial loss. Economic downturn
Free with trial Conceptual image showing a declining financial graph on a hand, symbolizing business economy crisis, investment loss, or market crash. It represents negative growth and economic downturn. Decrease business graph illustrations Declining financial graph on hand concept for business economy crisis or investment loss and market crash. conceptual image showing a declining financial graph on a hand, symbolizing business economy crisis, investment loss, or market crash. It represents negative growth and economic downturn.
Free with trial Line drawing of a flipchart showing a decreasing graph, illustrating negative business results. Decrease business graph vectors Flipchart with decreasing graph presenting business results. Line drawing of a flipchart showing a decreasing graph, illustrating negative business results
Free with trial Business decline stage. Woman with laptop sits near falling graph. Financial recession and economic crisis. Bankruptcy and debts. Global inflation. Flat vector illustration. Decrease business graph vectors Business decline stage. Woman with laptop sits near falling graph. Financial recession and economic crisis. Bankruptcy
Free with trial A red arrow points down over a bar graph, symbolizing a stock market crash, recession, or financial crisis. This image conveys economic downturn, investment loss, and business failure in a clear visual manner. Decrease business graph illustrations Stock market crash recession chart financial crisis economic downturn investment loss business failure graph. a red arrow points down over a bar graph, symbolizing a stock market crash, recession, or financial crisis. This image conveys economic downturn, investment loss, and business failure in a clear visual manner.
Free with trial A visual representation of a financial downturn. A hand places a downward pointing arrow on a graph showing a decline. Symbolizes economic recession, investment loss, and business failure. Decrease business graph illustrations Stock market crash financial crisis investment loss business failure economic recession downtrend graph chart. A visual representation of a financial downturn. A hand places a downward pointing arrow on a graph showing a decline. Symbolizes economic recession, investment loss, and business failure.
Free with trial A line art illustration shows a bar graph with arrows and a star on a purple background. It represents business growth, success, and achievement of goals. Decrease business graph vectors Vector art of line art illustration of a bar graph with arrows and a star on a purple background business growth concept. A line art illustration shows a bar graph with arrows and a star on a purple background. It represents business growth, success, and achievement of goals
Free with trial Green up and red down 3d arrow graph showing rising, descending trend, business result, profit or loss symbol symbol. Business arrow, goals concept. 3d world money symbols. Financial growth vector isolated. Decrease business graph vectors Green up and red down 3d arrow graph showing rising, descending trend, business result, profit. world money symbols. Green up and red down 3d arrow graph showing rising, descending trend, business result, profit or loss symbol symbol. Business arrow, goals concept. 3d world money symbols. Financial growth vector isolated
Free with trial Green up and red down 3d arrow graph showing rising, descending trend, business result, profit or loss symbol symbol. Business arrow, goals concept. 3d world money symbols. Financial growth vector isolated. Decrease business graph vectors Green up and red down 3d arrow graph showing rising, descending trend, business result, profit. world money symbols. Green up and red down 3d arrow graph showing rising, descending trend, business result, profit or loss symbol symbol. Business arrow, goals concept. 3d world money symbols. Financial growth vector isolated
Free with trial Businessman Wearing Mask Analyzing Declining Market Graph Against Cityscape, Economy, Recession, Investment, Business, This content is generated by AI. Decrease business graph illustrations Businessman Wearing Mask Analyzing Declining Market Graph Against Cityscape, Economy, Recession, Investment, Business