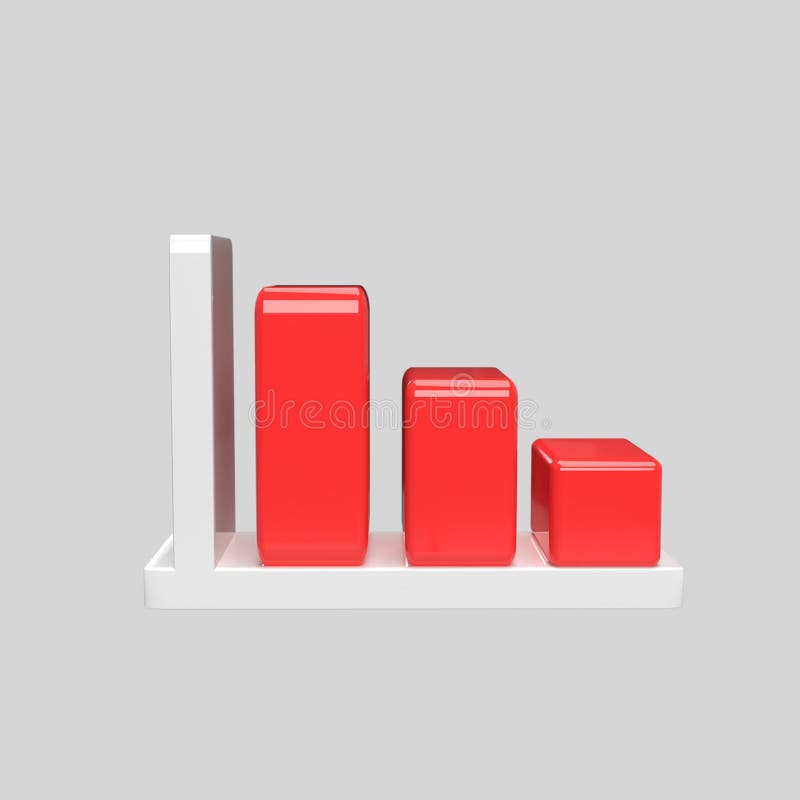
Free with trial Decrease Graph 3d model cartoon style. render illustrations. Decrease business graph illustrations Decrease Graph 3d model cartoon style. render illustration
Free with trial Business to survive in financial crisis concept. Businessman recover and restore with graph. vector. Decrease business graph vectors Business to survive in financial crisis concept. Businessman recover and restore with graph
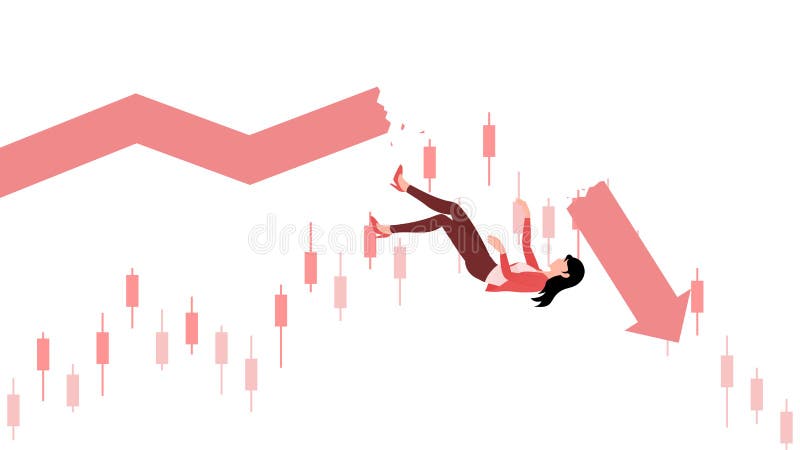
Free with trial Woman falling from graph, business character vector illustration on white background. Decrease business graph vectors Woman falling from graph, business character vector illustration on white background
Free with trial Decrease Graph 3d model cartoon style. render illustrations. Decrease business graph illustrations Decrease Graph 3d model cartoon style. render illustration
Free with trial A 3D rendering of a simple bar graph featuring two green and one orange cylinder. This image is perfect for illustrating business concepts, data representation, or as an infographic element. The clean design makes it versatile for various applications. This image was generated with the assistance of artificial intelligence. Decrease business graph illustrations 3D Bar Graph, Green and Orange Cylinders, Business Chart, Data Visualization, Infographic Element. A 3D rendering of a simple bar graph featuring two green and one orange cylinder. This image is perfect for illustrating business concepts, data representation, or as an infographic element. The clean design makes it versatile for various applications.This image was generated with the assistance of artificial intelligence.
Free with trial Chart, data, graph, reports, valuation Purple Business Logo Template. Place for Tagline. Vector EPS10 Abstract Template background. Decrease business graph vectors Chart, data, graph, reports, valuation Purple Business Logo Template. Place for Tagline
Free with trial Chart, data, graph, reports, valuation Purple Business Logo Template. Place for Tagline.. Vector EPS10 Abstract Template background. Decrease business graph vectors Chart, data, graph, reports, valuation Purple Business Logo Template. Place for Tagline
Free with trial Bitcoin rate decrease solid icon. Cryptocurrency graphic down vector illustration isolated on white. Fall graph glyph style design, designed for web and app. Eps 10. Decrease business graph vectors Bitcoin rate decrease solid icon. Cryptocurrency graphic down vector illustration isolated on white. Fall graph glyph
Free with trial Set Gold bars, Dollar symbol and Financial growth decrease. Business infographic template. Vector. Decrease business graph vectors Set Gold bars, Dollar symbol and Financial growth decrease. Business infographic template. Vector
Free with trial Set line Pie chart infographic, Financial growth increase and decrease. Business infographic template. Vector. Decrease business graph vectors Set line Pie chart infographic, Financial growth increase and decrease. Business infographic template. Vector
Free with trial Businessman are sit down on a business graph. Chart in the fall. Business falling down. Negative trend. Crisis impact. economy going down. vector, illustration. Decrease business graph vectors Businessman are sit down on a business graph. Chart in the fall. Business falling down. Negative trend. Crisis impact. economy
Free with trial Word writing text Decline. Business concept for Become smaller fewer less Decrease Politely refuse reject say no Man holding megaphone loudspeaker speech bubble message purple background. Decrease business graph illustrations Word writing text Decline. Business concept for Become smaller fewer less Decrease Politely refuse reject say no Man
Free with trial Bitcoin rate decrease line icon. Cryptocurrency graphic down vector illustration isolated on white. Fall graph outline style design, designed for web and app. Eps 10. Decrease business graph vectors Bitcoin rate decrease line icon. Cryptocurrency graphic down vector illustration isolated on white. Fall graph outline
Free with trial Red falling graph sign on a dark blue podium on a blue background. The concept of falling stocks, stagnation, business, reports and marketing. 3d rendering. Decrease business graph illustrations Red falling graph sign on a dark blue podium on a blue background. The concept of falling stocks, stagnation, business, reports
Free with trial Declining graph icon. Business decline chart filled flat sign for mobile concept and web design. Simple vector logo. Decrease business graph illustrations Declining graph icon. Business decline chart filled flat sign for mobile concept and web design
Free with trial Set Financial growth decrease, Piggy bank and Dollar symbol. Business infographic template. Vector. Decrease business graph vectors Set Financial growth decrease, Piggy bank and Dollar symbol. Business infographic template. Vector
Free with trial Set Storm, Drop in crude oil price, Dollar rate decrease and. Business infographic template. Vector. Decrease business graph vectors Set Storm, Drop in crude oil price, Dollar rate decrease and . Business infographic template. Vector
Free with trial Set line Data analysis Folder and lock Financial growth decrease and Pie chart infographic. Business infographic template. Vector. Decrease business graph vectors Set line Data analysis, Folder and lock, Financial growth decrease and Pie chart infographic. Business infographic. Set line Data analysis Folder and lock Financial growth decrease and Pie chart infographic. Business infographic template. Vector.
Free with trial Set Isometric Infographic element, Financial growth decrease and Graph, chart, diagram icon. Vector. Decrease business graph illustrations Set Isometric Infographic element, Financial growth decrease and Graph, chart, diagram icon. Vector
Free with trial Set Light bulb, Graph, chart, diagram, Financial growth decrease and Arrow icon. Vector. Decrease business graph vectors Set Light bulb, Graph, chart, diagram, Financial growth decrease and Arrow icon. Vector
Free with trial Colorful bar graph showing data and trends, perfect for business, finance, or analytics presentations. EPS 10. Decrease business graph vectors Colorful bar graph showing data and trends, perfect for business, finance, or analytics presentations.
Free with trial This image shows a falling graph behind a diamond, representing the decrease in the value of precious stones. It's suitable for illustrating financial losses. Decrease business graph vectors Illustration of a falling graph behind a diamond, symbolizing a decrease in the value of precious stones. This image shows a falling graph behind a diamond, representing the decrease in the value of precious stones. It's suitable for illustrating financial losses
Free with trial Set Financial growth decrease Data analysis and Binary code. Business infographic template. Vector. Decrease business graph illustrations Set Financial growth decrease, Data analysis and Binary code. Business infographic template. Vector
Free with trial Set Arrow, Graph, chart, diagram, Financial growth decrease, Location, Pie infographic and icon. Vector. Decrease business graph vectors Set Arrow, Graph, chart, diagram, Financial growth decrease, Location, Pie infographic and icon. Vector
Free with trial Declining graph vector icon business decline chart filled flat sign for mobile concept and web eps10. Decrease business graph vectors Declining graph vector icon business decline chart filled flat sign for mobile concept and web
Free with trial Bitcoin rate decrease line and glyph icon. Cryptocurrency graphic down vector illustration isolated on white. Fall graph outline style design, designed for web and app. Eps 10. Decrease business graph vectors Bitcoin rate decrease line and glyph icon. Cryptocurrency graphic down vector illustration isolated on white. Fall graph
Free with trial Stock market trading technical analysis bar chart fall. Business candlestick graph exchange down trend. Crisis economy and investment loss graph. Trader financial index crash concept. Eps banner. Decrease business graph vectors Stock market trading technical analysis bar chart fall. Business candlestick graph exchange down trend. Crisis economy
Free with trial Stock market trading technical analysis bar chart fall. Business candlestick graph exchange down trend. Crisis economy and investment loss graph. Trader financial index crash concept. Black background. Decrease business graph vectors Stock market trading technical analysis bar chart fall. Business candlestick graph exchange down trend. Crisis economy
Free with trial Stock market trading technical analysis bar chart fall. Business candlestick graph exchange down trend. Crisis economy and investment loss graph. Trader financial index crash concept. Money losing eps. Decrease business graph vectors Stock market trading technical analysis bar chart fall. Business candlestick graph exchange down trend. Crisis economy
Free with trial Decrease, down, financial icon. Element of business start up icon for mobile concept and web apps. Thin line decrease, down, financial icon can be used for web and mobile on white background. Decrease business graph illustrations Decrease, down, financial icon. Element of business start up icon for mobile concept and web apps. Thin line decrease, down
Free with trial Oil crisis vector concept. Decrease in production volumes, drop in oil and fuel prices. The red arrow of the graph on the background of the barrel goes down. Decrease business graph illustrations Oil crisis vector concept. Decrease in production volumes, drop in oil and fuel prices. The red arrow of the graph on the
Free with trial Set Financial growth decrease Arrow Wrench and gear Pie chart infographic Graph chart diagram and Many ways directional arrow icon. Vector. Decrease business graph vectors Set Financial growth decrease, Arrow, Wrench and gear, Pie chart infographic, Graph, chart, diagram and Many ways. Set Financial growth decrease Arrow Wrench and gear Pie chart infographic Graph chart diagram and Many ways directional arrow icon. Vector.
Free with trial Decreasing graph, Business way and Documents minimal line icons. 3d spheres or balls buttons. Drums icons. For web, application, printing. Crisis chart, Correct path, Office file. Drumsticks. Vector. Decrease business graph vectors Decreasing graph, Business way and Documents minimal line icons. For web application, printing. Vector. Decreasing graph, Business way and Documents minimal line icons. 3d spheres or balls buttons. Drums icons. For web, application, printing. Crisis chart, Correct path, Office file. Drumsticks. Vector
Free with trial Decreasing graph, Business way and Documents minimal line icons. People characters with puzzle, delivery parcel. Drums icons. For web, application, printing. Vector. Decrease business graph vectors Decreasing graph, Business way and Documents minimal line icons. For web application, printing. Vector. Decreasing graph, Business way and Documents minimal line icons. People characters with puzzle, delivery parcel. Drums icons. For web, application, printing. Vector
Free with trial Concrete blocks form a downward arrow graph. Business concept of decline, crisis, or falling market trend. Financial data visualization. Decrease business graph illustrations Concrete blocks form a downward arrow graph. Business concept of decline, crisis, or falling market trend. Financial data visualization
Free with trial Decline arrow icon in flat style. Decrease vector illustration on white isolated background. Revenue model business concept. Decrease business graph vectors Decline arrow icon in flat style. Decrease vector illustration on white isolated background. Revenue model business concept
Free with trial Do or Stop. Group, Diagram chart and Stats icons simple set. Certificate sign. Developers, Presentation graph, Business analysis. Verified document. Education set. Line group do icon. Vector. Decrease business graph vectors Group, Diagram chart and Stats icons set. Certificate sign. Developers, Presentation graph, Business analysis. Vector. Do or Stop. Group, Diagram chart and Stats icons simple set. Certificate sign. Developers, Presentation graph, Business analysis. Verified document. Education set. Line group do icon. Vector
Free with trial Set Cloud and shield Binary code Financial growth decrease and Pie chart infographic. Business infographic template. Vector. Decrease business graph vectors Set Cloud and shield, Binary code, Financial growth decrease and Pie chart infographic. Business infographic template
Free with trial Business bar graph with decreasing bars and a downward arrow representing economic loss and market fall. Decrease business graph vectors Business bar graph with decreasing bars and a downward arrow representing economic loss and market fall
Free with trial Blue graph and arrow visualize declining market trends in business, finance, and investment. Decrease business graph illustrations Declining Trends: Visualizing Market Downturn with Blue Graph & Arrow. Business, Finance, and Investment Concepts. Blue graph and arrow visualize declining market trends in business, finance, and investment
Free with trial Stock market trading technical analysis bar chart fall. Business exchange graph downtrend. Crisis economy and investment loss graph. Trader financial index crash concept. Eps banner dark background. Decrease business graph vectors Stock market trading technical analysis bar chart fall. Business exchange graph downtrend. Crisis economy and investment
Free with trial Set Data analysis Pie chart infographic Binary code and Financial growth decrease. Business infographic template. Vector. Decrease business graph vectors Set Data analysis, Pie chart infographic, Binary code and Financial growth decrease. Business infographic template
Free with trial Set paper cut Document with graph chart, Data analysis, Financial growth decrease and icon. Paper art style. Vector. Decrease business graph vectors Set paper cut Document with graph chart, Data analysis, Financial growth decrease and icon. Paper art style. Vector
Free with trial Set line Financial growth decrease, Data analysis, and Pie chart infographic. Business infographic template. Vector. Decrease business graph illustrations Set line Financial growth decrease, Data analysis, and Pie chart infographic. Business infographic template. Vector
Free with trial Set line Pie chart infographic Financial growth decrease and Cloud computing lock. Business infographic template. Vector. Decrease business graph vectors Set line Pie chart infographic, Financial growth decrease, and Cloud computing lock. Business infographic template
Free with trial Set Financial growth decrease, Binary code, Pie chart infographic and Server. Business infographic template. Vector. Decrease business graph vectors Set Financial growth decrease, Binary code, Pie chart infographic and Server. Business infographic template. Vector
Free with trial Set Dollar rate decrease, , Falling property prices and Gold bars. Business infographic template. Vector. Decrease business graph vectors Set Dollar rate decrease, , Falling property prices and Gold bars. Business infographic template. Vector
Free with trial Set Drop in crude oil price, Gold bars and Dollar rate decrease. Business infographic template. Vector. Decrease business graph vectors Set Drop in crude oil price, Gold bars and Dollar rate decrease. Business infographic template. Vector
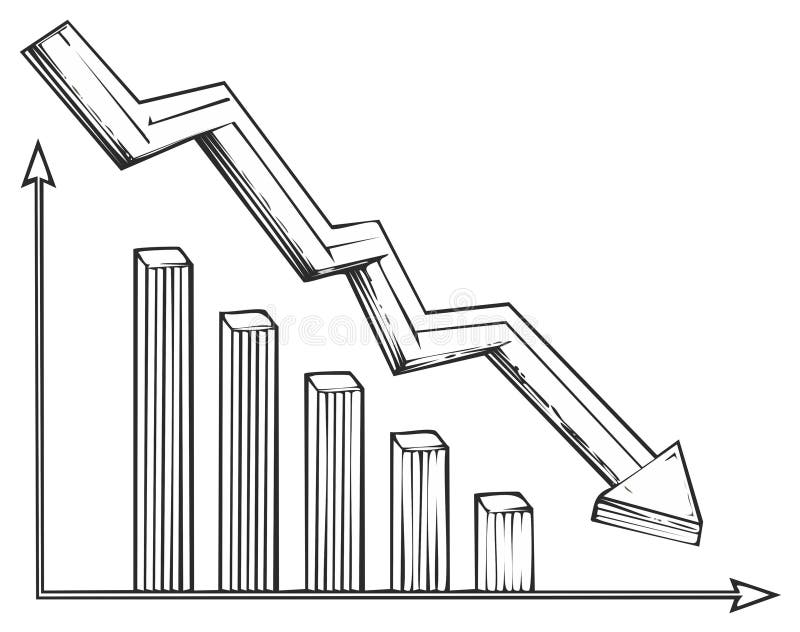
Free with trial Hand Drawn Bar Graph Chart with Downward Trend Arrow Representing Economic Decline and Business Loss. Decrease business graph vectors Hand Drawn Bar Graph Chart with Downward Trend Arrow Representing Economic Decline and Business Loss
Free with trial Set line Search with folder Binary code Pie chart infographic and Financial growth decrease. Business infographic template. Vector. Decrease business graph vectors Set line Search with folder, Binary code, Pie chart infographic and Financial growth decrease. Business infographic. Set line Search with folder Binary code Pie chart infographic and Financial growth decrease. Business infographic template. Vector.
Free with trial Set line Cloud and shield, Folder lock, Financial growth decrease and. Business infographic template. Vector. Decrease business graph illustrations Set line Cloud and shield, Folder lock, Financial growth decrease and . Business infographic template. Vector
Free with trial Set line Pie chart infographic, Debt ball chained to coin, Briefcase and Dollar rate decrease. Business infographic template. Vector. Decrease business graph vectors Set line Pie chart infographic, Debt ball chained to coin, Briefcase and Dollar rate decrease. Business infographic
Free with trial Set Graph chart diagram Pie infographic Infographic element Target Financial growth decrease Digital speed meter Arrow and Layers icon. Vector. Decrease business graph vectors Set Graph, chart, diagram, Pie infographic, Infographic element, Target, Financial growth decrease, Digital speed meter. Set Graph chart diagram Pie infographic Infographic element Target Financial growth decrease Digital speed meter Arrow and Layers icon. Vector.
Free with trial Declining bar graph illustrating business recession trend or financial downturn with line chart overlay. Decrease business graph vectors Declining bar graph illustrating business recession trend or financial downturn with line chart overlay
Free with trial Falling red arrow superimposed on a bar graph showing business decline trading losses financial ruin Can be used as a banner or header image. Decrease business graph illustrations Falling red arrow superimposed on a bar graph showing business decline , trading losses, financial ruin. Falling red arrow superimposed on a bar graph showing business decline trading losses financial ruin Can be used as a banner or header image
Free with trial Business and financial concept. Bar graph with a drop-down arrow to show low cost on black background. Decrease business graph vectors Business and financial concept. Bar graph with drop-down arrow to show low cost on black background
Free with trial Chart, data, graph, reports, valuation Business Logo Glyph Icon Symbol for your business. Turquoise Business Cards with Brand logo template.. Vector EPS10 Abstract Template background. Decrease business graph vectors Chart, data, graph, reports, valuation Business Logo Glyph Icon Symbol for your business. Turquoise Business Cards with Brand logo
Free with trial Business and financial concept. Bar graph with a drop-down arrow to show low cost on black background. Decrease business graph vectors Business and financial concept. Bar graph with drop-down arrow to show low cost on black background
Free with trial Set line Pie chart infographic Financial growth decrease Data analysis and Sales funnel with. Business infographic template. Vector. Decrease business graph vectors Set line Pie chart infographic, Financial growth decrease, Data analysis and Sales funnel with. Business infographic. Set line Pie chart infographic Financial growth decrease Data analysis and Sales funnel with. Business infographic template. Vector.
Free with trial Set line Mind map infographic Data analysis Pie chart and Financial growth decrease. Business infographic template. Vector. Decrease business graph illustrations Set line Mind map infographic, Data analysis, Pie chart and Financial growth decrease. Business infographic template
Free with trial Set Pie chart infographic, Dollar rate decrease, Fire burning house and Global economic crisis. Business infographic template. Vector. Decrease business graph vectors Set Pie chart infographic, Dollar rate decrease, Fire burning house and Global economic crisis. Business infographic
Free with trial Finance productivity graph flat line icons set. Graph of decline with money sign. Dividends. Return on investment chart. Decrease in profit. Simple flat vector illustration for store, web site. Decrease business graph vectors Finance productivity graph flat line icons set. Graph of decline with money sign. Dividends. Return on investment chart. Decrease
Free with trial Set line Layers, Arrow, Graph, chart, diagram and Financial growth decrease. White rectangle button. Vector. Decrease business graph vectors Set line Layers, Arrow, Graph, chart, diagram and Financial growth decrease. White rectangle button. Vector
Free with trial Set Pie chart infographic Wrench and gear Financial growth decrease Clock Dollar symbol Graph chart diagram and Old hourglass with sand icon. Vector. Decrease business graph illustrations Set Pie chart infographic, Wrench and gear, Financial growth decrease, Clock, Dollar symbol, Graph, chart, diagram, and. Set Pie chart infographic Wrench and gear Financial growth decrease Clock Dollar symbol Graph chart diagram and Old hourglass with sand icon. Vector.
Free with trial Set Clock Graph chart diagram Pie infographic Financial growth decrease Infographic element Arrow and Target icon. Vector. Decrease business graph vectors Set Clock, Graph, chart, diagram, Pie infographic, Financial growth decrease, Infographic element, Arrow and Target icon
Free with trial A visual representation of india's economic downturn, showing a declining graph and financial crisis. it highlights the business decline and recession impacting the nation's economy and market trends. Decrease business graph illustrations Understanding india economic recession and financial crisis with falling graph and business decline chart. a visual representation of india's economic downturn, showing a declining graph and financial crisis. it highlights the business decline and recession impacting the nation's economy and market trends.
Free with trial Business and financial concept. Bar graph with green upper and red lower arrow to show low cost and high quality on black background. Decrease business graph vectors Business and financial concept. Bar graph with green upper and red lower arrow to show low cost and high quality on black
Free with trial Set Pyramid chart infographics Shopping bag with Sale Percent up arrow Financial growth decrease Graph chart diagram Clock Dollar symbol and Pie icon. Vector. Decrease business graph illustrations Set Pyramid chart infographics, Shopping bag with Sale, Percent up arrow, Financial growth decrease, Graph, chart. Set Pyramid chart infographics Shopping bag with Sale Percent up arrow Financial growth decrease Graph chart diagram Clock Dollar symbol and Pie icon. Vector.
Free with trial Set Factory Financial growth decrease Pyramid chart infographics Graph chart diagram Arrow Pie Digital speed meter and increase icon. Vector. Decrease business graph illustrations Set Factory, Financial growth decrease, Pyramid chart infographics, Graph, chart, diagram, Arrow, Pie, Digital speed. Set Factory Financial growth decrease Pyramid chart infographics Graph chart diagram Arrow Pie Digital speed meter and increase icon. Vector.
Free with trial Infographic timeline. Pie chart, Crowdfunding and Atm icons simple set. Favorite sign. 3d graph, Start business, Money withdraw. Star feedback. Business set. 4 steps layout. Line pie chart icon. Vector. Decrease business graph vectors Pie chart, Crowdfunding and Atm icons set. Favorite sign. 3d graph, Start business, Money withdraw. Vector. Infographic timeline. Pie chart, Crowdfunding and Atm icons simple set. Favorite sign. 3d graph, Start business, Money withdraw. Star feedback. Business set. 4 steps layout. Line pie chart icon. Vector
Free with trial Declining graph icon. Business decline chart filled flat sign for mobile concept and web design. Simple vector logo. Decrease business graph illustrations Declining graph icon. Business decline chart filled flat sign for mobile concept and web design
Free with trial Business Logo for chart, data, graph, reports, valuation. Vertical Blue Business / Visiting Card template.. Vector EPS10 Abstract Template background. Decrease business graph vectors Business Logo for chart, data, graph, reports, valuation. Vertical Blue Business / Visiting Card template
Free with trial Bar Chart Decline Line And Solid Icon Set. Financial Loss, Economic Downturn, And Business Performance Decrease Symbol Collection. Data Analysis And Market Trends. Isolated Vector Illustration. Decrease business graph vectors Bar Chart Decline Line And Solid Icon Set. Financial Loss, Economic Downturn, And Business Performance Decrease Symbol
Free with trial Red arrow pointing downwards signifies a negative trend in business finance and the economy indicating potential losses market decline or economic recession represented visually with a graph chart. Decrease business graph illustrations Red arrow trending downward represents financial loss and economic recession in a business graph chart. Red arrow pointing downwards signifies a negative trend in business finance and the economy indicating potential losses market decline or economic recession represented visually with a graph chart
Free with trial Set Search globe, Financial growth, decrease and Server. Business infographic template. Vector. Decrease business graph illustrations Set Search globe, Financial growth, decrease and Server. Business infographic template. Vector
Free with trial Set Search globe, Financial growth, decrease and Server. Business infographic template. Vector. Decrease business graph vectors Set Search globe, Financial growth, decrease and Server. Business infographic template. Vector
Free with trial Set line Dollar rate decrease, Global economic crisis, Pie chart infographic and. Business infographic template. Vector. Decrease business graph vectors Set line Dollar rate decrease, Global economic crisis, Pie chart infographic and . Business infographic template. Vector
Free with trial Hand drawn falling graph line over declining bar chart representing economic recession and business loss. Decrease business graph vectors Hand drawn falling graph line over declining bar chart representing economic recession and business loss
Free with trial Sketch of a decreasing bar graph showing negative business trend with a downward arrow, decline illustration. Decrease business graph vectors Sketch of a decreasing bar graph showing negative business trend with a downward arrow, decline illustration
Free with trial Decreasing bar graph with downward arrow icon representing financial loss, recession, and business failure. Decrease business graph vectors Decreasing bar graph with downward arrow icon representing financial loss, recession, and business failure