Free with trial Stock icon on white background. flat style. financial market crash icon for your web site design, logo, app, UI. graph chart downtrend symbol. chart going down sign. Decrease business graph illustrations Stock icon on white background. flat style. financial market crash icon for your web site design, logo, app, UI. graph chart
Free with trial Downward Business Graph with Arrows Financial Loss and Market Decline Concept. Decrease business graph vectors Downward Business Graph with Arrows Financial Loss and Market Decline Concept
Free with trial Businessman presenting falling down arrow for businesspeople at conference meeting decrease economical financial crisis failure concept full length horizontal vector illustration. Decrease business graph vectors Businessman presenting falling down arrow for businesspeople at conference meeting decrease economical financial crisis
Free with trial Business of the analyst with shooters and infographics. Decrease business graph vectors Business analytics. Business of the analyst with shooters and infographics
Free with trial Black line business commercial and finance icon set for web design, user interface (UI), infographic and mobile application (apps). Decrease business graph vectors Black line business commercial and finance icon set
Free with trial Set line Debt ball chained to coin, Storm, Dollar rate decrease and Mobile stock trading. Business infographic template. Vector. Decrease business graph vectors Set line Debt ball chained to coin, Storm, Dollar rate decrease and Mobile stock trading. Business infographic template
Free with trial Moose in businessman suit Leaning His Head Below on decreasing graph chart, business failure, Flat concept vector. Decrease business graph vectors Moose in businessman suit Leaning His Head
Free with trial Abstract background of crisis stock market exchange graph down, investment trading vector design. Decrease business graph vectors Background of crisis stock market exchange graph down, investment trading vector design
Free with trial Diagram and graph icons with reflect on white background, stock vector. Decrease business graph vectors Diagram and graph icons with reflect on white back
Free with trial Green arrow pointing downward on financial graph. Business chart with falling trend line. Digital stock market data visualization for investment analysis. Decrease business graph illustrations Green arrow pointing downward on financial graph. Business chart with falling trend line
Free with trial Red Graph moving down on chart as recession or financial crisis 3d render, illustration. Decrease business graph illustrations Red Graph moving down on chart as recession or financial crisis
Free with trial Infographic timeline. Correct answer, Calendar and Analytics graph icons simple set. Multichannel sign. Approved, Calculator device, Growth report. Multitasking. Technology set. 4 steps layout. Vector. Decrease business graph vectors Correct answer, Calendar and Analytics graph icons set. Multichannel sign. Vector. Infographic timeline. Correct answer, Calendar and Analytics graph icons simple set. Multichannel sign. Approved, Calculator device, Growth report. Multitasking. Technology set. 4 steps layout. Vector
Free with trial Crisis finance graph chart icon. Outline crisis finance graph chart vector icon for web design isolated on white background. Decrease business graph vectors Crisis finance graph chart icon, outline style. Crisis finance graph chart icon. Outline crisis finance graph chart vector icon for web design isolated on white background
Free with trial Red arrow pointing downward on financial graph. Business chart showing recession in economy. Digital stock market data visualization for investment analysis. Decrease business graph illustrations Red arrow pointing downward on financial graph. Business chart showing recession in economy
Free with trial Widescreen Abstract financial chart with downtrend line graph and walking bear icon in stock market on red and blue color backgrou. Decrease business graph vectors Widescreen Abstract financial chart with downtrend line graph and walking bear icon in stock market on red and blue color backgrou
Free with trial Bars descending graph vector line icon, sign, illustration on white background, editable strokes. Decrease business graph vectors Bars descending graph vector line icon, sign, illustration on background, editable strokes
Free with trial Upset businessman, graph down linear icon, sign, symbol, vector on isolated background. Decrease business graph vectors Upset businessman, graph down linear icon, sign, symbol, vector on isolated background
Free with trial Frozen graph showing a downward trend. Cold economy concept, financial crisis, declining business, and cold market conditions. Decrease business graph illustrations Frozen graph showing a downward trend. Cold economy concept, financial crisis, declining business
Free with trial Reputation Decrease Graphic icon. Monochrome style design from diagram collection. UI. Pixel perfect simple pictogram reputation decrease graphic icon. Web design, apps, software, print usage. Decrease business graph illustrations Reputation Decrease Graphic icon. Monochrome style design from diagram icon collection. UI. Pixel perfect simple pictogram reputat. Reputation Decrease Graphic icon. Monochrome style design from diagram collection. UI. Pixel perfect simple pictogram reputation decrease graphic icon. Web design, apps, software, print usage.
Free with trial Growth graph of the green arrow and yellow cubes on a white background. Decrease business graph illustrations Growth graph of the green arrow and yellow cubes
Free with trial Chart, data, graph, reports, valuation Icon. Line vector gray symbol for UI and UX, website or mobile application. Vector EPS10 Abstract Template background. Decrease business graph vectors Chart, data, graph, reports, valuation Icon. Line vector gray symbol for UI and UX, website or mobile application
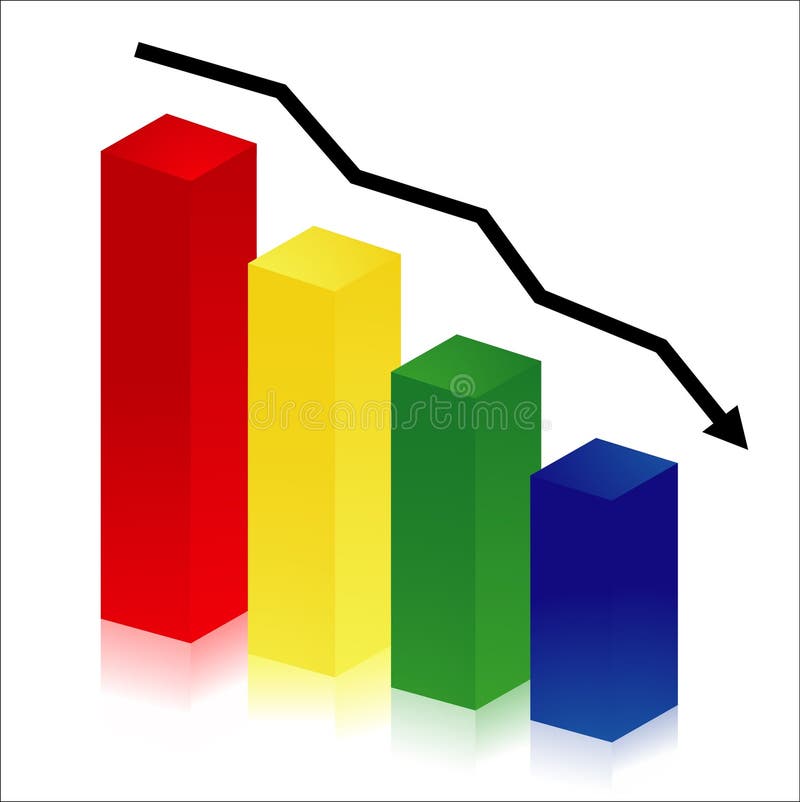
Free with trial Downward Trend Chart Illustration with Bars and Arrow Signifying Decrease Business and Finance Data. Decrease business graph vectors Downward Trend Chart Illustration with Bars and Arrow Signifying Decrease Business and Finance Data
Free with trial Graduation cap, Time and Certificate icons simple set. Horizontal chart sign. University, Office clock, Verified award. Presentation graph. Business set. Infographic timeline. Line graduation cap icon. Decrease business graph vectors Graduation cap, Time and Certificate icons set. Horizontal chart sign. Vector. Graduation cap, Time and Certificate icons simple set. Horizontal chart sign. University, Office clock, Verified award. Presentation graph. Business set. Infographic timeline. Line graduation cap icon
Free with trial The business concept of both crisis and recovery. Decrease business graph illustrations The business concept of both crisis and recovery
Free with trial Concept Of Economic Crisis. Business People Or Traders Watching For Stock Market Crash. Characters Analyse Charts And Lose Money Because Of Stock Market Recession. Isometric 3D Vector Illustration. Decrease business graph vectors Concept Of Economic Crisis. Business People Or Traders Watching For Stock Market Crash. Characters Analyse Charts And
Free with trial A businessman presents a declining cost graph indicating financial downturn decrease in profits and overall economic challenges He is wearing a formal business suit with a white shirt and tie symbolizing professionalism The graph with its descending red arrow shows cost reduction or losses in sales or revenues. Decrease business graph illustrations Declining cost graph held by businessman symbolizing financial downturn and economic challenges. A businessman presents a declining cost graph indicating financial downturn decrease in profits and overall economic challenges He is wearing a formal business suit with a white shirt and tie symbolizing professionalism The graph with its descending red arrow shows cost reduction or losses in sales or revenues
Free with trial American USA flag with red arrow graph going down showing economy recession and shares fall. Isolated vector illustration. Decrease business graph vectors American USA flag with red arrow graph going down showing economy recession and shares fall.
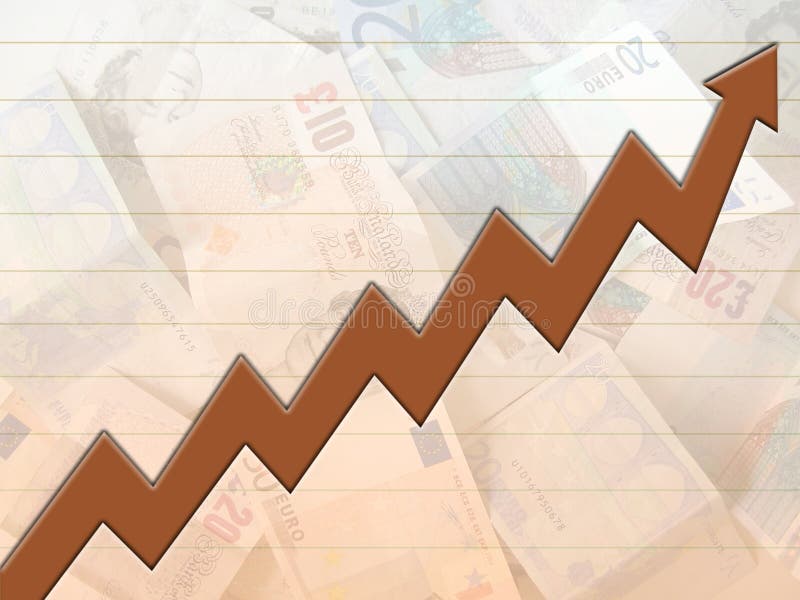
Free with trial Business growth in year 2011. Decrease business graph illustrations Business growth in 2011. Business growth in year 2011
Free with trial Business growth of year in white background. Decrease business graph illustrations Business growth of year
Free with trial Set Shutdown of factory, Dollar rate decrease and Pie chart infographic. Business infographic template. Vector. Decrease business graph illustrations Set Shutdown of factory, Dollar rate decrease and Pie chart infographic. Business infographic template. Vector
Free with trial Collapse sign on economy background - graph and coins. Financial crash in world economy because of coronavirus. Global economic crisis, recession. Coronavirus pandemic, COVID-19 outbreak in the world. Decrease business graph illustrations Collapse sign on economy background - graph and coins
Free with trial Text Small business crashed by red coronavirus sketch and falling graphs over grey wall background. Concept of financial crisis due to 2019 ncov coronavirus pandemic. 3d rendering. Decrease business graph illustrations Small business crash due to covid 19 coronavirus. Text Small business crashed by red coronavirus sketch and falling graphs over grey wall background. Concept of financial crisis due to 2019 ncov coronavirus pandemic. 3d rendering
Free with trial Small business crashed by red coronavirus sketch over dark blue background. Concept of financial crisis due to 2019 ncov coronavirus pandemic. 3d rendering. Decrease business graph illustrations Coronavirus small business financial crash. Small business crashed by red coronavirus sketch over dark blue background. Concept of financial crisis due to 2019 ncov coronavirus pandemic. 3d rendering
Free with trial Set line Dollar rate decrease, Contract money and pen, Global economic crisis and Mobile stock trading. Business infographic template. Vector. Decrease business graph illustrations Set line Dollar rate decrease, Contract money and pen, Global economic crisis and Mobile stock trading. Business
Free with trial Business diagram of decrease on the background of a worker. Decrease business graph vectors Vector Worker. Business diagram of decrease on the background of a worker.
Free with trial Vector hand drawn characters line. Decrease business graph vectors Business & down. Vector hand drawn characters line
Free with trial Simple line art business icons set featuring a magnifying glass, minus symbol, pie chart, and rising bar graph for financial data analysis. Decrease business graph vectors Simple line art business icons set featuring a magnifying glass, minus symbol, pie chart, and rising bar graph for
Free with trial Red percent sign with downward arrow. Decrease business graph illustrations Rapid Percent decrease. Red percent sign with downward arrow
Free with trial An illustration of arrows indicating profit and loss on a graph. Decrease business graph vectors Profit and loss illustration. An illustration of arrows indicating profit and loss on a graph
Free with trial Lazy and hard working business man. Decrease business graph vectors Lazy and hard working
Free with trial Line art percentage icon set featuring discount tags and financial decrease symbols for sales, economics, and business. Decrease business graph vectors Line art percentage icon set featuring discount tags and financial decrease symbols for sales, economics, and business
Free with trial Economy crisis / 3d graph showing fall in profits or earnings / illustration. Decrease business graph vectors Economy crisis
Free with trial An image of a glass graphical pie chart, it could be useful for business concepts. Decrease business graph illustrations Glass Pie Chart. An image of a glass graphical pie chart, it could be useful for business concepts.
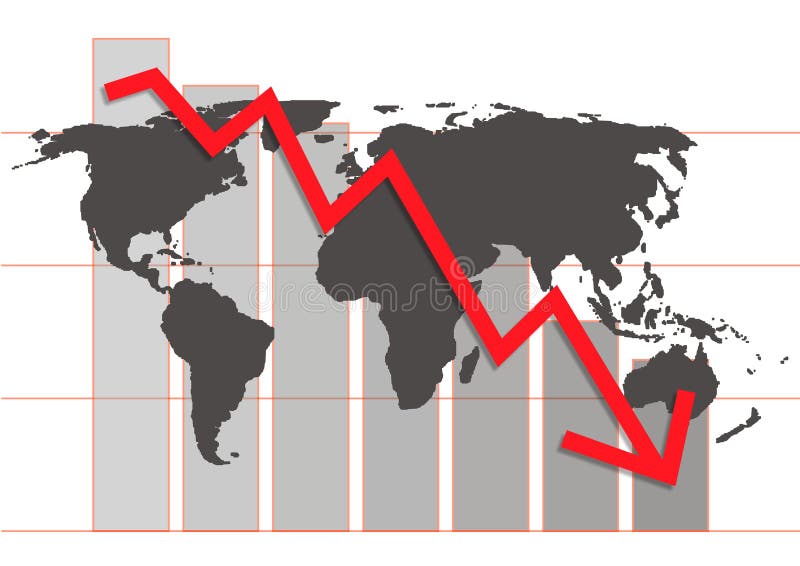
Free with trial World crisis chart in business market - ial illustration. Decrease business graph illustrations World crisis chart
Free with trial An illustration of a green arrow pointing upwards and a red arrow pointing downwards on a graph background. The green arrow represents growth or increase, while the red arrow represents decline or decrease. The image can be used to symbolize contrasting trends or outcomes in various contexts such as business, finance, or economics. Decrease business graph illustrations Green and Red Arrows on a Graph. An illustration of a green arrow pointing upwards and a red arrow pointing downwards on a graph background. The green arrow represents growth or increase, while the red arrow represents decline or decrease. The image can be used to symbolize contrasting trends or outcomes in various contexts such as business, finance, or economics.
Free with trial Business diagram glas bars in motion building a stair and showing success. Decrease business graph illustrations Bar Chart In Motion. Business diagram glas bars in motion building a stair and showing success
Free with trial Vector cubes with sales prices decrease. Decrease business graph vectors Prices decrease
Free with trial Business concept. Separated on white. Decrease business graph illustrations Failure metaphor. Business concept. Separated on white
Free with trial Simple line art business icons set featuring a magnifying glass, minus symbol, pie chart, and rising bar graph for financial data analysis. Decrease business graph vectors Simple line art business icons set featuring a magnifying glass, minus symbol, pie chart, and rising bar graph for
Free with trial An image of a graphical pie chart, it could be useful for business concepts. Decrease business graph illustrations Pie Chart 133. An image of a graphical pie chart, it could be useful for business concepts.
Free with trial 3d illustration of real estate market graph. Decrease business graph illustrations Real estate prices. 3d illustration of real estate market graph
Free with trial Downward trend graph illustrating business decline and financial recession. Chalk drawing on a black chalkboard background features white bars and a prominent yellow downward arrow with ample copy space. Ideal for economic reports, marketing presentations, and educational content. Decrease business graph illustrations Downward Trend Graph Showing Business Decline with Yellow Arrow on Chalkboard Background. Downward trend graph illustrating business decline and financial recession. Chalk drawing on a black chalkboard background features white bars and a prominent yellow downward arrow with ample copy space. Ideal for economic reports, marketing presentations, and educational content.
Free with trial Business concept. Separated on white. Decrease business graph illustrations Failure metaphor. Business concept. Separated on white
Free with trial Colorful histogram on white background, decrease concept. Decrease business graph vectors Colorful histogram
Free with trial A minimalist black line graph icon on a clean white background, clearly illustrating a downward trend. The zigzagging line culminates in a sharp arrow pointing downwards, symbolizing decline, decrease, or negative performance. This versatile vector illustration is ideal for representing financial losses, economic downturns, sales drops, market crashes, or any data indicating a negative trajectory. Perfect for business reports, presentations, websites, apps, and infographics requiring a clear visual indicator of reduction or poor results. Decrease business graph vectors Downward Trend Graph with Arrow Icon. A minimalist black line graph icon on a clean white background, clearly illustrating a downward trend. The zigzagging line culminates in a sharp arrow pointing downwards, symbolizing decline, decrease, or negative performance. This versatile vector illustration is ideal for representing financial losses, economic downturns, sales drops, market crashes, or any data indicating a negative trajectory. Perfect for business reports, presentations, websites, apps, and infographics requiring a clear visual indicator of reduction or poor results.
Free with trial An image of a graphical pie chart, it could be useful for business concepts. Decrease business graph illustrations Pie Chart 127. An image of a graphical pie chart, it could be useful for business concepts.
Free with trial Business concept. Separated on white. Decrease business graph illustrations Flowchart with people. Business concept. Separated on white
Free with trial The words Cut Costs on a pie chart to symbolize the need to reduce overhead and debt burdens to increase profitability and health of a business or family finances. Decrease business graph illustrations Cut Costs Pie Chart Reduce Overhead Debt. The words Cut Costs on a pie chart to symbolize the need to reduce overhead and debt burdens to increase profitability and health of a business or family finances
Free with trial This minimalist vector illustration depicts a retail store icon integrated into a shopping cart, positioned against a declining line graph. The visual metaphor highlights a negative economic trend or a decrease in consumer activity. The color palette uses muted tones with a bold red accent to emphasize the downward trajectory of the market performance. Decrease business graph vectors A line graph showing a downward trend for a retail business concept. This minimalist vector illustration depicts a retail store icon integrated into a shopping. This minimalist vector illustration depicts a retail store icon integrated into a shopping cart, positioned against a declining line graph. The visual metaphor highlights a negative economic trend or a decrease in consumer activity. The color palette uses muted tones with a bold red accent to emphasize the downward trajectory of the market performance
Free with trial Statistics - 3d multicolor diagram - education/business. Decrease business graph illustrations 3d statistics. Statistics - 3d multicolor diagram - education/business
Free with trial An image of a graphical pie chart, it could be useful for business concepts. Decrease business graph illustrations Pie Chart 161. An image of a graphical pie chart, it could be useful for business concepts.
Free with trial Concept of negative trend in business. Decrease business graph illustrations Negative trend
Free with trial Chart declining business icon with down arrow, bar graph, broken gear and lightning bolt, thumbs down symbol for recession, failure, crisis, loss and risk. Decrease business graph vectors Chart declining business icon with down arrow, bar graph, broken gear and lightning bolt, thumbs
Free with trial Businessman On Falling Down Chart. Business Concept Cartoon Illustration. Decrease business graph vectors Businessman On Falling Down Chart
Free with trial A big yellow pie share marked Cost threatens to eat a smaller green piece marked Profits, symbolizing a business whose costs have become too high in relation to revenue. Decrease business graph illustrations Costs Eating Profits Pie Chart. A big yellow pie share marked Cost threatens to eat a smaller green piece marked Profits, symbolizing a business whose costs have become too high in relation to revenue
Free with trial Businessman lifting up gold red from red critical graph, create by vector. Decrease business graph vectors Businessman lifting up red arrow from critical. Businessman lifting up gold red from red critical graph, create by vector
Free with trial Business decline bar graph concept drawn with chalk on a dark blackboard, illustrating decreasing performance and strategic reduction. Features a bright yellow downward arrow, white chalk elements, and ample copy space. Decrease business graph illustrations Business Decline Bar Graph Chalk Drawing Downward Yellow Arrow Strategy Concept Dark Background. Business decline bar graph concept drawn with chalk on a dark blackboard, illustrating decreasing performance and strategic reduction. Features a bright yellow downward arrow, white chalk elements, and ample copy space.
Free with trial Colorful business chart vector illustration. Decrease business graph vectors Chart illustration. Colorful business chart vector illustration
Free with trial Falling financial indicators, business profits, investment fund, investments, reduction of monetary savings, budget planning, income fall concept. Illustration in paper cut art style. Decrease business graph vectors Falling financial indicators. Illustration in paper cut art style. Falling financial indicators, business profits, investment fund, investments, reduction of monetary savings, budget planning, income fall concept. Illustration in paper cut art style.
Free with trial A simple black and white icon depicting a graph with a downward trend, indicating a decrease or decline in something, possibly related to business or finance. Decrease business graph vectors A black and white graph icon showing a decline. a simple black and white icon depicting a graph with a downward trend, indicating a decrease or decline in something, possibly related to business or finance
Free with trial Downtrend graph on a US hundred dollar note, indicating economy recession. Decrease business graph illustrations Economy recession concept. Downtrend graph on a US hundred dollar note, indicating economy recession
Free with trial An image of a graphical pie chart, it could be useful for business concepts. Decrease business graph illustrations Pie Chart 132. An image of a graphical pie chart, it could be useful for business concepts.
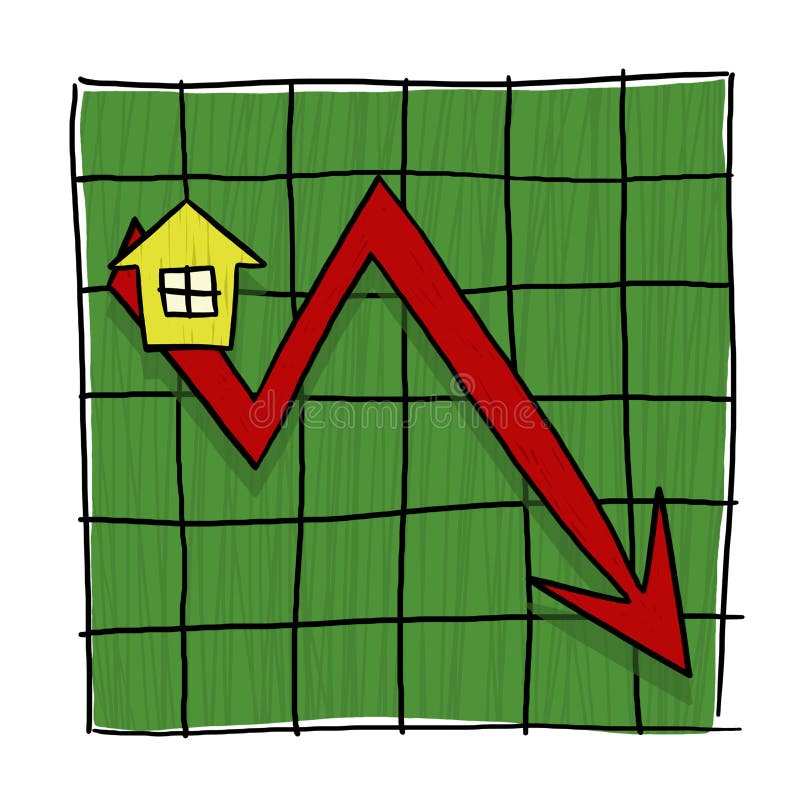
Free with trial House prices going down illustration. Home prices graph. Real estate prices going down. Decrease business graph illustrations House prices going down illustration
Free with trial Illustration of a business deal cycle with a handshake, declining graph, and circular arrows, symbolizing downturns and continuous processes. Decrease business graph illustrations Business Deal Decline Handshake Downward Graph. Illustration of a business deal cycle with a handshake, declining graph, and circular arrows, symbolizing downturns and continuous processes
Free with trial Chart representing Financial Crisis and Value Decrease. Decrease business graph illustrations Financial Crisis
Free with trial 3D Illustration of business chart up and down. Decrease business graph illustrations Chart up and down