Free with trial A flat-style illustration depicting a falling bar graph, combined with a sad face emoji and recovery arrow for financial analysis. Decrease business graph vectors Decreasing bar graph with sad face emoji and upwards arrow showing potential recovery. A flat-style illustration depicting a falling bar graph, combined with a sad face emoji and recovery arrow for financial analysis.
Free with trial A set of sixteen modern line icons depicting various business and finance concepts, including graphs, charts, planning, ideas, and global connectivity. Perfect for presentations, reports, and websites. Decrease business graph vectors Collection of Business and Finance Line Icons Set. A set of sixteen modern line icons depicting various business and finance concepts, including graphs, charts, planning, ideas, and global connectivity. Perfect for presentations, reports, and websites.
Free with trial A bar graph illustrating a decline in values with an orange downward arrow indicating loss. Decrease business graph illustrations Graph showing decline and loss with orange bars and arrow. A bar graph illustrating a decline in values with an orange downward arrow indicating loss
Free with trial A striking 3D image depicting a shopping cart overwhelmed by falling cardboard boxes, symbolizing a downturn in sales and economic decline. Ideal for finance, business, and market concepts. Decrease business graph illustrations Business Decline, Economic Downturn, Sales Decrease. A striking 3D image depicting a shopping cart overwhelmed by falling cardboard boxes, symbolizing a downturn in sales and economic decline. Ideal for finance, business, and market concepts
Free with trial A clean vector illustration of a descending bar graph, symbolizing a period of financial decline, economic recession, or poor business performance. Decrease business graph vectors Descending Bar Chart Showing Financial Decline. A clean vector illustration of a descending bar graph, symbolizing a period of financial decline, economic recession, or poor business performance
Free with trial Model of house shot on graph depicting mortgage rates. image. Decrease business graph illustrations Model of house shot on graph depicting mortgage rates.
Free with trial Model of house shot on graph depicting mortgage rates. image. Decrease business graph illustrations Model of house shot on graph depicting mortgage rates.
Free with trial A visual representation of the indian economy facing a downturn, indicated by a falling graph and the rupee symbol, set against a dark background, highlighting the financial crisis and economic challenges. Decrease business graph illustrations Indian economy crisis concept with falling graph and rupee symbol on dark background illustration design. a visual representation of the indian economy facing a downturn, indicated by a falling graph and the rupee symbol, set against a dark background, highlighting the financial crisis and economic challenges.
Free with trial A conceptual illustration depicting a line graph, structured like a broken bridge, dramatically falling and sinking into the water. This powerful visual metaphor represents a severe economic downturn, financial crisis, stock market crash, or business failure. The collapsing structure plunging into the sea symbolizes recession, bankruptcy, overwhelming debt, and hitting rock bottom. The minimalist vector art style makes it a versatile image for presentations and articles on finance, risk, and economic collapse. Decrease business graph vectors Economic Downturn and Financial Crisis Concept. A conceptual illustration depicting a line graph, structured like a broken bridge, dramatically falling and sinking into the water. This powerful visual metaphor represents a severe economic downturn, financial crisis, stock market crash, or business failure. The collapsing structure plunging into the sea symbolizes recession, bankruptcy, overwhelming debt, and hitting rock bottom. The minimalist vector art style makes it a versatile image for presentations and articles on finance, risk, and economic collapse.
Free with trial Set of twelve linear icons representing various business and financial concepts. These include documents, briefcase, graphs, charts, and more. Ideal for presentations, websites, or app design. Decrease business graph vectors Collection of Business and Finance Line Icons. Set of twelve linear icons representing various business and financial concepts. These include documents, briefcase, graphs, charts, and more. Ideal for presentations, websites, or app design.
Free with trial Steeply falling graph dark background dramatic drop crisis fall Perfect for blogs, articles, and online content. Decrease business graph illustrations Steeply falling graph, dark background, dramatic drop, crisis, fall. Steeply falling graph dark background dramatic drop crisis fall Perfect for blogs, articles, and online content
Free with trial Set of twenty different business and finance icons, perfect for presentations, websites, and applications. These simple yet effective line icons represent key concepts in the business world. Decrease business graph vectors Collection of Business and Finance Line Icons. Set of twenty different business and finance icons, perfect for presentations, websites, and applications. These simple yet effective line icons represent key concepts in the business world.
Free with trial A versatile collection of flat vector icons illustrating concepts of decline, decrease, and loss. This set features various graphics, including downward-pointing arrows, negative trend line graphs, and falling bar charts in multiple colors. These symbols are perfect for representing financial crisis, economic recession, stock market crash, business failure, or any form of reduction. Ideal for use in infographics, presentations, financial reports, websites, and data visualization projects, these modern icons effectively communicate negative trends and downturns. Isolated on a white background for easy integration into any design. Decrease business graph illustrations Financial Decline and Recession Vector Icon Set. A versatile collection of flat vector icons illustrating concepts of decline, decrease, and loss. This set features various graphics, including downward-pointing arrows, negative trend line graphs, and falling bar charts in multiple colors. These symbols are perfect for representing financial crisis, economic recession, stock market crash, business failure, or any form of reduction. Ideal for use in infographics, presentations, financial reports, websites, and data visualization projects, these modern icons effectively communicate negative trends and downturns. Isolated on a white background for easy integration into any design.
Free with trial A minimalist black vector icon illustrating a significant decline or negative trend. The image features three bar chart elements, progressively decreasing in height from left to right, symbolizing a fall in data or performance. A prominent, thick downward-pointing arrow diagonally overlays the bars, reinforcing the concept of reduction, loss, or economic downturn. Isolated on a clean white background, this graphic is ideal for financial reports, business presentations, economic analysis, or any visual communication requiring a clear representation of falling statistics or poor results. Decrease business graph vectors Business Decline Bar Chart with Down Arrow Icon. A minimalist black vector icon illustrating a significant decline or negative trend. The image features three bar chart elements, progressively decreasing in height from left to right, symbolizing a fall in data or performance. A prominent, thick downward-pointing arrow diagonally overlays the bars, reinforcing the concept of reduction, loss, or economic downturn. Isolated on a clean white background, this graphic is ideal for financial reports, business presentations, economic analysis, or any visual communication requiring a clear representation of falling statistics or poor results.
Free with trial This icon features a simple black and white representation of a bar graph with bars decreasing in height from left to right. A bold black arrow points downwards, indicating a decline or negative trend. The entire graphic is enclosed within a black circle and presented on a white background, making it a clear and concise symbol for financial or economic downturn. Decrease business graph illustrations Icon of a Falling Bar Graph with Downward Arrow Symbolizing Decline chart. This icon features a simple black and white representation of a bar graph with bars decreasing in height from left to right. A bold black arrow points downwards, indicating a decline or negative trend. The entire graphic is enclosed within a black circle and presented on a white background, making it a clear and concise symbol for financial or economic downturn
Free with trial An illustrative image showing a downward trend graph labeled with dollar signs representing cost reduction over time, accompanied by a stack of gold coins and wooden blocks spelling 'COST. Decrease business graph illustrations Cost reduction graph with stack of gold coins. An illustrative image showing a downward trend graph labeled with dollar signs representing cost reduction over time, accompanied by a stack of gold coins and wooden blocks spelling 'COST
Free with trial Set line Financial growth decrease Sales funnel with chart Pie infographic and Binary code with long shadow. Red square button. Vector. Decrease business graph illustrations Set line Financial growth decrease, Sales funnel with chart, Pie infographic and Binary code with long shadow. Red. Set line Financial growth decrease Sales funnel with chart Pie infographic and Binary code with long shadow. Red square button. Vector.
Free with trial Decline bar chart with downward trend arrow icon. Decrease, loss, and financial crisis sign symbol vector. Decrease business graph vectors Decline bar chart with downward trend arrow icon. Decrease, loss, and financial crisis sign symbol
Free with trial Red percentage symbol and downward arrow with graph line, minimalist style, white background, concept of decline or economic drop. 3D Rendering. Decrease business graph illustrations Red percentage symbol with downward arrow and graph line on white background. 3D Rendering. Red percentage symbol and downward arrow with graph line, minimalist style, white background, concept of decline or economic drop. 3D Rendering
Free with trial Hands Holding Tablet with Declining Graph and Alerts, Financial Risk Concept, illustration. Decrease business graph illustrations Hands Holding Tablet with Declining Graph and Alerts, Financial Risk Concept
Free with trial A 3D rendered blue arrow symbol, depicted as a zig-zag line with an arrowhead pointing downwards, signifies a negative trend or decline. The object is isolated on a clean white background, making it suitable for representing financial data, economic downturns, or performance metrics. Decrease business graph illustrations 3D Blue Arrow Graph Showing Downward Trend on White Background decrease. A 3D rendered blue arrow symbol, depicted as a zig-zag line with an arrowhead pointing downwards, signifies a negative trend or decline. The object is isolated on a clean white background, making it suitable for representing financial data, economic downturns, or performance metrics
Free with trial Up and down percent icon. Increase and decrease percentage arrow sign symbol vector. Decrease business graph vectors Up and down percent icon. Increase and decrease percentage arrow sign symbol
Free with trial This minimalist vector illustration depicts a declining line chart against a clean background. The graphic features a prominent red arrow pointing downward, symbolizing a negative trend or financial loss. The composition uses a professional color palette of muted grays and a bold red accent to highlight the downward movement of the data points. Decrease business graph vectors A simple line graph showing a downward trend in business performance metrics. This minimalist vector illustration depicts a declining line chart against a clean background. The graphic features a prominent red arrow pointing downward, symbolizing a negative trend or financial loss. The composition uses a professional color palette of muted grays and a bold red accent to highlight the downward movement of the data points
Free with trial Downward trend financial graph sketch illustration. Decrease business graph vectors Downward trend financial graph sketch illustration
Free with trial Stack of coins with downward trending graph arrow. A metallic downward trending graph arrow resting on a stack of silver coins against a white background. Decrease business graph illustrations Stack of coins with downward trending graph arrow. A metallic downward trending graph arrow resting on a stack of silver coins against a white background
Free with trial Close-up of a hand using stylus on tablet showing quality improvement and cost increase graph comparison. Decrease business graph illustrations Hand pointing at quality vs cost graph on tablet. Close-up of a hand using stylus on tablet showing quality improvement and cost increase graph comparison
Free with trial Worn oil barrel with red downward graph and spill, symbolizing falling oil prices, market decline, financial losses, and energy sector instability. Generative AI. Decrease business graph illustrations Oil Barrel With Falling Price Graph Economic Decline. Worn oil barrel with red downward graph and spill, symbolizing falling oil prices, market decline, financial losses, and energy sector instability. Generative AI
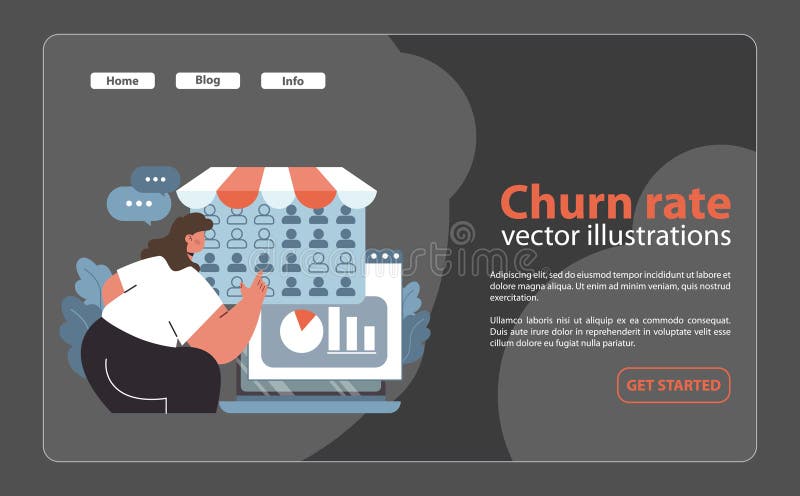
Free with trial Churn rate analytics concept. Woman studying customer retention metrics on a computer screen. Business analysis, graph visualization, and feedback tracking. Flat vector illustration. Decrease business graph vectors Churn rate analytics concept. Flat. Churn rate analytics concept. Woman studying customer retention metrics on a computer screen. Business analysis, graph visualization, and feedback tracking. Flat vector illustration
Free with trial A simple yet effective visualization showing data via a pie chart and bar graph Ideal for presentations and reports. Decrease business graph illustrations Colorful Pie Chart and Bar Graph Data Visualization. A simple yet effective visualization showing data via a pie chart and bar graph Ideal for presentations and reports
Free with trial Bar graph with blue arrow pointing down 3D illustration isolated on transparent background. Decrease business graph illustrations Bar graph with blue arrow pointing down 3D
Free with trial The image depicts a dollar sign in the center with a red downward arrow on the left and a green upward arrow on the right. This visual metaphor represents financial trends, specifically a decrease and an increase in monetary value or economic indicators. Decrease business graph illustrations Financial trend illustration showing increase and decrease with dollar sign. The image depicts a dollar sign in the center with a red downward arrow on the left and a green upward arrow on the right. This visual metaphor represents financial trends, specifically a decrease and an increase in monetary value or economic indicators
Free with trial A three-dimensional bar chart constructed from shiny golden bars depicts a clear downward trend. The bars decrease in height from left to right, creating a visual representation of decline or loss. The metallic gold material reflects light, giving the chart a polished and impactful appearance. The entire graphic is isolated on a clean white background, making the data visualization the sole focus. Decrease business graph illustrations Golden 3D bar chart showing a downward trend on a white background graph data. A three-dimensional bar chart constructed from shiny golden bars depicts a clear downward trend. The bars decrease in height from left to right, creating a visual representation of decline or loss. The metallic gold material reflects light, giving the chart a polished and impactful appearance. The entire graphic is isolated on a clean white background, making the data visualization the sole focus
Free with trial A 3D icon of a down growth arrow, isolated on a white background. Ideal for projects relating to decline, decrease, and reduction. AI-generated. Decrease business graph illustrations . A 3D icon of a down growth arrow, isolated on a white background. Ideal for projects relating to decline, decrease, and reduction. AI-generated.
Free with trial A clean, flat design illustration of a bar graph depicting a significant downward trend, highlighted by a bold blue arrow pointing downwards. Decrease business graph illustrations A bar graph showing a downward trend with a blue arrow. A clean, flat design illustration of a bar graph depicting a significant downward trend, highlighted by a bold blue arrow pointing downwards
Free with trial Fuel pump nozzle with a red handle drips oil against a gray background, accompanied by a downward trend graph indicating a decrease in fuel prices. Decrease business graph illustrations Fuel pump nozzle with a red handle drips oil against a gray background
Free with trial This image showcases a variety of modern, flat-design charts and graphs commonly used in business, finance, and data analysis. It includes bar charts, pie charts, and line graphs, presented in a clean, minimalist style with teal and gray color accents. These visual representations are ideal for illustrating trends, statistics, performance, and financial data in presentations, reports, and web content. Decrease business graph illustrations Collection of Business and Financial Charts and Graphs. This image showcases a variety of modern, flat-design charts and graphs commonly used in business, finance, and data analysis. It includes bar charts, pie charts, and line graphs, presented in a clean, minimalist style with teal and gray color accents. These visual representations are ideal for illustrating trends, statistics, performance, and financial data in presentations, reports, and web content.
Free with trial Economic crisis icon of economy depreciation and business downturn, vector line symbol. Banking investment recession, stock exchange trade fall and money value inflation icon of financial crisis. Decrease business graph vectors Economic crisis icon economy business depreciation. Economic crisis icon of economy depreciation and business downturn, vector line symbol. Banking investment recession, stock exchange trade fall and money value inflation icon of financial crisis
Free with trial A collection of six black depicting various business analytics charts and graphs, including bar charts, a pie chart, and line graphs on presentation boards. Decrease business graph vectors Black analytics chart and graph on white background. A collection of six black depicting various business analytics charts and graphs, including bar charts, a pie chart, and line graphs on presentation boards
Free with trial An image showing two arrows, one red pointing up with a percentage symbol and a white upward arrow inside, and one green pointing down with a percentage symbol and a white downward arrow inside, likely used to represent increase and decrease in percentages. Decrease business graph illustrations Up and down percentage arrows for increase and decrease. An image showing two arrows, one red pointing up with a percentage symbol and a white upward arrow inside, and one green pointing down with a percentage symbol and a white downward arrow inside, likely used to represent increase and decrease in percentages
Free with trial A 3D render shows a financial bar graph with grey concrete bars decreasing in height from left to right. A thick white arrow points downwards across the graph, intersecting a thin red line that follows the downward trend. The background is a blurred cityscape at dusk with soft lighting. Decrease business graph illustrations White arrow pointing down over grey bar graph chart. A 3D render shows a financial bar graph with grey concrete bars decreasing in height from left to right. A thick white arrow points downwards across the graph, intersecting a thin red line that follows the downward trend. The background is a blurred cityscape at dusk with soft lighting
Free with trial Bar graph growth and decline icon in flat style. Up and down arrow chart symbol. Infographic elements illustration. Decrease business graph vectors Bar graph growth and decline icon in flat style. Up and down arrow chart symbol. Infographic elements
Free with trial A businessman analyzing financial trends with wooden blocks representing growth and decline. strategic investment and risk management are key to success in the business world. economic forecast. Decrease business graph illustrations Analyzing financial trends business investment strategy risk management and growth opportunities for success. a businessman analyzing financial trends with wooden blocks representing growth and decline. strategic investment and risk management are key to success in the business world. economic forecast
Free with trial A grid of various icons related to business technology and data analysis. Generative AI. Decrease business graph illustrations Collection of Business and Technology Icons Set. A grid of various icons related to business technology and data analysis. Generative AI
Free with trial Business strategy concept showing quality improvement and cost reduction with rising bar chart and target icon represent performance optimization, efficiency, KPI achievement and smart decision making. Decrease business graph illustrations Business strategy concept showing quality improvement and cost reduction with rising bar chart and target icon represent
Free with trial Visual representation of a hand reaching out over a laptop displaying quality and cost indicators, symbolizing business analysis and performance metrics in a modern setting. Qubit. Decrease business graph illustrations Hand Reaching Out Over Laptop Displaying Quality and Cost Percentage Indicators in a Dark Background for Business. Visual representation of a hand reaching out over a laptop displaying quality and cost indicators, symbolizing business analysis and performance metrics in a modern setting. Qubit
Free with trial The image presents a comprehensive collection of 36 black and white line icons, arranged in six rows of six icons each, against a clean white background. These icons are meticulously designed to represent various aspects of finance, business, and investment. They include symbols for currencies, financial documents, graphs, buildings, security, and technology, among others. The icons are simple yet. Decrease business graph vectors Financial icons and symbols for business and investment. The image presents a comprehensive collection of 36 black and white line icons, arranged in six rows of six icons each, against a clean white background. These icons are meticulously designed to represent various aspects of finance, business, and investment. They include symbols for currencies, financial documents, graphs, buildings, security, and technology, among others. The icons are simple yet
Free with trial A 3D rendered bar graph composed of six vertical bars arranged in a descending sequence. The bars transition in color from a deep blue at the tallest end to a bright orange at the shortest end, showcasing a gradient of blues, purples, and reds. The graph is set against a clean white background with subtle shading, emphasizing the visual representation of a declining trend. Decrease business graph illustrations Decreasing Bar Graph with Gradient Colors on White Background chart statistics. A 3D rendered bar graph composed of six vertical bars arranged in a descending sequence. The bars transition in color from a deep blue at the tallest end to a bright orange at the shortest end, showcasing a gradient of blues, purples, and reds. The graph is set against a clean white background with subtle shading, emphasizing the visual representation of a declining trend
Free with trial A grid of diverse icons representing different types of charts and graphs, including bar, line, and pie charts, symbolizing data analysis and business performance metrics. Decrease business graph vectors Collection of various business and financial chart icons. A grid of diverse icons representing different types of charts and graphs, including bar, line, and pie charts, symbolizing data analysis and business performance metrics
Free with trial A vibrant bar graph graphic with a gradient of colors, representing data visualization and statistical analysis. The bars vary in height, indicating different values or categories. The image is set against a clean white background, making it suitable for a variety of applications, including presentations, reports, and website design. The color palette adds visual interest and can be used to represent trends, comparisons, or performance metrics. Decrease business graph illustrations Colorful Bar Graph Illustrating Data and Statistics. A vibrant bar graph graphic with a gradient of colors, representing data visualization and statistical analysis. The bars vary in height, indicating different values or categories. The image is set against a clean white background, making it suitable for a variety of applications, including presentations, reports, and website design. The color palette adds visual interest and can be used to represent trends, comparisons, or performance metrics.
Free with trial Concept of decline and decrease. Red arrow showing downward trend, falling graph, negative movement. Decrease business graph vectors Red arrow pointing downwards staircase falling graph. Concept of decline and decrease. Red arrow showing downward trend, falling graph, negative movement
Free with trial A black and white circular icon depicting a bar chart with three bars of decreasing height. A diagonal arrow points downwards from the tallest bar to the shortest, indicating a downward trend or decline. The icon is set against a white background. Decrease business graph illustrations Black and White Icon of a Downward Trending Bar Chart in a Circle graph decrease. A black and white circular icon depicting a bar chart with three bars of decreasing height. A diagonal arrow points downwards from the tallest bar to the shortest, indicating a downward trend or decline. The icon is set against a white background
Free with trial The image features a 3D bar graph showing an upward trend in growth, represented by increasing bar heights, followed by a sharp decline indicated by a downward arrow. A green upward arrow emphasizes the growth phase, while a downward arrow highlights the decline phase. Decrease business graph illustrations Growth and decline illustrated with bar graph and arrows. The image features a 3D bar graph showing an upward trend in growth, represented by increasing bar heights, followed by a sharp decline indicated by a downward arrow. A green upward arrow emphasizes the growth phase, while a downward arrow highlights the decline phase
Free with trial A simple line icon of a computer screen displaying a jagged downward arrow, symbolizing financial loss, economic downturn, business failure, or a decrease in performance. Decrease business graph vectors Downward trend arrow on computer monitor screen icon. A simple line icon of a computer screen displaying a jagged downward arrow, symbolizing financial loss, economic downturn, business failure, or a decrease in performance
Free with trial Graph of Fixed cost, variable costs, mixed cost to compare vector. Decrease business graph vectors Graph of Fixed cost, variable costs, mixed cost to compare
Free with trial A 3D rendered icon depicting a downward trend graph is presented on a black circular background with a polished gold rim. The graph features golden bars of decreasing height and a golden line graph with a downward-pointing arrow, clearly illustrating a decline. The entire icon is isolated on a white background, emphasizing its metallic gold and black elements. Decrease business graph illustrations Gold Downward Trend Graph Icon on Black Circle with Gold Rim on White Background chart. A 3D rendered icon depicting a downward trend graph is presented on a black circular background with a polished gold rim. The graph features golden bars of decreasing height and a golden line graph with a downward-pointing arrow, clearly illustrating a decline. The entire icon is isolated on a white background, emphasizing its metallic gold and black elements
Free with trial This image displays two distinct charts illustrating annual revenue performance over quarters. The left chart features a line graph with shaded areas, showing trends and cumulative revenue. The right chart presents a bar graph with stacked segments, offering a clear comparison of revenue contributions across different quarters. Both charts use a clean, modern design with blue, green, and gray color palettes, suitable for business presentations, financial reports, and data visualization. Decrease business graph illustrations Annual Revenue Performance Charts: Line and Bar Graphs. This image displays two distinct charts illustrating annual revenue performance over quarters. The left chart features a line graph with shaded areas, showing trends and cumulative revenue. The right chart presents a bar graph with stacked segments, offering a clear comparison of revenue contributions across different quarters. Both charts use a clean, modern design with blue, green, and gray color palettes, suitable for business presentations, financial reports, and data visualization.
Free with trial Night city, red graph decline, road, blurred lights, financial downturn. Decrease business graph illustrations Night city, red graph decline, road, blurred lights, financial downturn
Free with trial Depiction of a fluctuating red market graph displayed over a dark digital backdrop with house icons. The visualization suggests property value changes over time The image is. Decrease business graph illustrations Housing market graph showing an upward trending property value chart. Depiction of a fluctuating red market graph displayed over a dark digital backdrop with house icons. The visualization suggests property value changes over time The image is
Free with trial A black jagged line graph with sharp peaks that descends sharply to a horizontal line. Decrease business graph illustrations Black Jagged Line Graph Descending Sharply chart data. A black jagged line graph with sharp peaks that descends sharply to a horizontal line
Free with trial A simple graphic representing a downward trend in business or finance. Shows a bar chart with decreasing heights and a clear arrow indicating a fall. Perfect for representing loss or decline. Decrease business graph vectors Down trend bar chart arrow icon business finance drop. A simple graphic representing a downward trend in business or finance. Shows a bar chart with decreasing heights and a clear arrow indicating a fall. Perfect for representing loss or decline.
Free with trial A collection of eight black silhouette representing various business analytics charts, including bar graphs, pie charts, and line graphs, against a white background. Decrease business graph vectors Set of black silhouette for business analytics charts. A collection of eight black silhouette representing various business analytics charts, including bar graphs, pie charts, and line graphs, against a white background
Free with trial A simple blue line graph with circular data points is displayed against a clean white background with subtle horizontal grid lines. The graph shows fluctuations and trends, making it suitable for representing data, analytics, or financial performance. Generated by AI. Decrease business graph vectors Blue Line Graph with Data Points on White Background. A simple blue line graph with circular data points is displayed against a clean white background with subtle horizontal grid lines. The graph shows fluctuations and trends, making it suitable for representing data, analytics, or financial performance. Generated by AI
Free with trial Abstract Black White Up Down Arrows Growth Chart Business Infographic Design. Generative AI. Decrease business graph illustrations Abstract Black White Up Down Arrows Growth Chart Business Infographic Design
Free with trial Gray bar chart with red line graph and downward arrow, illustrating decline, decrease, loss, and negative trend. Decrease business graph vectors Bar chart with downward red arrow, symbolizing decline. Gray bar chart with red line graph and downward arrow, illustrating decline, decrease, loss, and negative trend
Free with trial A whiteboard on an easel displaying a red bar graph with a downward trend, indicated by a large red arrow. Decrease business graph illustrations A red graph on a whiteboard showing a downward trend. a whiteboard on an easel displaying a red bar graph with a downward trend, indicated by a large red arrow
Free with trial A stylized image depicts a magnifying glass focusing on a declining bar graph being passed from one hand to another. Decrease business graph illustrations Declining Market Analysis Magnifying Glass, Graph, Hands. A stylized image depicts a magnifying glass focusing on a declining bar graph being passed from one hand to another.
Free with trial This image represents a stock market crash with falling red arrows, symbolizing financial crisis, recession, investment loss, and business decline. It conveys a sense of economic downturn. Decrease business graph illustrations Stock market crash falling red arrow financial crisis recession investment loss business decline economy down. This image represents a stock market crash with falling red arrows, symbolizing financial crisis, recession, investment loss, and business decline. It conveys a sense of economic downturn.
Free with trial 3D graphic depicts a steeply declining bar graph in red hues, showing economic loss. A downward-sloping arrow extends over the bars, illustrating the negative trend. The text reads "-40% PROFIT," emphasizing financial decline. The bars decrease in height from left to right, indicating progressive loss. The background is a dark grid, enhancing the focus on the graph. The visual conveys the concept of significant profit reduction and economic downturn. Decrease business graph illustrations 3D Financial Concept of Profit Loss and Economic Decline. 3D graphic depicts a steeply declining bar graph in red hues, showing economic loss. A downward-sloping arrow extends over the bars, illustrating the negative trend. The text reads "-40% PROFIT," emphasizing financial decline. The bars decrease in height from left to right, indicating progressive loss. The background is a dark grid, enhancing the focus on the graph. The visual conveys the concept of significant profit reduction and economic downturn.
Free with trial Sharp downward sloping line graph red arrow pointing down background red Suitable for digital platforms. Decrease business graph illustrations Sharp downward sloping line graph, red arrow pointing down, background, red. Sharp downward sloping line graph red arrow pointing down background red Suitable for digital platforms
Free with trial This vector illustration features a comprehensive set of modern infographic and decision-making elements, isolated on a clean white background with subtle reflections. The collection includes stylized casino chips marked "YES" and "NO" for choices, various bar charts depicting growth and data, and segmented donut pie charts representing proportions. An abstract 3D shape adds a contemporary touch. Ideal for presentations, business reports, websites, and applications requiring visual representation of data, statistics, polls, and strategic decisions in a clean, professional design. Decrease business graph vectors Business Infographics and Decision Making Elements Set. This vector illustration features a comprehensive set of modern infographic and decision-making elements, isolated on a clean white background with subtle reflections. The collection includes stylized casino chips marked "YES" and "NO" for choices, various bar charts depicting growth and data, and segmented donut pie charts representing proportions. An abstract 3D shape adds a contemporary touch. Ideal for presentations, business reports, websites, and applications requiring visual representation of data, statistics, polls, and strategic decisions in a clean, professional design.
Free with trial Simple Bar Chart Showing Business Growth and Data Trends. Decrease business graph vectors Simple Bar Chart Showing Business Growth and Data Trends
Free with trial A depiction of business challenges with a figure expressing concern over declining market trends, represented by stacks of coins and a decreasing chart. Decrease business graph illustrations Business Struggles and Market Trends with Coins and Figure. A depiction of business challenges with a figure expressing concern over declining market trends, represented by stacks of coins and a decreasing chart
Free with trial A 3D illustration shows a red arrow graph descending sharply over a series of stacked white coins. The coins are arranged in decreasing height, visually representing a financial decline or loss. The composition is set against a clean white background. Decrease business graph illustrations A red arrow graph showing a downward trend over stacked white coins on a white background. A 3D illustration shows a red arrow graph descending sharply over a series of stacked white coins. The coins are arranged in decreasing height, visually representing a financial decline or loss. The composition is set against a clean white background
Free with trial 3d bar graph illustrating financial growth with upward green arrow and downward red arrows indicating trends. Decrease business graph vectors Bar graph rising with arrows showing increase decrease. 3d bar graph illustrating financial growth with upward green arrow and downward red arrows indicating trends
Free with trial Global stock market fluctuations shown on a tablet in a business office, breathtaking wallpaper background Generative AI. Decrease business graph illustrations Global stock market fluctuations shown on a tablet in a business office
Free with trial Broken 3D bar chart highlighting severe financial losses and business downturn. Decrease business graph illustrations Broken 3D Bar Chart Indicating Significant Business Financial Losses and Performance Decline. Broken 3D bar chart highlighting severe financial losses and business downturn
Free with trial Stock market graph with red candlesticks and downward arrow, displayed on a light background. Concept of economic decline. 3D Rendering. Decrease business graph illustrations Financial stock market graph with downward trend and arrow on light background. 3D Rendering. Stock market graph with red candlesticks and downward arrow, displayed on a light background. Concept of economic decline. 3D Rendering
Free with trial The image depicts a bar graph on an easel with a prominent red downward arrow overlaying it. The bars in the graph show a decreasing trend from left to right, indicating a decline in values. The background is plain and gray, focusing attention on the graph and the red arrow. Decrease business graph illustrations Downward trend in bar graph with a prominent red arrow. The image depicts a bar graph on an easel with a prominent red downward arrow overlaying it. The bars in the graph show a decreasing trend from left to right, indicating a decline in values. The background is plain and gray, focusing attention on the graph and the red arrow
Free with trial Red cube with arrow up. Business and market growth concept. Close-up. Decrease business graph illustrations Red cube with arrow up. Business and market growth concept
Free with trial Red cube with arrow up. Business and market growth concept. Close-up. Decrease business graph illustrations Red cube with arrow up. Business and market growth concept