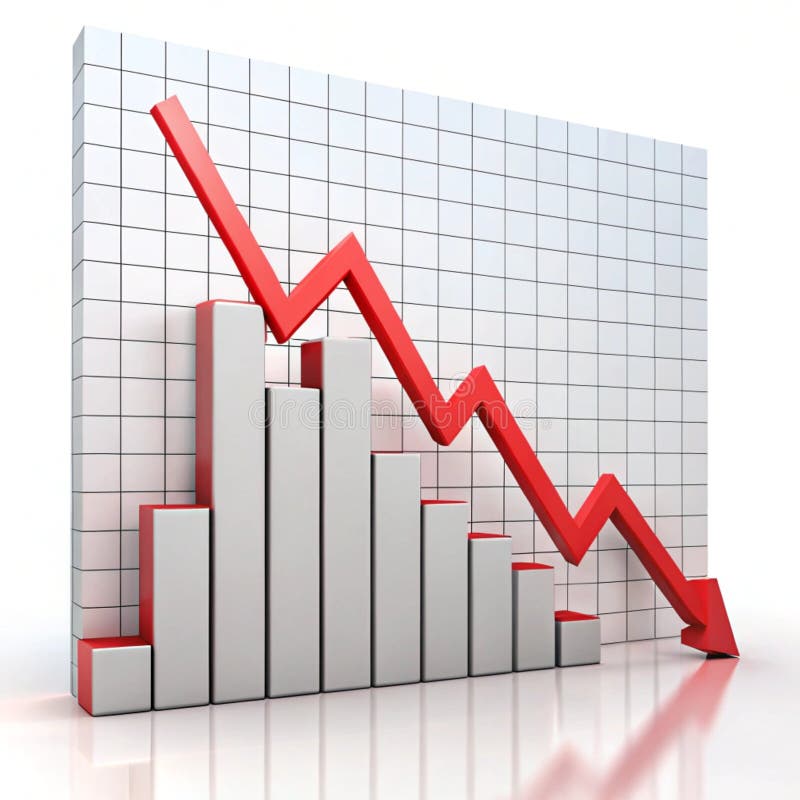
Free with trial This graphic features a stylized bar chart with a descending red arrow, symbolizing a downward trend. The image is presented in a split design, with the left side on a white background and the right side on a red background. This visual metaphor is ideal for representing financial losses, declining performance, economic downturns, or any situation indicating a negative trajectory. Its clean, minimalist style makes it versatile for various business, financial, and analytical contexts. Decrease business graph illustrations Red Downward Trend Graph with Arrow. This graphic features a stylized bar chart with a descending red arrow, symbolizing a downward trend. The image is presented in a split design, with the left side on a white background and the right side on a red background. This visual metaphor is ideal for representing financial losses, declining performance, economic downturns, or any situation indicating a negative trajectory. Its clean, minimalist style makes it versatile for various business, financial, and analytical contexts.
Free with trial Creative collection of wooden block icons illustrating various business growth statistics with positive and negative trends, perfect for presentations and reports. Decrease business graph illustrations Colorful business growth statistics blocks. Creative collection of wooden block icons illustrating various business growth statistics with positive and negative trends, perfect for presentations and reports
Free with trial Red arrow graph showing a downward trend on a grid background with a sharp decline at the end. Decrease business graph illustrations Red downward arrow graph on grid background. Red arrow graph showing a downward trend on a grid background with a sharp decline at the end
Free with trial Business and finance isometric illustrations set. Vector made with AI. Decrease business graph vectors Business and finance isometric illustrations set
Free with trial A comprehensive set of minimalist linear icons depicting financial analytics and business trends, featuring stacks of coins and both upward and downward trending bar charts. Decrease business graph vectors Linear Business and Financial Growth Icon Set for Analytics, Investment, and Economic Trend Visualization. A comprehensive set of minimalist linear icons depicting financial analytics and business trends, featuring stacks of coins and both upward and downward trending bar charts.
Free with trial A 3D rendered bar chart encased in clear glass, displaying year-end business performance. The chart features three vertical bars in blue, pink, and yellow, representing 61%, 24%, and 35% respectively. The clean, modern design and transparent material create a sophisticated visual suitable for presentations, reports, and data visualization concepts related to business growth, financial analysis, and success metrics. Decrease business graph illustrations Year End Business Performance Chart. A 3D rendered bar chart encased in clear glass, displaying year-end business performance. The chart features three vertical bars in blue, pink, and yellow, representing 61%, 24%, and 35% respectively. The clean, modern design and transparent material create a sophisticated visual suitable for presentations, reports, and data visualization concepts related to business growth, financial analysis, and success metrics.
Free with trial A man in a suit holds a phone and a stylus, interacting with a projected bar graph showing a downward trend in profits and an upward trend in costs. Decrease business graph illustrations Businessman analyzes declining profits and rising costs using digital graph on a dark background. A man in a suit holds a phone and a stylus, interacting with a projected bar graph showing a downward trend in profits and an upward trend in costs
Free with trial A stark, neon yellow line graph depicts a sharp downward trend on a dark, grid-lined background, symbolizing economic recession. Decrease business graph illustrations Neon yellow downward trending graph illustrating financial decline against a dark grid background. A stark, neon yellow line graph depicts a sharp downward trend on a dark, grid-lined background, symbolizing economic recession
Free with trial A neon orange graph on a black background shows a sharp decline, symbolizing financial loss or a negative trend. Decrease business graph illustrations Neon orange downward trending graph with arrow indicating financial decline on a black background. A neon orange graph on a black background shows a sharp decline, symbolizing financial loss or a negative trend
Free with trial A person's open palm supports a glowing neon graph illustrating the relationship between cost and quality with upward and downward arrows. Decrease business graph illustrations Hand holding glowing cost quality graph palm open. A person's open palm supports a glowing neon graph illustrating the relationship between cost and quality with upward and downward arrows
Free with trial A 3D rendered image of a descending bar chart with teal and gray bars, each progressively lower than the previous, representing a financial or economic downturn. A bold red arrow slants downward across the bars, symbolizing decline. The graph is displayed against a dark background with white grid lines and axis labels, evoking a business or stock market concept. Isolated on a clean, dark surface. Decrease business graph illustrations 3D rendered bar chart with red arrow showing financial decline. A 3D rendered image of a descending bar chart with teal and gray bars, each progressively lower than the previous, representing a financial or economic downturn. A bold red arrow slants downward across the bars, symbolizing decline. The graph is displayed against a dark background with white grid lines and axis labels, evoking a business or stock market concept. Isolated on a clean, dark surface.
Free with trial A simple line drawing depicts a person experiencing stress while looking at a computer screen displaying a downward-trending graph. The illustration conveys the concept of financial anxiety, market volatility, and economic downturn. The image is suitable for use in articles, presentations, and websites related to finance, economics, mental health, and business. Decrease business graph vectors Financial Stress and Market Downturn. A simple line drawing depicts a person experiencing stress while looking at a computer screen displaying a downward-trending graph. The illustration conveys the concept of financial anxiety, market volatility, and economic downturn. The image is suitable for use in articles, presentations, and websites related to finance, economics, mental health, and business.
Free with trial Bar graph with a downward arrow on a school hallway floor. Concept of declining performance, budget cuts, or failure in education and student outcomes. Decrease business graph illustrations Bar graph with a downward arrow on a school hallway floor. Concept of declining performance, budget cuts, or failure in education
Free with trial Concept of real estate market fluctuations with miniature houses and rising graph lines. Vibrant tones and a grid layout convey, economic trends. Rising property values concept with red houses layout on rising red line graph on abstract blue background. 3D rendering. Decrease business graph illustrations 3D rendering of miniature red houses on a rising graph, real estate market fluctuations. Concept of real estate market fluctuations with miniature houses and rising graph lines. Vibrant tones and a grid layout convey, economic trends. Rising property values concept with red houses layout on rising red line graph on abstract blue background. 3D rendering
Free with trial A vibrant 3D bar chart, featuring glossy blue and orange rectangular segments, illustrates data progression or comparison. The varying bar heights convey growth or statistical analysis. This modern graphic is ideal for business, finance, and analytical concepts, presented cleanly isolated on a transparent background. Decrease business graph vectors Glossy 3D bar chart showing data growth and statistics with blue and orange segments, perfect for business and finance presentatio. A vibrant 3D bar chart, featuring glossy blue and orange rectangular segments, illustrates data progression or comparison. The varying bar heights convey growth or statistical analysis. This modern graphic is ideal for business, finance, and analytical concepts, presented cleanly isolated on a transparent background.
Free with trial Downward graph chart isolated on transparent background. Decrease business graph illustrations Downward graph chart
Free with trial This set includes 15 high-quality, vector business icons representing various aspects of finance, networking, and growth. Perfect for websites, presentations, and applications. These simple yet effective icons provide visual clarity and professionalism. Decrease business graph illustrations Business Icon Set. This set includes 15 high-quality, vector business icons representing various aspects of finance, networking, and growth. Perfect for websites, presentations, and applications. These simple yet effective icons provide visual clarity and professionalism.
Free with trial A single ripe yellow banana is positioned on a white surface. A colorful, downward-trending graph with a zigzag pattern is depicted behind and partially over the banana. The graph transitions from gray to green, yellow, orange, and finally a red arrow pointing downwards, symbolizing a negative trend or decline. Decrease business graph illustrations Banana with Downward Trend Graph on White Background fruit food. A single ripe yellow banana is positioned on a white surface. A colorful, downward-trending graph with a zigzag pattern is depicted behind and partially over the banana. The graph transitions from gray to green, yellow, orange, and finally a red arrow pointing downwards, symbolizing a negative trend or decline
Free with trial Coal with a falling stock market graph. Created with the help of Generative AI tools. Decrease business graph illustrations Coal with a falling stock market graph.
Free with trial Illustration depicting india's economy facing a downturn, with a graph showing a downward trend. This image represents a financial crisis, stock market crash, or economic recession in india. 200. Decrease business graph illustrations India economy crisis financial market stock market crash recession economic downturn graph chart down 100. illustration depicting india's economy facing a downturn, with a graph showing a downward trend. This image represents a financial crisis, stock market crash, or economic recession in india. 200
Free with trial Illuminated descending bar graph against a gradient blue background suggesting decline. Generative AI. Decrease business graph illustrations Illuminated descending bar graph against a gradient blue background suggesting decline
Free with trial This minimalist graphic illustration features a bold red line chart indicating a significant decline in value. The visual includes a currency symbol and bar segments set against a clean background to represent economic loss or market downturn. The sharp downward arrow emphasizes a negative trajectory in fiscal data and business analytics. Decrease business graph vectors A red line graph showing a downward trend in financial performance. This minimalist graphic illustration features a bold red line chart indicating a significant decline in value. The visual includes a currency symbol and bar segments set against a clean background to represent economic loss or market downturn. The sharp downward arrow emphasizes a negative trajectory in fiscal data and business analytics
Free with trial A striking 3D render features a prominent, glossy red arrow pointing downwards, symbolizing a decline, loss, or negative trend. This arrow is positioned in the foreground, partially obscuring a bright, modern office interior. The office space includes desks, chairs, plants, and overhead lighting, suggesting a corporate or business environment. The image effectively conveys concepts such as economic recession, stock market crash, business failure, or a downward trend in performance. It is ideal for illustrating financial reports, business news, or any content related to negative business outcomes. Decrease business graph illustrations Red Downward Arrow Symbolizing Business Decline in Modern Office. A striking 3D render features a prominent, glossy red arrow pointing downwards, symbolizing a decline, loss, or negative trend. This arrow is positioned in the foreground, partially obscuring a bright, modern office interior. The office space includes desks, chairs, plants, and overhead lighting, suggesting a corporate or business environment. The image effectively conveys concepts such as economic recession, stock market crash, business failure, or a downward trend in performance. It is ideal for illustrating financial reports, business news, or any content related to negative business outcomes.
Free with trial Flat illustration showing a graph document and dollar coin engulfed in flames, representing financial loss and economic crisis. Decrease business graph vectors Financial Loss Concept: Burning Money with Graph Document on Fire, Economic Crisis. Flat illustration showing a graph document and dollar coin engulfed in flames, representing financial loss and economic crisis.
Free with trial Flat vector illustration of a chart depicting a negative trend, accompanied by a sad face icon, suggesting business decline or failure. Decrease business graph vectors A chart showing a negative trend with a sad face icon, indicating a decline in business. Flat vector illustration of a chart depicting a negative trend, accompanied by a sad face icon, suggesting business decline or failure.
Free with trial A conceptual icon representing the rejection or failure of a business strategy. Decrease business graph vectors Discarding Business Growth Concept Icon. A conceptual icon representing the rejection or failure of a business strategy
Free with trial A vibrant red arrow curves and points downwards against a clean white background. This 3D rendered illustration conveys the concept of decline, decrease, or downward trend. Its clean design makes it suitable for a variety of applications, including business presentations, financial reports, and data visualizations. The image is versatile and can be used to represent negative growth, falling prices, or other downward movements. Decrease business graph illustrations Red Arrow Pointing Down - Decline Concept. A vibrant red arrow curves and points downwards against a clean white background. This 3D rendered illustration conveys the concept of decline, decrease, or downward trend. Its clean design makes it suitable for a variety of applications, including business presentations, financial reports, and data visualizations. The image is versatile and can be used to represent negative growth, falling prices, or other downward movements.
Free with trial A photorealistic 3D render depicts a smartphone displaying a stock market trading analysis app. The screen shows a prominent red downward trending line graph overlaid on blue bar graphs. Surrounding the phone are 3D rendered dollar signs and bills, suggesting a financial context. The overall color scheme is dark with vibrant accents of red and blue in the graphs. The style is clean and modern,. Decrease business graph illustrations 3 D Stock Trading Analysis App Smartphone Displaying Red Downward Trend Graph. A photorealistic 3D render depicts a smartphone displaying a stock market trading analysis app. The screen shows a prominent red downward trending line graph overlaid on blue bar graphs. Surrounding the phone are 3D rendered dollar signs and bills, suggesting a financial context. The overall color scheme is dark with vibrant accents of red and blue in the graphs. The style is clean and modern,
Free with trial Red arrow pointing down graph shows market crash red arrow economics red AI-generated for unique and creative designs. Decrease business graph illustrations Red arrow pointing down, graph shows market crash , red arrow, economics, red. Red arrow pointing down graph shows market crash red arrow economics red AI-generated for unique and creative designs
Free with trial Bar graph growth and decline icon in flat style. Up and down arrow chart symbol illustration. Decrease business graph vectors Bar graph growth and decline icon in flat style. Up and down arrow chart symbol
Free with trial Orange bars on white platform show sharp downward trend with arrow pointing down. Represents economic decline, business failure, financial crisis. Conceptual graphic for market. Decrease business graph illustrations Orange bars on white platform show sharp downward trend with arrow pointing down. Represents economic decline, business failure
Free with trial Set line Falling property prices, Dollar rate decrease, Global economic crisis and Safe icon. Vector. Decrease business graph vectors Set line Falling property prices, Dollar rate decrease, Global economic crisis and Safe icon. Vector
Free with trial Wooden blocks with percent signs sit on stacks of coins. A red graph trending downwards is in the, background indicating financial loss and economic recession. Decrease business graph illustrations Wooden blocks with percent signs sit on stacks of coins. A red graph trending downwards is in the background indicating financial. Wooden blocks with percent signs sit on stacks of coins. A red graph trending downwards is in the, background indicating financial loss and economic recession.
Free with trial Simple 3D bar graph with colored bars on a white background, representing data comparison. Decrease business graph illustrations Colorful Bar Graph Illustration on White. Simple 3D bar graph with colored bars on a white background, representing data comparison
Free with trial Hand holding holographic financial graph. Decrease business graph illustrations Hand Holding Evolving Green Financial Data Graph and Cityscape - Investment Growth Concept. Hand holding holographic financial graph
Free with trial Near a graph that symbolizes the rising and falling trends in logistics, a female courier is illustrated, and her. Decrease business graph illustrations Near a graph that symbolizes the rising and falling trends in logistics, a female courier is illustrated, and her
Free with trial A red candlestick chart digital market crash glitchy financial stock graph downward trend loss dramatic. Decrease business graph illustrations Red candlestick chart digital market crash glitchy financial stock graph downward trend loss dramatic
Free with trial A simple line graph showing a downward trend. The graph features a single black line that starts high on the left and ends low on the right, with a jagged pattern in between. The line ends with a large arrow pointing downwards, emphasizing the decline. The graph is set against a white background with a black border, making it a clear and concise visual representation of a decreasing trend. Decrease business graph vectors Downward Trend Graph. A simple line graph showing a downward trend. The graph features a single black line that starts high on the left and ends low on the right, with a jagged pattern in between. The line ends with a large arrow pointing downwards, emphasizing the decline. The graph is set against a white background with a black border, making it a clear and concise visual representation of a decreasing trend.
Free with trial A collection of business-related icons illustrating various aspects of business, including target achievement, growth, decline, and organizational structure. Decrease business graph vectors Vector art of a set of business icons, , representing target achievement, growth, decline, and structure in a business or. A collection of business-related icons illustrating various aspects of business, including target achievement, growth, decline, and organizational structure
Free with trial A simple line graph showing a downward trend. The graph features a single black line that starts high on the left and descends to the right, ending in a downward-pointing arrow. The background is white, providing a clean and neutral contrast to the black line. Decrease business graph vectors Downward Trend Graph. A simple line graph showing a downward trend. The graph features a single black line that starts high on the left and descends to the right, ending in a downward-pointing arrow. The background is white, providing a clean and neutral contrast to the black line.
Free with trial Red declining stock market graph over a world map on a white background. Concept of global financial crisis. 3D Rendering. Decrease business graph illustrations Red declining stock market graph on white background. 3D Rendering. Red declining stock market graph over a world map on a white background. Concept of global financial crisis. 3D Rendering
Free with trial 3D Illustration of Abstract Bar Graph finance. Decrease business graph illustrations 3D Illustration of Abstract Bar Graph
Free with trial Decline bar chart with downward trend arrow icon vector. Decrease, loss, and financial drop symbol. Editable stroke. Decrease business graph vectors Decline bar chart with downward trend arrow icon. Decrease, loss, and financial drop symbol. Editable stroke
Free with trial A red arrow dramatically points downward on a flip chart displaying a sharply declining sales graph in a modern office setting. The image symbolizes business downturn, financial loss, and market recession. Ideal for illustrating negative trends, economic crisis, and failed business strategies, generated by AI. Decrease business graph illustrations Decreasing sales chart on flip chart in office. A red arrow dramatically points downward on a flip chart displaying a sharply declining sales graph in a modern office setting. The image symbolizes business downturn, financial loss, and market recession. Ideal for illustrating negative trends, economic crisis, and failed business strategies, generated by AI.
Free with trial A downward trending graph chart isolated on a white background, perfect for financial analysis. Decrease business graph illustrations Downward graph chart. A downward trending graph chart isolated on a white background, perfect for financial analysis
Free with trial A female courier is depicted near a rising and falling graph, symbolizing the fluctuating trends in the logistics. Decrease business graph illustrations A female courier is depicted near a rising and falling graph, symbolizing the fluctuating trends in the logistics
Free with trial Red arrow pointing down, falling concept of loss market crash, falling red arrow indicating a decrease in value, big red arrow going down, business loss financial decline economic fall recession. Decrease business graph vectors Red arrow pointing down, falling concept of loss market crash. Red arrow pointing down, falling concept of loss market crash, falling red arrow indicating a decrease in value, big red arrow going down, business loss financial decline economic fall recession.
Free with trial Business decline trend illustrated with wooden blocks forming a bar chart, indicating financial loss, recession, or market downturn. Features red down arrows on a bright yellow background with ample copy space. Perfect for reports, web banners, and marketing materials. Decrease business graph illustrations Business Decline Trend Wooden Blocks Chart Red Down Arrows Bright Yellow Background Copy Space. Business decline trend illustrated with wooden blocks forming a bar chart, indicating financial loss, recession, or market downturn. Features red down arrows on a bright yellow background with ample copy space. Perfect for reports, web banners, and marketing materials.
Free with trial Creative collection of wooden block icons illustrating various business growth statistics with positive and negative trends, perfect for presentations and reports. Decrease business graph illustrations Colorful business growth statistics blocks. Creative collection of wooden block icons illustrating various business growth statistics with positive and negative trends, perfect for presentations and reports
Free with trial A bar chart displayed on an easel, illustrating a negative trend. The bars, a mix of blue and grey, show a progressive decrease in value. A prominent red arrow curves downwards across the chart, signifying a decline or loss. The presentation suggests a financial report or business analysis with unfavorable results. Decrease business graph illustrations Bar chart showing a downward trend with a red arrow indicating decline. A bar chart displayed on an easel, illustrating a negative trend. The bars, a mix of blue and grey, show a progressive decrease in value. A prominent red arrow curves downwards across the chart, signifying a decline or loss. The presentation suggests a financial report or business analysis with unfavorable results
Free with trial This 3D illustration features a vertical bar graph with columns of varying heights, indicating a clear decline in performance. Bright red arrows point downward, emphasizing the negative trend and loss of value. The clean, minimalist design uses a simple color palette against a neutral background, making it ideal for financial or business presentations. Decrease business graph vectors A three dimensional bar chart showing a downward trend with red arrows. This 3D illustration features a vertical bar graph with columns of varying heights, indicating a clear decline in performance. Bright red arrows point downward, emphasizing the negative trend and loss of value. The clean, minimalist design uses a simple color palette against a neutral background, making it ideal for financial or business presentations
Free with trial This image presents a clean, minimalist graphic illustrating economic trends. It features two distinct charts: a line graph on the left showing fluctuating data points over time, and a bar chart on the right comparing values across categories. The charts use a simple black and white color scheme with grayscale elements, making them versatile for various business and financial contexts. Labels like 'ECONOMIC', 'PARCTIRUM', and 'PLACTIRUM' suggest analysis of economic performance and market data. The overall design emphasizes clarity and data visualization. Decrease business graph vectors Economic Growth Trends: Line and Bar Charts. This image presents a clean, minimalist graphic illustrating economic trends. It features two distinct charts: a line graph on the left showing fluctuating data points over time, and a bar chart on the right comparing values across categories. The charts use a simple black and white color scheme with grayscale elements, making them versatile for various business and financial contexts. Labels like 'ECONOMIC', 'PARCTIRUM', and 'PLACTIRUM' suggest analysis of economic performance and market data. The overall design emphasizes clarity and data visualization.
Free with trial A prominent red downward arrow conveys a strong message of decline, loss, or a negative trend. Ideal for financial reports, business analytics, and economic downturn concepts. Decrease business graph illustrations Red downward arrow symbolizing business decline and financial loss in a clean setting white background. A prominent red downward arrow conveys a strong message of decline, loss, or a negative trend. Ideal for financial reports, business analytics, and economic downturn concepts
Free with trial Colorful 3D illustration of a bar graph made of pastel-colored blocks on a wooden base Generative AI. Decrease business graph illustrations Colorful 3D illustration of a bar graph made of pastel-colored blocks on a wooden base
Free with trial Declining stock market graph on smartphone screen indicates financial loss or crisis. Decrease business graph illustrations Smartphone screen displays declining stock market graph with red arrow. Declining stock market graph on smartphone screen indicates financial loss or crisis
Free with trial Growth and decline graph report icon illustration. Financial chart arrow up and down symbol on black circle. Decrease business graph vectors Growth and decline graph report icon. Financial chart arrow up and down symbol on black circle
Free with trial Dollar arrow up and down icon on circle line. USD currency increase and decrease concept vector. Decrease business graph vectors Dollar arrow up and down icon on circle line. USD currency increase and decrease concept
Free with trial A bold red downward-pointing arrow icon featuring a black zero percent symbol in the center, indicating no change or zero percent decrease. Clean and modern design, ideal for business, finance, and data presentations. Decrease business graph illustrations Red downward arrow with zero percent symbol. A bold red downward-pointing arrow icon featuring a black zero percent symbol in the center, indicating no change or zero percent decrease. Clean and modern design, ideal for business, finance, and data presentations
Free with trial Stock quotes icons set in outline stroke design for web. Pack line pictograms with increase, decrease, exchange currency, investment portfolio, bear, bull, watch list, other. Vector illustration. Decrease business graph vectors Stock quotes icons set in outline stroke design for web. Pack line pictograms with increase, decrease, exchange currency
Free with trial A stark red line graph illustrates a sharp decline in the stock market, symbolizing financial loss, market downturn, and economic recession. Ideal for illustrating concepts of risk, volatility, and investment crisis. Represents negative growth and market fluctuation. Perfect for financial news, reports, and presentations. Generated by AI. Decrease business graph illustrations Red stock market graph showing decline trend. A stark red line graph illustrates a sharp decline in the stock market, symbolizing financial loss, market downturn, and economic recession. Ideal for illustrating concepts of risk, volatility, and investment crisis. Represents negative growth and market fluctuation. Perfect for financial news, reports, and presentations. Generated by AI.
Free with trial Recession concept. Falling market. The trading broker is horrified at the falling market. Financial graph down. Vector illustration isometric design. Decrease business graph vectors Recession concept. Falling market. Financial graph down. Vector illustration isometric design. Recession concept. Falling market. The trading broker is horrified at the falling market. Financial graph down. Vector illustration isometric design.
Free with trial Red arrow pointing down graph shows market crash losses slump AI-generated for unique and creative designs. Decrease business graph illustrations Red arrow pointing down, graph shows market crash , losses, slump. Red arrow pointing down graph shows market crash losses slump AI-generated for unique and creative designs
Free with trial A dramatic illustration portrays the impact of an economic downturn. A stark, downward trending graph overlaid on a dark cityscape of towering skyscrapers creates a sense of foreboding. This conceptual image, rendered in digital art, represents a financial crisis, market crash, or recession. Its use of red hues and a falling trend effectively communicates risk, loss, and potential failure in the. Decrease business graph illustrations Economic downturn depicted with downward trending graph and skyline of a modern city. A dramatic illustration portrays the impact of an economic downturn. A stark, downward trending graph overlaid on a dark cityscape of towering skyscrapers creates a sense of foreboding. This conceptual image, rendered in digital art, represents a financial crisis, market crash, or recession. Its use of red hues and a falling trend effectively communicates risk, loss, and potential failure in the
Free with trial Dollar arrow up and down icon vector on black circle. USD currency increase and decrease concept. Decrease business graph vectors Dollar arrow up and down icon on black circle. USD currency increase and decrease concept
Free with trial A 3D abstract representation of a falling graph with concrete texture and orange accents, with small orange particles floating around it on a white background. Decrease business graph illustrations 3D abstract graph falling down with particles. A 3D abstract representation of a falling graph with concrete texture and orange accents, with small orange. A 3D abstract representation of a falling graph with concrete texture and orange accents, with small orange particles floating around it on a white background
Free with trial This vibrant vector illustration showcases a collection of red and orange gradient arrows, all pointing downwards. The set includes both straight and dynamically curved arrows, effectively symbolizing various forms of decline, decrease, or negative trends. Perfect for use in business presentations, financial reports, infographics, or any design requiring a clear visual representation of falling statistics, market drops, recession, loss, or a general downward movement. The clean, modern flat design ensures versatility and impact. Decrease business graph vectors Downward Trend Red Gradient Arrows Vector Set. This vibrant vector illustration showcases a collection of red and orange gradient arrows, all pointing downwards. The set includes both straight and dynamically curved arrows, effectively symbolizing various forms of decline, decrease, or negative trends. Perfect for use in business presentations, financial reports, infographics, or any design requiring a clear visual representation of falling statistics, market drops, recession, loss, or a general downward movement. The clean, modern flat design ensures versatility and impact.
Free with trial This detailed graph presents the relationship between unemployment rates and gold demand, illustrating economic trends through visual data. Decrease business graph illustrations Unemployment and Gold Demand Contrast Illustrated in Graph Format with Data Representation. This detailed graph presents the relationship between unemployment rates and gold demand, illustrating economic trends through visual data
Free with trial Decrease and increase chart icon illustration with arrow. Negative and positive trend symbol in black circle. Decrease business graph vectors Decrease and increase chart icon with arrow. Negative and positive trend symbol in black circle
Free with trial A minimalist, flat design illustration featuring a simple line graph. The graph has a blue, curved line representing data that initially dips and then rises, with a prominent blue dot marking a key point. It is presented against a clean white background with a black coordinate system, including axes labeled with 'x' and tick marks. This graphic is ideal for representing concepts related to data analysis, growth, trends, statistics, and mathematical functions. Decrease business graph vectors Abstract Graph Curve with Axes and Data Point. A minimalist, flat design illustration featuring a simple line graph. The graph has a blue, curved line representing data that initially dips and then rises, with a prominent blue dot marking a key point. It is presented against a clean white background with a black coordinate system, including axes labeled with 'x' and tick marks. This graphic is ideal for representing concepts related to data analysis, growth, trends, statistics, and mathematical functions.
Free with trial A computer screen displaying a stock market graph with red and green bars. the graph shows the stock's performance over time, with the x-axis representing time and the y-axis representing price. the red and green bars indicate the stock's price movements, with red indicating a decrease in price and green indicating an increase. the graph also includes several lines that represent different moving. This image was generated using artificial intelligence. Decrease business graph illustrations A computer screen displaying a stock market graph with red and green bars
Free with trial A 3d bar graph with rainbow colors and an orange arrow pointing downwards to indicate a decline or decrease in trend. the bars are arranged in a descending order with the tallest bar on the left and the shortest on the right. the background is plain white. Decrease business graph illustrations A colorful bar graph showing a decline in trend. a 3d bar graph with rainbow colors and an orange arrow pointing downwards to indicate a decline or decrease in trend. the bars are arranged in a descending order with the tallest bar on the left and the shortest on the right. the background is plain white
Free with trial Business decline icon with downward arrow. Loss, failure, or economic crisis symbol vector. Decrease business graph vectors Business decline icon with downward arrow. Loss, failure, or economic crisis symbol
Free with trial Depreciation of savings line icon with color broken piggy bank, money and down arrow graph. Vector finance, business and economy crisis, money loss and bankruptcy isolated outline symbol. Decrease business graph vectors Depreciation of savings line icon of piggy bank. Depreciation of savings line icon with color broken piggy bank, money and down arrow graph. Vector finance, business and economy crisis, money loss and bankruptcy isolated outline symbol
Free with trial A hand holds a nearly empty brown leather wallet against a blurred background of a sharply falling red stock market graph. The image powerfully symbolizes financial loss, economic downturn, recession, and the impact of market volatility on personal finances. Ideal for illustrating articles, reports, or presentations on financial hardship, investment risks, and economic instability. Decrease business graph illustrations Empty Wallet and Falling Stock Market Graph. A hand holds a nearly empty brown leather wallet against a blurred background of a sharply falling red stock market graph. The image powerfully symbolizes financial loss, economic downturn, recession, and the impact of market volatility on personal finances. Ideal for illustrating articles, reports, or presentations on financial hardship, investment risks, and economic instability.
Free with trial A red stock market graph is displayed on a digital screen, indicating a market downturn. The graph shows a significant drop, against the backdrop of a blurry financial district, emphasizing a sense of crisis. Decrease business graph illustrations Red Stock Market Graph Displayed on a Digital Screen in a Financial District Setting. A red stock market graph is displayed on a digital screen, indicating a market downturn. The graph shows a significant drop, against the backdrop of a blurry financial district, emphasizing a sense of crisis
Free with trial Declining Bar Graph with Downward Trend Arrow Illustrating Economic Loss, Financial Issues, and Market Crash. Decrease business graph vectors Declining Bar Graph with Downward Trend Arrow Illustrating Economic Loss, Financial Issues, and Market Crash
Free with trial A simple flat icon vector illustration of two hands adjusting a simple chart with a downturn arrow, symbolizing risk mitigation in a business setting. The simple chart with a downturn arrow is orange with dark gray elements, indicating loss control. White background. Minimalist style with sharp edges and no shadows. Orange and Gray color palette. Vector graphics with rounded corners. High. Decrease business graph illustrations Hands Protect Financial Growth Chart Decline, Business Crisis Management. A simple flat icon vector illustration of two hands adjusting a simple chart with a downturn arrow, symbolizing risk mitigation in a business setting. The simple chart with a downturn arrow is orange with dark gray elements, indicating loss control. White background. Minimalist style with sharp edges and no shadows. Orange and Gray color palette. Vector graphics with rounded corners. High