Free with trial Graph or block diagram shows the increase or decrease of shares, which means financial loss or gain -. Decrease business graph illustrations Graph or block diagram shows the increase or decrease of shares, which means financial loss or gain
Free with trial A vibrant 3D bar chart icon isolated on a clean white background. This minimalist data visualization features five colorful bars in a soft, pastel palette of yellow, pink, and purple, arranged in descending order. The clean, modern render is perfect for illustrating concepts like business statistics, financial reports, market analysis, and performance metrics. An ideal graphic element for presentations, infographics, websites, and educational materials, symbolizing data, comparison, and analytics in a visually appealing way. 3D illustration. Decrease business graph illustrations 3D Colorful Bar Chart for Business and Data Analysis. A vibrant 3D bar chart icon isolated on a clean white background. This minimalist data visualization features five colorful bars in a soft, pastel palette of yellow, pink, and purple, arranged in descending order. The clean, modern render is perfect for illustrating concepts like business statistics, financial reports, market analysis, and performance metrics. An ideal graphic element for presentations, infographics, websites, and educational materials, symbolizing data, comparison, and analytics in a visually appealing way. 3D illustration.
Free with trial Conceptual financial illustration of a falling stock market index. Red line graph showing sharp decline, volatility, and economic crisis point with a target circle on a dark grid background. Decrease business graph illustrations Red stock market graph showing economic crash and financial crisis on dark background. Conceptual financial illustration of a falling stock market index. Red. Conceptual financial illustration of a falling stock market index. Red line graph showing sharp decline, volatility, and economic crisis point with a target circle on a dark grid background.
Free with trial Graph or block diagram shows the increase or decrease of shares, which means financial loss or gain -. Decrease business graph illustrations Graph or block diagram shows the increase or decrease of shares, which means financial loss or gain
Free with trial Graph or block diagram shows the increase or decrease of shares, which means financial loss or gain -. Decrease business graph illustrations Graph or block diagram shows the increase or decrease of shares, which means financial loss or gain
Free with trial Graph or block diagram shows the increase or decrease of shares, which means financial loss or gain -. Decrease business graph illustrations Graph or block diagram shows the increase or decrease of shares, which means financial loss or gain
Free with trial Graph or block diagram shows the increase or decrease of shares, which means financial loss or gain -. Decrease business graph illustrations Graph or block diagram shows the increase or decrease of shares, which means financial loss or gain
Free with trial Graph or block diagram shows the increase or decrease of shares, which means financial loss or gain -. Decrease business graph illustrations Graph or block diagram shows the increase or decrease of shares, which means financial loss or gain
Free with trial Graph or block diagram shows the increase or decrease of shares, which means financial loss or gain -. Decrease business graph illustrations Graph or block diagram shows the increase or decrease of shares, which means financial loss or gain
Free with trial Graph or block diagram shows the increase or decrease of shares, which means financial loss or gain -. Decrease business graph illustrations Graph or block diagram shows the increase or decrease of shares, which means financial loss or gain
Free with trial Graph or block diagram shows the increase or decrease of shares, which means financial loss or gain -. Decrease business graph illustrations Graph or block diagram shows the increase or decrease of shares, which means financial loss or gain
Free with trial Graph or block diagram shows the increase or decrease of shares, which means financial loss or gain -. Decrease business graph illustrations Graph or block diagram shows the increase or decrease of shares, which means financial loss or gain
Free with trial Graph or block diagram shows the increase or decrease of shares, which means financial loss or gain -. Decrease business graph illustrations Graph or block diagram shows the increase or decrease of shares, which means financial loss or gain
Free with trial Graph or block diagram shows the increase or decrease of shares, which means financial loss or gain -. Decrease business graph illustrations Graph or block diagram shows the increase or decrease of shares, which means financial loss or gain
Free with trial Graph or block diagram shows the increase or decrease of shares, which means financial loss or gain -. Decrease business graph illustrations Graph or block diagram shows the increase or decrease of shares, which means financial loss or gain
Free with trial Graph or block diagram shows the increase or decrease of shares, which means financial loss or gain -. Decrease business graph illustrations Graph or block diagram shows the increase or decrease of shares, which means financial loss or gain
Free with trial Graph or block diagram shows the increase or decrease of shares, which means financial loss or gain -. Decrease business graph illustrations Graph or block diagram shows the increase or decrease of shares, which means financial loss or gain
Free with trial Graph or block diagram shows the increase or decrease of shares, which means financial loss or gain -. Decrease business graph illustrations Graph or block diagram shows the increase or decrease of shares, which means financial loss or gain
Free with trial Graph or block diagram shows the increase or decrease of shares, which means financial loss or gain -. Decrease business graph illustrations Graph or block diagram shows the increase or decrease of shares, which means financial loss or gain
Free with trial Graph or block diagram shows the increase or decrease of shares, which means financial loss or gain -. Decrease business graph illustrations Graph or block diagram shows the increase or decrease of shares, which means financial loss or gain
Free with trial Graph or block diagram shows the increase or decrease of shares, which means financial loss or gain -. Decrease business graph illustrations Graph or block diagram shows the increase or decrease of shares, which means financial loss or gain
Free with trial Graph or block diagram shows the increase or decrease of shares, which means financial loss or gain -. Decrease business graph illustrations Graph or block diagram shows the increase or decrease of shares, which means financial loss or gain
Free with trial Graph or block diagram shows the increase or decrease of shares, which means financial loss or gain -. Decrease business graph illustrations Graph or block diagram shows the increase or decrease of shares, which means financial loss or gain
Free with trial Graph or block diagram shows the increase or decrease of shares, which means financial loss or gain -. Decrease business graph illustrations Graph or block diagram shows the increase or decrease of shares, which means financial loss or gain
Free with trial Graph or block diagram shows the increase or decrease of shares, which means financial loss or gain -. Decrease business graph illustrations Graph or block diagram shows the increase or decrease of shares, which means financial loss or gain
Free with trial Graph or block diagram shows the increase or decrease of shares, which means financial loss or gain -. Decrease business graph illustrations Graph or block diagram shows the increase or decrease of shares, which means financial loss or gain
Free with trial Graph or block diagram shows the increase or decrease of shares, which means financial loss or gain -. Decrease business graph illustrations Graph or block diagram shows the increase or decrease of shares, which means financial loss or gain
Free with trial Graph or block diagram shows the increase or decrease of shares, which means financial loss or gain -. Decrease business graph illustrations Graph or block diagram shows the increase or decrease of shares, which means financial loss or gain
Free with trial Graph or block diagram shows the increase or decrease of shares, which means financial loss or gain -. Decrease business graph illustrations Graph or block diagram shows the increase or decrease of shares, which means financial loss or gain
Free with trial Graph or block diagram shows the increase or decrease of shares, which means financial loss or gain -. Decrease business graph illustrations Graph or block diagram shows the increase or decrease of shares, which means financial loss or gain
Free with trial Graph or block diagram shows the increase or decrease of shares, which means financial loss or gain -. Decrease business graph illustrations Graph or block diagram shows the increase or decrease of shares, which means financial loss or gain
Free with trial Graph or block diagram shows the increase or decrease of shares, which means financial loss or gain -. Decrease business graph illustrations Graph or block diagram shows the increase or decrease of shares, which means financial loss or gain
Free with trial Graph or block diagram shows the increase or decrease of shares, which means financial loss or gain -. Decrease business graph illustrations Graph or block diagram shows the increase or decrease of shares, which means financial loss or gain
Free with trial Graph or block diagram shows the increase or decrease of shares, which means financial loss or gain -. Decrease business graph illustrations Graph or block diagram shows the increase or decrease of shares, which means financial loss or gain
Free with trial Graph or block diagram shows the increase or decrease of shares, which means financial loss or gain -. Decrease business graph illustrations Graph or block diagram shows the increase or decrease of shares, which means financial loss or gain
Free with trial Graph or block diagram shows the increase or decrease of shares, which means financial loss or gain -. Decrease business graph illustrations Graph or block diagram shows the increase or decrease of shares, which means financial loss or gain
Free with trial Graph or block diagram shows the increase or decrease of shares, which means financial loss or gain -. Decrease business graph illustrations Graph or block diagram shows the increase or decrease of shares, which means financial loss or gain
Free with trial Graph or block diagram shows the increase or decrease of shares, which means financial loss or gain -. Decrease business graph illustrations Graph or block diagram shows the increase or decrease of shares, which means financial loss or gain
Free with trial Graph or block diagram shows the increase or decrease of shares, which means financial loss or gain -. Decrease business graph illustrations Graph or block diagram shows the increase or decrease of shares, which means financial loss or gain
Free with trial Hand holding graph symbolizing increasing and decreasing value. Decrease business graph vectors Hand holding graph
Free with trial Stock market or forex trading candlestick graph in graphic design for financial investment concept. Motion. Financial data and diagrams showing increase and decrease in profits. Decrease business graph illustrations Stock market or forex trading candlestick graph in graphic design for financial investment concept. Motion. Financial
Free with trial A white and red isometric arrow moving downward on a dark red grid pattern. Business concept representing decrease, loss, negative profit, economic crash, and market decline with blurred background. Decrease business graph illustrations Isometric red arrow moving down on dark grid background with selective focus. A white and red isometric arrow moving downward on a dark red grid pattern. Business concept representing decrease, loss, negative profit, economic crash, and market decline with blurred background.
Free with trial Digital display featuring a red falling line graph and warning triangle icon in isometric perspective. Selective focus on financial crisis data, market crash, and global recession concept. Decrease business graph illustrations Red digital graph showing sharp decline with warning sign on dark background. Digital display featuring a red falling line graph and warning triangle icon in isometric perspective. Selective focus on financial crisis data, market crash, and global recession concept.
Free with trial Set Mind map infographic, Pie chart, Cloud download and upload and Financial growth decrease icon. Vector. Decrease business graph vectors Set Mind map infographic, Pie chart, Cloud download and upload and Financial growth decrease icon. Vector
Free with trial Red downward trend graph with white falling blocks and coins on a dark red background. Concept of financial loss. 3D Rendering. Decrease business graph illustrations Red downward trend graph with falling blocks and coins. 3D Rendering. Red downward trend graph with white falling blocks and coins on a dark red background. Concept of financial loss. 3D Rendering
Free with trial This image shows a red line graph with a downward trend on a blue background. Vector illustration design using ai tool. Decrease business graph vectors Financial crisis graph. This image shows a red line graph with a downward trend on a blue background. Vector illustration design using ai tool.
Free with trial Business Decline - Recession - Icon 10 File. Decrease business graph illustrations Business Decline - Recession - Icon
Free with trial Set Network cloud connection, Financial growth decrease, and Browser with exclamation mark icon. Vector. Decrease business graph vectors Set Network cloud connection, Financial growth decrease, and Browser with exclamation mark icon. Vector
Free with trial Businessman analyzing declining graph, worried about financial loss. Office setting with a plant and documents. Corporate challenges vector illustration. Decrease business graph vectors Businessman analyzing declining graph, worried about financial loss. Office setting with a plant and documents
Free with trial Graph chart going up and down sign arrows flat design vector illustration on white background. Decrease business graph vectors Graph chart going up and down sign arrows flat design vector illustration
Free with trial Set Fire in burning house, Debt ball chained to coin, Dollar rate decrease and Mobile stock trading icon. Vector. Decrease business graph vectors Set Fire in burning house, Debt ball chained to coin, Dollar rate decrease and Mobile stock trading icon. Vector
Free with trial This image shows a 3D bar graph, generated by AI, depicting a rise and subsequent fall in values. The red bars illustrate a peak, followed by a sharp decline, possibly representing a trend in data or market fluctuations. The visual is clean and easy to understand, highlighting the dramatic change i. Decrease business graph illustrations Red 3D Bar Graph. This image shows a 3D bar graph, generated by AI, depicting a rise and subsequent fall in values. The red bars illustrate a peak, followed by a sharp decline, possibly representing a trend in data or market fluctuations. The visual is clean and easy to understand, highlighting the dramatic change i
Free with trial A dynamic 3D illustration of a glossy red arrow pointing downwards in a jagged, volatile path. Isolated on a white background, this graphic icon is a powerful symbol for negative concepts. It represents decline, decrease, failure, loss, and crisis. This visual is perfect for illustrating stock market crashes, economic recession, financial downturns, poor business performance, or any downward trend in data and statistics. An ideal element for reports, presentations, and financial news, with ample copy space. Decrease business graph illustrations Red Jagged Arrow of Decline - Financial Crisis Concept. A dynamic 3D illustration of a glossy red arrow pointing downwards in a jagged, volatile path. Isolated on a white background, this graphic icon is a powerful symbol for negative concepts. It represents decline, decrease, failure, loss, and crisis. This visual is perfect for illustrating stock market crashes, economic recession, financial downturns, poor business performance, or any downward trend in data and statistics. An ideal element for reports, presentations, and financial news, with ample copy space.
Free with trial This colorful bar graph, generated by AI, depicts a downward trend using vibrant red, green, and yellow paint. The melting paint adds a dynamic, visually engaging element to the standard bar chart format, showcasing data decline creatively. Decrease business graph illustrations Melting Bar Graph. This colorful bar graph, generated by AI, depicts a downward trend using vibrant red, green, and yellow paint. The melting paint adds a dynamic, visually engaging element to the standard bar chart format, showcasing data decline creatively.
Free with trial This image shows a 3D model of a bar graph, where one bar is falling, symbolizing decline or failure. This striking visual representation was generated by AI, offering a unique perspective on downward trends and economic instability. The clean design makes it ideal for illustrating various concepts. Decrease business graph illustrations Falling Bar Graph. This image shows a 3D model of a bar graph, where one bar is falling, symbolizing decline or failure. This striking visual representation was generated by AI, offering a unique perspective on downward trends and economic instability. The clean design makes it ideal for illustrating various concepts
Free with trial Stacks of golden coins arranged in ascending order, representing financial growth and investment. The background features a blurred stock market graph, symbolizing market trends and investment opportunities. The image conveys concepts of wealth accumulation, financial planning, and economic prosperity. Suitable for illustrating articles, presentations, or advertisements related to finance, investment, and business. Decrease business graph illustrations Financial Growth and Investment
Free with trial Set Isometric Contract money and pen, Pie chart infographic, Mobile stock trading and Dollar rate decrease icon. Vector. Decrease business graph illustrations Set Isometric Contract money and pen, Pie chart infographic, Mobile stock trading and Dollar rate decrease icon. Vector
Free with trial Colorful Financial growth decrease icon isolated on white background. Increasing revenue. Minimalism concept. 3D render illustration. Decrease business graph illustrations Colorful Financial growth decrease icon isolated on white background. Increasing revenue. Minimalism concept. 3D render
Free with trial Set Mind map infographic Pie chart Server Folder and lock Sales funnel with Financial growth decrease Data analysis and icon. Vector. Decrease business graph vectors Set Mind map infographic, Pie chart, Server, Folder and lock, Sales funnel with, Financial growth decrease, Data. Set Mind map infographic Pie chart Server Folder and lock Sales funnel with Financial growth decrease Data analysis and icon. Vector.
Free with trial The image depicts a red graph indicating a decrease in oil prices, with oil pumps in the background. Decrease business graph illustrations Oil industry decline concept with pump jacks and a downward trend graph. The image depicts a red graph indicating a decrease in oil prices, with oil pumps in the background
Free with trial Financial difficulties, decrease in value of business or company shares, stock market crash, economic crisis, business failure and loss of cash, lose investments, a man falls off the chart. Decrease business graph vectors Man falls off the chart
Free with trial Businessman looking at a declining info graph. vector,illustration. Decrease business graph illustrations Businessman looking at a declining info graph
Free with trial Line Financial growth decrease icon isolated seamless pattern on black background. Increasing revenue. Vector. Decrease business graph vectors Line Financial growth decrease icon isolated seamless pattern on black background. Increasing revenue. Vector
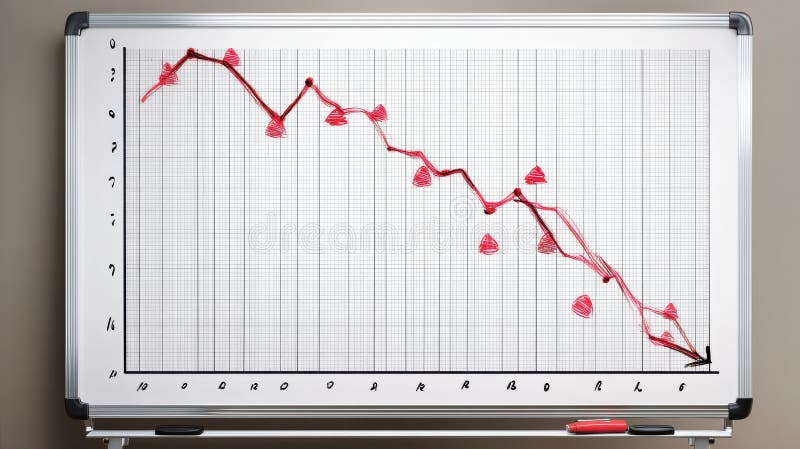
Free with trial A whiteboard displays a hand-drawn graph depicting a significant downward trend, marked by red triangles indicating decreasing values. This visual representation of a negative trend was generated by AI for illustrative purposes, possibly showcasing market decline or economic downturn. Decrease business graph illustrations Downward Trend Graph. A whiteboard displays a hand-drawn graph depicting a significant downward trend, marked by red triangles indicating decreasing values. This visual representation of a negative trend was generated by AI for illustrative purposes, possibly showcasing market decline or economic downturn.
Free with trial This AI-generated image depicts a bar graph where the bars are covered in a melting, metallic substance, suggesting a market downturn. The dripping metal symbolizes loss and decline, generated by AI for visual representation. Decrease business graph illustrations Melting Market Graph. This AI-generated image depicts a bar graph where the bars are covered in a melting, metallic substance, suggesting a market downturn. The dripping metal symbolizes loss and decline, generated by AI for visual representation.
Free with trial Cartoon stickman drawing conceptual illustration of businessman standing on top of a graph, Generative AI illustrations. Decrease business graph illustrations Cartoon stickman drawing conceptual illustration of businessman standing on top of a graph, Generative AI illustrations
Free with trial This image shows a rolled-up graph with a red line depicting a downturn, generated by AI. It visually represents a negative trend or decline in data, potentially illustrating economic recession, market loss, or other negative statistical trends. The clean design allows for easy visualization of the. Decrease business graph illustrations Declining Graph Report. This image shows a rolled-up graph with a red line depicting a downturn, generated by AI. It visually represents a negative trend or decline in data, potentially illustrating economic recession, market loss, or other negative statistical trends. The clean design allows for easy visualization of the
Free with trial Financial difficulties, decrease in value of business or company shares, stock market crash, economic crisis, business failure, loss of cash, lose investments, man points a magnifier to broken arrow. Decrease business graph vectors Man points to broken arrow. Financial difficulties, decrease in value of business or company shares, stock market crash, economic crisis, business failure, loss of cash, lose investments, man points a magnifier to broken arrow
Free with trial A minimalist black and white icon representing a financial growth chart. It features a series of vertical bars of varying heights, symbolizing data points or periods, overlaid with a line graph connecting circular nodes. This graphic effectively conveys concepts of financial analysis, business growth, performance tracking, and data visualization. Ideal for presentations, reports, websites, and applications related to finance, economics, and business intelligence. Decrease business graph vectors Growth Analysis Finance Chart Icon. A minimalist black and white icon representing a financial growth chart. It features a series of vertical bars of varying heights, symbolizing data points or periods, overlaid with a line graph connecting circular nodes. This graphic effectively conveys concepts of financial analysis, business growth, performance tracking, and data visualization. Ideal for presentations, reports, websites, and applications related to finance, economics, and business intelligence.
Free with trial Set line Delivery tracking, Financial growth decrease, Layers and Infographic element. White square button. Vector. Decrease business graph vectors Set line Delivery tracking, Financial growth decrease, Layers and Infographic element. White square button. Vector
Free with trial Grey Financial growth decrease icon isolated on beige background. Increasing revenue. Abstract circle random dots. Vector. Decrease business graph vectors Grey Financial growth decrease icon isolated on beige background. Increasing revenue. Abstract circle random dots
Free with trial This image shows a detailed close-up of a stock market graph depicting a significant decline. The red color emphasizes the negative trend, illustrating potential losses or economic downturn. This visualization was generated by AI for analysis and presentation purposes. Decrease business graph illustrations Red Market Decline Graph. This image shows a detailed close-up of a stock market graph depicting a significant decline. The red color emphasizes the negative trend, illustrating potential losses or economic downturn. This visualization was generated by AI for analysis and presentation purposes.
Free with trial Set Binary code Pie chart infographic Data analysis Coal mine trolley Financial growth decrease and Browser with stocks market icon. Vector. Decrease business graph illustrations Set Binary code, Pie chart infographic, Data analysis, Coal mine trolley, Financial growth decrease, and Browser with. Set Binary code Pie chart infographic Data analysis Coal mine trolley Financial growth decrease and Browser with stocks market icon. Vector.
Free with trial Red downward arrow graph isolated on transparent background. Decrease business graph illustrations Red downward arrow graph
Free with trial Set line Hierarchy organogram chart, Dollar symbol, Financial growth decrease and Arrow. White square button. Vector. Decrease business graph vectors Set line Hierarchy organogram chart, Dollar symbol, Financial growth decrease and Arrow. White square button. Vector
Free with trial Descending bar chart or graph on white background. Economic crisis, declining profit, recession and bankruptcy. 3d render. Decrease business graph illustrations Descending bar chart or graph on white background
Free with trial Model of house shot on graph depicting mortgage rates. image. Decrease business graph illustrations Model of house shot on graph depicting mortgage rates.
Free with trial Model of house shot on graph depicting mortgage rates. image. Decrease business graph illustrations Model of house shot on graph depicting mortgage rates.
Free with trial Flat design vector of a dollar coin and a falling bar chart. Perfect for finance, business, and loss themes. Isolated on white. Decrease business graph vectors Dollar Decrease Bar Chart Icon. Flat design vector of a dollar coin and a falling bar chart. Perfect for finance, business, and loss themes. Isolated on white
Free with trial Decreasing bar graph in ice cube. 3d illustration. Decrease business graph illustrations Decreasing bar graph in ice cube