Free with trial A visually striking image capturing a bar chart, line graph, and pie chart meticulously drawn in the wet sand on a beach. The artwork is illuminated by the warm, golden light of a sunset, with gentle waves lapping at the shore. This represents concepts of financial growth, market analysis, and business success in a unique, natural setting. The image evokes themes of planning, progress, and the cyclical nature of markets. Decrease business graph illustrations Financial Growth Chart and Pie Chart Drawn in Sand at Sunset. A visually striking image capturing a bar chart, line graph, and pie chart meticulously drawn in the wet sand on a beach. The artwork is illuminated by the warm, golden light of a sunset, with gentle waves lapping at the shore. This represents concepts of financial growth, market analysis, and business success in a unique, natural setting. The image evokes themes of planning, progress, and the cyclical nature of markets.
Free with trial Model of house shot on graph depicting mortgage rates. image. Decrease business graph illustrations Model of house shot on graph depicting mortgage rates.
Free with trial Model of house shot on graph depicting mortgage rates. image. Decrease business graph illustrations Model of house shot on graph depicting mortgage rates.
Free with trial Loss of money, profit from investments and deposits, decrease in business value, financial or economic collapse, defeat or failure in the foreign exchange market, man falls from a broken dollar. Decrease business graph vectors Man falls from a broken dollar
Free with trial Financial difficulties, decrease in value of business or company shares, stock market crash, economic crisis, business failure and loss of cash, lose investments, a man falls off the broken arrow. Decrease business graph vectors Man falls off the broken arrow
Free with trial A hand holds a piece of paper showing a sharply declining graph, representing a downturn in the market. The image is generated by AI and symbolizes financial loss or economic recession. Decrease business graph illustrations Falling Stock Market Graph. A hand holds a piece of paper showing a sharply declining graph, representing a downturn in the market. The image is generated by AI and symbolizes financial loss or economic recession.
Free with trial Graph Down glyph vector icon isolated. Graph Down stock vector icon for web, mobile app and ui design. Decrease business graph vectors Graph Down glyph vector icon
Free with trial Set line Server Website with stocks market Infographic of city map Laptop browser window Financial growth decrease Browser shield Photo retouching and Secure your HTTPS SSL icon. Vector. Decrease business graph illustrations Set line Server, Website with stocks market, Infographic of city map, Laptop browser window, Financial growth decrease. Set line Server Website with stocks market Infographic of city map Laptop browser window Financial growth decrease Browser shield Photo retouching and Secure your HTTPS SSL icon. Vector.
Free with trial Cut or decrease cost to increase profitability by minimizing expenses, eps10. Decrease business graph vectors Cut or decrease cost to increase profitability by minimizing expenses
Free with trial Bear representing the bear market, standing in front of a downtrend stock market graph. Decrease business graph illustrations Bear standing in front of downtrend stock market graph, bear market. Bear representing the bear market, standing in front of a downtrend stock market graph
Free with trial Stock crisis red price drop arrow down chart fall. Stock market exchange analysis or forex graph business and finance money losing moving economic inflation deflation investment loss crash. Illustration. Decrease business graph illustrations Stock crisis red price drop arrow down chart fall
Free with trial Stock crisis red price drop arrow down chart fall. Stock market exchange analysis or forex graph business and finance money losing moving economic inflation deflation investment loss crash. Illustration. Decrease business graph illustrations Stock crisis red price drop arrow down chart fall
Free with trial Stock crisis red price drop arrow down chart fall. Stock market exchange analysis or forex graph business and finance money losing moving economic inflation deflation investment loss crash. Illustration. Decrease business graph illustrations Stock crisis red price drop arrow down chart fall
Free with trial Stock crisis red price drop arrow down chart fall. Stock market exchange analysis or forex graph business and finance money losing moving economic inflation deflation investment loss crash. Illustration. Decrease business graph illustrations Stock crisis red price drop arrow down chart fall
Free with trial A 3D icon featuring a red downward arrow, commonly representing a decline, decrease, or negative trend in financial and business metrics. Decrease business graph vectors 3D Red Downward Trend Arrow Icon. A 3D icon featuring a red downward arrow, commonly representing a decline, decrease, or negative trend in financial and business metrics
Free with trial A 3D rendered image of a large, glossy red arrow curving downwards on a clean, white background. The arrow's smooth, rounded shape and vibrant color create a sense of direction and emphasis. The image is suitable for illustrating concepts such as decline, decrease, failure, or downward trends in various contexts like finance, business, or statistics. Decrease business graph illustrations Red Arrow Pointing Downward. A 3D rendered image of a large, glossy red arrow curving downwards on a clean, white background. The arrow's smooth, rounded shape and vibrant color create a sense of direction and emphasis. The image is suitable for illustrating concepts such as decline, decrease, failure, or downward trends in various contexts like finance, business, or statistics.
Free with trial Colorful Financial growth decrease icon isolated on white background. Increasing revenue. Circle button. 3D render illustration. Decrease business graph illustrations Colorful Financial growth decrease icon isolated on white background. Increasing revenue. Circle button. 3D render
Free with trial Colorful Financial growth decrease icon isolated on white background. Increasing revenue. Circle button. 3D render illustration. Decrease business graph illustrations Colorful Financial growth decrease icon isolated on white background. Increasing revenue. Circle button. 3D render
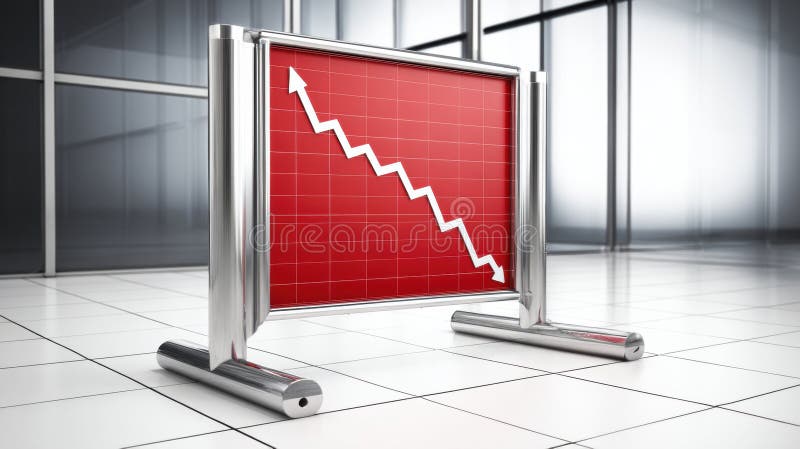
Free with trial This image shows a red graph displaying a downward trend, generated by AI. The graph is presented on a freestanding, metallic sign, suggesting a public display of economic or market data indicating a decline or downturn. The clean, modern setting adds to the professional feel, implying a serious fi. Decrease business graph illustrations AI-Generated Declining Graph. This image shows a red graph displaying a downward trend, generated by AI. The graph is presented on a freestanding, metallic sign, suggesting a public display of economic or market data indicating a decline or downturn. The clean, modern setting adds to the professional feel, implying a serious fi
Free with trial This minus sign icon represents decrease and subtraction. Decrease business graph vectors Minus Sign Icon for Decrease. This minus sign icon represents decrease and subtraction.
Free with trial Glowing neon line Financial growth decrease icon isolated on black background. Increasing revenue. Vector. Decrease business graph vectors Glowing neon line Financial growth decrease icon isolated on black background. Increasing revenue. Vector
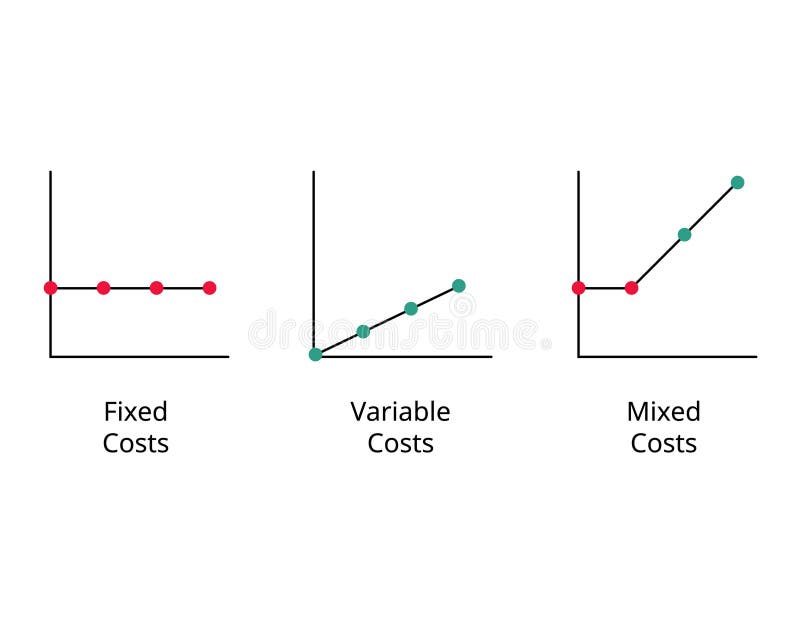
Free with trial Graph of Fixed cost, variable costs, mixed cost to compare vector. Decrease business graph vectors Graph of Fixed cost, variable costs, mixed cost to compare
Free with trial A 3D illustration of a stack of silver dollar coins with an decrease and increase arrow graph, symbolizing financial growth and success, isolated, png, transparent, clipart, transparent background, cutout, cut-out. Decrease business graph vectors A 3D illustration of a stack of golden coins. A 3D illustration of a stack of silver dollar coins with an decrease and increase arrow graph, symbolizing financial growth and success, isolated, png, transparent, clipart, transparent background, cutout, cut-out
Free with trial A 3D illustration of a stack of golden dollar coins with an decrease and increase arrow graph, symbolizing financial growth and success, isolated, png, transparent, clipart, transparent background, cutout, cut-out. Decrease business graph vectors A 3D illustration of a stack of golden coins. A 3D illustration of a stack of golden dollar coins with an decrease and increase arrow graph, symbolizing financial growth and success, isolated, png, transparent, clipart, transparent background, cutout, cut-out
Free with trial This image shows a 3D rendering of a red line graph sharply declining, resting on a white cube. The graphic is generated by AI, and visually represents a negative trend or downturn, suitable for presentations or reports on market analysis, economic forecasts, or business performance. Decrease business graph illustrations Declining Trend Visualization. This image shows a 3D rendering of a red line graph sharply declining, resting on a white cube. The graphic is generated by AI, and visually represents a negative trend or downturn, suitable for presentations or reports on market analysis, economic forecasts, or business performance.
Free with trial Hold positions during downturn in market activity, look into future to plan further actions, search for strategy for company operation during economic instability, man with umbrella on arrows on graph. Decrease business graph vectors Man with umbrella on arrows on graph
Free with trial This illustration, generated by AI, depicts a man looking worried at a downward trending graph on his laptop. The image symbolizes economic downturn, market decline, or financial stress. It's a perfect visual for articles or presentations about financial anxieties. Decrease business graph illustrations AI-Generated Worried Man & Graph. This illustration, generated by AI, depicts a man looking worried at a downward trending graph on his laptop. The image symbolizes economic downturn, market decline, or financial stress. It's a perfect visual for articles or presentations about financial anxieties.
Free with trial Hold positions during downturn in market activity, look into future to plan further actions, search for strategy for company's operation during economic instability, man with umbrella on falling graph. Decrease business graph vectors Man with umbrella on falling graph
Free with trial A hand holds a piece of paper with a simple line graph, possibly representing data or a trend, generated by AI. The minimalist design emphasizes the visual simplicity and the concept of data representation. The image could be used to illustrate various concepts related to progress, decline, or chan. Decrease business graph illustrations Hand Holding Simple Line Graph. A hand holds a piece of paper with a simple line graph, possibly representing data or a trend, generated by AI. The minimalist design emphasizes the visual simplicity and the concept of data representation. The image could be used to illustrate various concepts related to progress, decline, or chan
Free with trial Colorful Financial growth decrease icon isolated on white background. Increasing revenue. Minimalism concept. 3D render illustration. Decrease business graph illustrations Colorful Financial growth decrease icon isolated on white background. Increasing revenue. Minimalism concept. 3D render
Free with trial Colorful Financial growth decrease icon isolated on white background. Increasing revenue. Minimalism concept. 3D render illustration. Decrease business graph illustrations Colorful Financial growth decrease icon isolated on white background. Increasing revenue. Minimalism concept. 3D render
Free with trial Loss money arrow bar graph icon on white background depicting financial decline. Decrease business graph illustrations Loss money arrow bar graph icon
Free with trial This image shows a simple isometric bar graph, generated by AI. It features four black bars of varying heights against a white background, suitable for use as a minimalist graphic or logo. The clean design allows for versatile application in various contexts. Decrease business graph illustrations AI-Generated Isometric Bar Graph. This image shows a simple isometric bar graph, generated by AI. It features four black bars of varying heights against a white background, suitable for use as a minimalist graphic or logo. The clean design allows for versatile application in various contexts.
Free with trial A businessman in a suit interacts with a digital interface illustrating the relationship between quality and cost. The image features a visual representation of increasing quality and decreasing cost, with checkmarks indicating positive outcomes. This concept is ideal for illustrating business strategies, efficiency, and financial planning. The scene includes a clipboard with charts, adding a professional context. Decrease business graph illustrations Quality vs. Cost: Business Concept. A businessman in a suit interacts with a digital interface illustrating the relationship between quality and cost. The image features a visual representation of increasing quality and decreasing cost, with checkmarks indicating positive outcomes. This concept is ideal for illustrating business strategies, efficiency, and financial planning. The scene includes a clipboard with charts, adding a professional context.
Free with trial A close-up shot of wooden blocks arranged to form a small graph, illustrating an interest rate. The blocks are textured and have percentage symbols and directional arrows carved into them. The image has a dark, moody feel and evokes concepts of finance, economics, and growth or decline. Decrease business graph illustrations Wooden blocks interest rate graph. A close-up shot of wooden blocks arranged to form a small graph, illustrating an interest rate. The blocks are textured and have percentage symbols and directional arrows carved into them. The image has a dark, moody feel and evokes concepts of finance, economics, and growth or decline
Free with trial USD dollar value decline and devaluation. Bar graph made of holes in yellow paper is revealing us dollar banknotes of decreasing values. 3d render. Decrease business graph illustrations Us dollar decreasing value concept with bar graph on yellow background. USD dollar value decline and devaluation. Bar graph made of holes in yellow paper is revealing us dollar banknotes of decreasing values. 3d render
Free with trial Opportunity cost between product 1 and product 2 in different quantity graph vector. Decrease business graph vectors Opportunity cost between product 1 and product 2 in different quantity graph
Free with trial The stock market crash is depicted with a red graph, symbolizing financial loss and economic decline. The crisis represents a significant downturn in investment. Decrease business graph illustrations Stock market crash with red graph. The stock market crash is depicted with a red graph, symbolizing financial loss and economic decline. The crisis represents a. The stock market crash is depicted with a red graph, symbolizing financial loss and economic decline. The crisis represents a significant downturn in investment.
Free with trial This image showcases a downward trending graph, generated by AI, represented by a red arrow descending within a transparent glass structure. The visual effectively communicates decline or negative growth. The clean, minimalist design enhances the impact of the falling trend. Decrease business graph illustrations Decreasing Trend: AI-Generated Graph. This image showcases a downward trending graph, generated by AI, represented by a red arrow descending within a transparent glass structure. The visual effectively communicates decline or negative growth. The clean, minimalist design enhances the impact of the falling trend.
Free with trial A hand holding a piece of paper with a graph on it. The graph shows a downward trend, which could indicate a decrease in sales or a decline in a particular metric. Decrease business graph illustrations A hand holding a piece of paper with a graph on it
Free with trial This image depicts a dramatic market decline, visualized as a 3D graph showing a sharp downward trend. The red color emphasizes the severity of the losses, and the detailed chart is generated by AI, offering a realistic representation of financial instability. It can be used to illustrate economic. Decrease business graph illustrations Red Market Crash Graph. This image depicts a dramatic market decline, visualized as a 3D graph showing a sharp downward trend. The red color emphasizes the severity of the losses, and the detailed chart is generated by AI, offering a realistic representation of financial instability. It can be used to illustrate economic
Free with trial Decreasing bar graph behind magnifying glass. 3d render. Decrease business graph illustrations Decreasing bar graph behind magnifying glass
Free with trial Line graph is representing market trend with data points. Decrease business graph vectors Line graph showing market trend with data points. Line graph is representing market trend with data points
Free with trial Graphic illustration of a downward trending red arrow over blue and red vertical bar graph on a light grey background. Image. Decrease business graph illustrations Bar Graph with Decreasing Trend Line. Graphic illustration of a downward trending red arrow over blue and red vertical bar graph on a light grey background. Image
Free with trial Flat icons related to financial transactions pertaining to business or personal both. Very well crafted business and finance icons set to be used in related projects. Grab this pack and enjoy designing. Decrease business graph illustrations Set of Business and Finance Flat Icons. Flat icons related to financial transactions pertaining to business or personal both. Very well crafted business and finance icons set to be used in related projects. Grab this pack and enjoy designing
Free with trial A graph with a red arrow pointing upward. The graph is orange and blue. The graph is a representation of a trend or growth. Decrease business graph vectors A graph with a red arrow pointing upward
Free with trial A bitcoin coin in front of a red downward trending graph representing the volatile crypto market. Suitable for finance, investment, and technology themes. Image is generated using AI. Decrease business graph illustrations Bitcoin Coin Against a Downward Graph. A bitcoin coin in front of a red downward trending graph representing the volatile crypto market. Suitable for finance, investment, and technology themes. Image is generated using AI
Free with trial Economic crisis line icon of investment decline with arrow down, vector outline symbol. Global economy downturn and bankruptcy or world crisis in banking business and stock exchange decrease. Decrease business graph vectors Economic crisis line icon of investment decline
Free with trial Graph and arrow red stock marketing fall background. economy finance crisis low investment. Decrease business graph vectors Graph and arrow red stock marketing fall background. economy finance
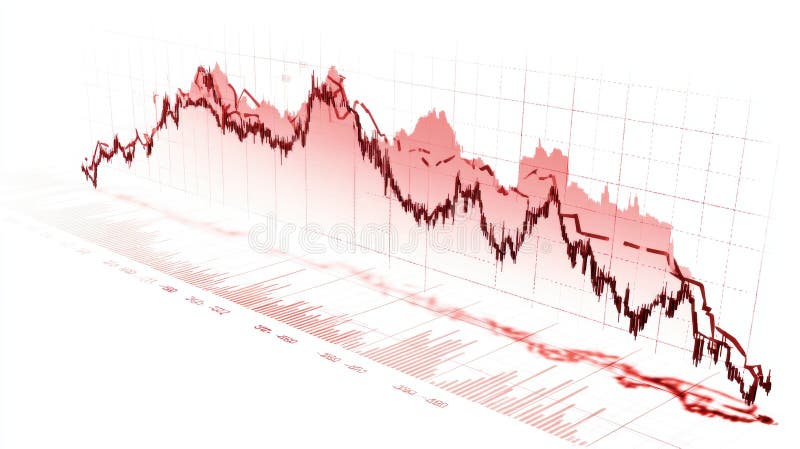
Free with trial Area chart graph is going down showing market volatility. Decrease business graph vectors Red area chart graph showing market volatility going down. Area chart graph is going down showing market volatility
Free with trial This simple icon depicts a line graph with one line trending upwards and one trending downwards. Decrease business graph vectors Line graph showing upward and downward trends icon. This simple icon depicts a line graph with one line trending upwards and one trending downwards
Free with trial Stack of money bills falling like dominoes with red arrow graph going down, concept of financial crisis. Decrease business graph vectors Red arrow graph is going down through stack of money bills. Stack of money bills falling like dominoes with red arrow graph going down, concept of financial crisis
Free with trial People discussing progress report. Colleagues analysing charts and graphs with statistical data. Employees during presentation of business results. Teamwork with financial statistics, office meeting. Decrease business graph vectors Teamwork with financial statistics, office meeting. Employees during business presentation. People discussing progress report. Colleagues analysing charts and graphs with statistical data. Employees during presentation of business results. Teamwork with financial statistics, office meeting
Free with trial Model of house shot on graph depicting mortgage rates. image. Decrease business graph illustrations Model of house shot on graph depicting mortgage rates.
Free with trial Model of house shot on graph depicting mortgage rates. image. Decrease business graph illustrations Model of house shot on graph depicting mortgage rates.
Free with trial Model of house shot on graph depicting mortgage rates. image. Decrease business graph illustrations Model of house shot on graph depicting mortgage rates.
Free with trial Model of house shot on graph depicting mortgage rates. image. Decrease business graph illustrations Model of house shot on graph depicting mortgage rates.
Free with trial Model of house shot on graph depicting mortgage rates. image. Decrease business graph illustrations Model of house shot on graph depicting mortgage rates.
Free with trial Model of house shot on graph depicting mortgage rates. image. Decrease business graph illustrations Model of house shot on graph depicting mortgage rates.
Free with trial Model of house shot on graph depicting mortgage rates. image. Decrease business graph illustrations Model of house shot on graph depicting mortgage rates.
Free with trial Model of house shot on graph depicting mortgage rates. image. Decrease business graph illustrations Model of house shot on graph depicting mortgage rates.
Free with trial Model of house shot on graph depicting mortgage rates. image. Decrease business graph illustrations Model of house shot on graph depicting mortgage rates.
Free with trial Model of house shot on graph depicting mortgage rates. image. Decrease business graph illustrations Model of house shot on graph depicting mortgage rates.
Free with trial Model of house shot on graph depicting mortgage rates. image. Decrease business graph illustrations Model of house shot on graph depicting mortgage rates.
Free with trial Model of house shot on graph depicting mortgage rates. image. Decrease business graph illustrations Model of house shot on graph depicting mortgage rates.
Free with trial Model of house shot on graph depicting mortgage rates. image. Decrease business graph illustrations Model of house shot on graph depicting mortgage rates.
Free with trial Model of house shot on graph depicting mortgage rates. image. Decrease business graph illustrations Model of house shot on graph depicting mortgage rates.
Free with trial Model of house shot on graph depicting mortgage rates. image. Decrease business graph illustrations Model of house shot on graph depicting mortgage rates.
Free with trial Model of house shot on graph depicting mortgage rates. image. Decrease business graph illustrations Model of house shot on graph depicting mortgage rates.
Free with trial Model of house shot on graph depicting mortgage rates. image. Decrease business graph illustrations Model of house shot on graph depicting mortgage rates.
Free with trial Model of house shot on graph depicting mortgage rates. image. Decrease business graph illustrations Model of house shot on graph depicting mortgage rates.
Free with trial Model of house shot on graph depicting mortgage rates. image. Decrease business graph illustrations Model of house shot on graph depicting mortgage rates.
Free with trial Model of house shot on graph depicting mortgage rates. image. Decrease business graph illustrations Model of house shot on graph depicting mortgage rates.
Free with trial Model of house shot on graph depicting mortgage rates. image. Decrease business graph illustrations Model of house shot on graph depicting mortgage rates.
Free with trial Model of house shot on graph depicting mortgage rates. image. Decrease business graph illustrations Model of house shot on graph depicting mortgage rates.
Free with trial Model of house shot on graph depicting mortgage rates. image. Decrease business graph illustrations Model of house shot on graph depicting mortgage rates.
Free with trial Model of house shot on graph depicting mortgage rates. image. Decrease business graph illustrations Model of house shot on graph depicting mortgage rates.
Free with trial Model of house shot on graph depicting mortgage rates. image. Decrease business graph illustrations Model of house shot on graph depicting mortgage rates.
Free with trial Model of house shot on graph depicting mortgage rates. image. Decrease business graph illustrations Model of house shot on graph depicting mortgage rates.
Free with trial Model of house shot on graph depicting mortgage rates. image. Decrease business graph illustrations Model of house shot on graph depicting mortgage rates.