Free with trial Decreasing graph icon set. Arrow going down sign symbol vector illustration. Market crash concept. Decrease business graph vectors Decreasing graph icon set. Arrow going down sign symbol vector. Market crash concept
Free with trial Declining bar graph on a trolley, showing a downward arrow, stock market trend, loss illustration. Decrease business graph vectors Declining bar graph on a trolley, showing a downward arrow, stock market trend, loss illustration
Free with trial Up and down trend chart icon in black circle. Business growth and decline symbol illustration. Decrease business graph vectors Up and down trend chart icon in black circle. Business growth and decline symbol
Free with trial Happy and sad businessman from rising and falling chart. Business success and failure infographic. Man sitting at computer table. Office manager. Startup project growth. Stock exchange. Vector concept. Decrease business graph vectors Happy and sad businessman from rising and falling chart. Business success and failure infographic. Man sitting at computer table
Free with trial Set line Financial growth decrease, increase, Diamond and Wallet with money icon. Vector. Decrease business graph illustrations Set line Financial growth decrease, increase, Diamond and Wallet with money icon. Vector
Free with trial Illustration shows a sad woman with a downward trending graph behind her representing loss or decline, conveying a somber and reflective mood. Generative AI. Decrease business graph vectors Sad woman standing in front of declining graph showing economic or personal loss vector illustration. Illustration shows a sad woman with a downward trending graph behind her representing loss or decline, conveying a somber and reflective mood. Generative AI
Free with trial Dollar arrow up and down icon. USD currency increase and decrease sign symbol vector. Decrease business graph vectors Dollar arrow up and down icon. USD currency increase and decrease sign symbol
Free with trial Financial chart arrow up and down icon illustration. Growth and decline graph symbol on black circle. Decrease business graph vectors Financial chart arrow up and down icon. Growth and decline graph symbol on black circle
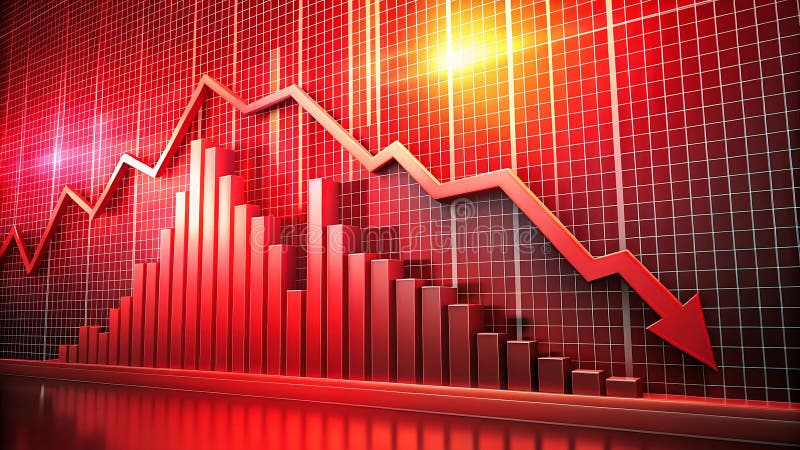
Free with trial Red bar graph showing a negative trend with a downward arrow against a red wall. Artistic render. Generative AI. Decrease business graph illustrations Red bar graph showing a negative trend with a downward arrow against a red wall. Generative AI. Red bar graph showing a negative trend with a downward arrow against a red wall. Artistic render. Generative AI
Free with trial Overlay stock market trading graph. overlay of a stock exchange screen with a strong uptrend, concept for successful investment strategy and economic growth. Decrease business graph illustrations Overlay stock market trading graph. colorful Japanese candlestick chart showing a bullish market breakout, financial trading graph. overlay stock market trading graph. overlay of a stock exchange screen with a strong uptrend, concept for successful investment strategy and economic growth
Free with trial Set line Dollar rate decrease, , Global economic crisis news and Burning dollar bill icon. Vector. Decrease business graph vectors Set line Dollar rate decrease, , Global economic crisis news and Burning dollar bill icon. Vector
Free with trial Dollar up and down icon vector. USD currency arrow increase and decrease sign symbol. Decrease business graph vectors Dollar up and down icon. USD currency arrow increase and decrease sign symbol
Free with trial Set line Financial growth decrease, Arrow, Pie chart infographic and Factory icon. Vector. Decrease business graph illustrations Set line Financial growth decrease, Arrow, Pie chart infographic and Factory icon. Vector
Free with trial Bankruptcy concept in flat design business. design vector illustration. Decrease business graph vectors Business bankruptcy concept in flat vector design. bankruptcy concept in flat design business.design vector illustration
Free with trial A 3D illustration depicting financial growth. A line graph with blue and red data points ascends across a light blue background. Interspersed are green and red candlestick bars, representing market fluctuations. Stacks of gold coins and individual coins with dollar signs are arranged at the base of the chart, symbolizing wealth and investment. Decrease business graph illustrations 3D Financial Growth Chart with Stacks of Gold Coins and Candlestick Bars finance graph. A 3D illustration depicting financial growth. A line graph with blue and red data points ascends across a light blue background. Interspersed are green and red candlestick bars, representing market fluctuations. Stacks of gold coins and individual coins with dollar signs are arranged at the base of the chart, symbolizing wealth and investment
Free with trial Red stock market investment decline chart. Downward arrow. Negative growth concept, business development, declining profits. Analytical financial chart. Trend. Changes in exchange rates, interest rates. Decrease business graph vectors Red stock market investment decline chart. Downward arrow. Negative growth concept, business development, declining profits.
Free with trial A red arrow crashes through a stock market graph displayed on a tablet screen. the scene is set against a dark blue background, symbolizing financial crisis and economic downturn. it represents loss and risk. Decrease business graph illustrations Red arrow crashing through stock market graph on tablet screen in a dark blue background. a red arrow crashes through a stock market graph displayed on a tablet screen. the scene is set against a dark blue background, symbolizing financial crisis and economic downturn. it represents loss and risk.
Free with trial Toy figurines arranged on colorful blocks to create a bar graph, representing population growth, demographic trends, and social statistics. Decrease business graph illustrations Toy figurines standing on colorful blocks forming a bar graph, symbolizing population growth, demographic trends, and social. Toy figurines arranged on colorful blocks to create a bar graph, representing population growth, demographic trends, and social statistics
Free with trial Hand interacting with a red downward trend line against a blue bar graph background image. Generative AI. Decrease business graph illustrations Hand interacting with a red downward trend line against a blue bar graph background image
Free with trial Set line Financial growth decrease, Casino signboard, increase and Dart arrow icon. Vector. Decrease business graph vectors Set line Financial growth decrease, Casino signboard, increase and Dart arrow icon. Vector
Free with trial Generative ai, The image is of a red bar graph and a red line graph. The line graph is going down, and the bar graph is going down. The image is set against a red background. The image is most likely representing a financial decline. It is a striki. Decrease business graph illustrations A red bar graph and line graph displays a downward trend, with the bar graph decreasing in height and the line graph going down. generative ai, The image is of a red bar graph and a red line graph. The line graph is going down, and the bar graph is going down. The image is set against a red background. The image is most likely representing a financial decline. It is a striki
Free with trial Stock market losses. The concept of the global economic crisis is illustrated with a graph of declining financial values. Descending trading graph. Decrease business graph vectors Stock market losses. The concept of the global economic crisis is illustrated with a graph of declining financial values.
Free with trial A 3D illustration of a blue line graph on a light blue background. The graph features a wavy blue line connecting several data points represented by small pink and green spheres. The overall shape suggests fluctuating data or trends, with some points indicating upward movement. Decrease business graph illustrations 3D Blue Line Graph with Pink and Green Data Points on Light Blue Background chart statistics. A 3D illustration of a blue line graph on a light blue background. The graph features a wavy blue line connecting several data points represented by small pink and green spheres. The overall shape suggests fluctuating data or trends, with some points indicating upward movement
Free with trial A minimalist 3D render displays three rounded rectangular bars representing a bar graph. The tallest bar is a soft blue, followed by a medium green bar, and the shortest is a light pink bar. They are arranged in descending order of height and stand on a plain white background, suggesting data visualization or progress. Decrease business graph illustrations Three colorful 3D bar graph elements in blue green and pink on a white background chart. A minimalist 3D render displays three rounded rectangular bars representing a bar graph. The tallest bar is a soft blue, followed by a medium green bar, and the shortest is a light pink bar. They are arranged in descending order of height and stand on a plain white background, suggesting data visualization or progress
Free with trial Declining chart icon. Downward trend symbol. Falling graph illustration. Simple vector design. EPS 10. Decrease business graph vectors Declining chart icon. Downward trend symbol. Falling graph illustration. Simple vector design.
Free with trial Growth decline graphs, market trends. Business performance symbols. Vector illustration. EPS 10. Stock image. Decrease business graph vectors Growth decline graphs, market trends. Business performance symbols. Vector illustration. EPS 10.
Free with trial Steeply falling graph arrow pointing down dark background plummeting downward trend risk Ideal for websites and social media. Decrease business graph illustrations Steeply falling graph, arrow pointing down, dark background, plummeting, downward trend, risk. Steeply falling graph arrow pointing down dark background plummeting downward trend risk Ideal for websites and social media
Free with trial A 3d rendering of a green bar graph with a red arrow pointing downwards and gold dollar coins. Decrease business graph illustrations 3d rendering of a green bar graph with a downward trending red arrow and gold dollar coins. A 3d rendering of a green bar graph with a red arrow pointing downwards and gold dollar coins
Free with trial Business decline and financial crisis illustrated on a chalkboard, showing a downward trend. Hand drawing orange arrow over white bar chart on blue background with ample copy space. Ideal for economic reports, financial news, marketing, or presentations needing a negative trend. Decrease business graph illustrations Business Decline Financial Chart Hand Drawing Chalkboard Recession Background Copy Space. Business decline and financial crisis illustrated on a chalkboard, showing a downward trend. Hand drawing orange arrow over white bar chart on blue background with ample copy space. Ideal for economic reports, financial news, marketing, or presentations needing a negative trend.
Free with trial A stark visual representation of a downward trend in business metrics and market conditions. Decrease business graph illustrations Red arrow graph illustrates sharp decline in financial performance and economic downturn. A stark visual representation of a downward trend in business metrics and market conditions
Free with trial Loss chart outline icon in white and black colors. loss chart flat vector icon from business collection for web, mobile apps and ui. Decrease business graph vectors Loss chart outline icon in white and black colors. loss chart flat vector icon from business collection for web, mobile apps and
Free with trial Abstract Black White Up Down Arrows Growth Chart Business Infographic Design. Generative AI. Decrease business graph illustrations Abstract Black White Up Down Arrows Growth Chart Business Infographic Design
Free with trial Declining bar chart with arrow pointing down depicts business loss, failure, negative trends. Decrease business graph vectors Declining bar chart with arrow pointing down depicts business loss, failure, negative trends
Free with trial Falling red arrow illustrating financial downturn on dark grid drop business decline fall Suitable for digital platforms. Decrease business graph illustrations Falling red arrow illustrating financial downturn on dark grid , drop, business decline, fall. Falling red arrow illustrating financial downturn on dark grid drop business decline fall Suitable for digital platforms
Free with trial Red textured arrows depict market fluctuations and business trends against a textured background symbolizes economic ups and downs, financial analysis, and investment opportunities with market statistics. Decrease business graph illustrations Red arrows symbolizing fluctuations representing business trends on a textured background. red textured arrows depict market fluctuations and business trends against a textured background symbolizes economic ups and downs, financial analysis, and investment opportunities with market statistics
Free with trial AI-powered trend prediction graph showing CSRpoepiojican metrics over time. Data visualization of future trends. Decrease business graph illustrations AI Trend Prediction Graph Visualization: Data Analysis of CSRpoepiojican Metrics Over Time. AI-powered trend prediction graph showing CSRpoepiojican metrics over time. Data visualization of future trends
Free with trial Green cube with an upward arrow, symbolizing business progress, finance and investment growth. Close-up. Decrease business graph illustrations Green cube with an upward arrow, symbolizing business progress, finance and investment growth
Free with trial The Red arrow Down on Business background 3d rendering. Decrease business graph illustrations The Red arrow Down on Business background 3d rendering
Free with trial The Red arrow Down on Business background 3d rendering. Decrease business graph illustrations The Red arrow Down on Business background 3d rendering
Free with trial The Red arrow Down on Business background 3d rendering. Decrease business graph illustrations The Red arrow Down on Business background 3d rendering
Free with trial Crystal magic ball and businessman hands with graph up or down inside. Oracle sphere. Investment forecast. Stock exchange volatility. Economy prediction. Financial growth prognosis. Vector concept. Decrease business graph vectors Crystal magic ball and businessman hands with graph up or down inside. Investment forecast. Stock exchange volatility. Economy. Crystal magic ball and businessman hands with graph up or down inside. Oracle sphere. Investment forecast. Stock exchange volatility. Economy prediction. Financial growth prognosis. Vector concept
Free with trial The Red arrow Down on Business background 3d rendering. Decrease business graph illustrations The Red arrow Down on Business background 3d rendering
Free with trial The Red arrow Down on Business background 3d rendering. Decrease business graph illustrations The Red arrow Down on Business background 3d rendering
Free with trial The Red arrow Down on Business background 3d rendering. Decrease business graph illustrations The Red arrow Down on Business background 3d rendering
Free with trial The Red arrow Down on Business background 3d rendering. Decrease business graph illustrations The Red arrow Down on Business background 3d rendering
Free with trial The Red arrow Down on Business background 3d rendering. Decrease business graph illustrations The Red arrow Down on Business background 3d rendering
Free with trial Declining bar graph with a downward arrow symbolizing economic recession and financial loss. Decrease business graph vectors Declining bar graph with a downward arrow symbolizing economic recession and financial loss
Free with trial Financial Capability Month Financial chart with 3d bar graph and line plot illustrating market trends. Decrease business graph illustrations Financial Capability Month Financial chart with 3d bar graph and line plot illustrating market trends
Free with trial Chart decline icon. Business symbol. Vector trend design. Black background shape. EPS 10. Decrease business graph vectors Chart decline icon. Business symbol. Vector trend design. Black background shape.
Free with trial Trend chart icon in black circle. Growth and decline symbol. Up and down arrow with bar graph illustration. Decrease business graph vectors Trend chart icon in black circle. Growth and decline symbol. Up and down arrow with bar graph
Free with trial Global recession icon showing declining graph and downward arrow with globe and money, line art icon set. Decrease business graph vectors Global recession icon showing declining graph and downward arrow with globe and money, line art icon set
Free with trial Set line Global economic crisis, Dollar rate decrease, Safe and Broken piggy bank icon. Vector. Decrease business graph illustrations Set line Global economic crisis, Dollar rate decrease, Safe and Broken piggy bank icon. Vector
Free with trial Set line Worker, Credit card, Global economic crisis and. Business infographic template. Vector. Decrease business graph vectors Set line Worker, Credit card, Global economic crisis and . Business infographic template. Vector
Free with trial Downward Chart: Declining bar graph with falling arrow indicates losses and economic downturn. Decrease business graph vectors Downward Chart: Declining bar graph with falling arrow indicates losses and economic downturn
Free with trial Concept of a bankrupt company. Symbol of bankruptcy, business failure. The consequences of the financial crisis. Decrease business graph vectors Concept of a bankrupt company. Symbol of bankruptcy, business failure. The consequences of the financial crisis
Free with trial Graph going Up and Down sign with blue arrows vector. Flat design vector illustration concept of sales bar chart symbol icon with arrow moving down and sales bar chart with arrow moving up. Decrease business graph vectors Graph going Up and Down sign with blue arrows vector. Flat design vector illustration concept of sales bar chart symbol icon. Graph going Up and Down sign with blue arrows vector. Flat design vector illustration concept of sales bar chart symbol icon with arrow moving down and sales bar chart with arrow moving up.
Free with trial A colorful bar graph depicting an upward trend with a minor dip, presented as a document icon. The design uses bold colors and clean lines for a modern, data-driven aesthetic. Ideal for presentations or reports. Decrease business graph illustrations Vibrant Bar Graph on Document Icon: Upward Trend with Slight Dip, Colorful Data Visualization. A colorful bar graph depicting an upward trend with a minor dip, presented as a document icon. The design uses bold colors and clean lines for a modern, data-driven aesthetic. Ideal for presentations or reports
Free with trial Up and down trend with arrows and graph isolated on dark background. Falling and rising graph with buy and sell buttons. Stock exchange concept. Trader profit and loss. Vector illustration. Decrease business graph vectors Up and down trend with arrows and graph isolated on dark background. Falling and rising graph with buy and sell buttons. Stock
Free with trial Percent growth decline arrow icon. Increase and decrease percentage sign symbol vector. Decrease business graph vectors Percent growth decline arrow icon. Increase and decrease percentage sign symbol
Free with trial Downward arrows set. Financial decline percent. Economic crisis concept. Vector business analysis. EPS 10. Decrease business graph vectors Downward arrows set. Financial decline percent. Economic crisis concept. Vector business analysis.
Free with trial Set line Contract money and pen, Global economic crisis news, and Dollar rate decrease icon. Vector. Decrease business graph vectors Set line Contract money and pen, Global economic crisis news, and Dollar rate decrease icon. Vector
Free with trial Set line Contract money and pen, Dollar rate decrease, Global economic crisis and Money bomb dollar icon. Vector. Decrease business graph vectors Set line Contract money and pen, Dollar rate decrease, Global economic crisis and Money bomb dollar icon. Vector
Free with trial Set Isometric line Financial growth decrease, Coal mine trolley, and Data analysis icon. Vector. Decrease business graph vectors Set Isometric line Financial growth decrease, Coal mine trolley, and Data analysis icon. Vector
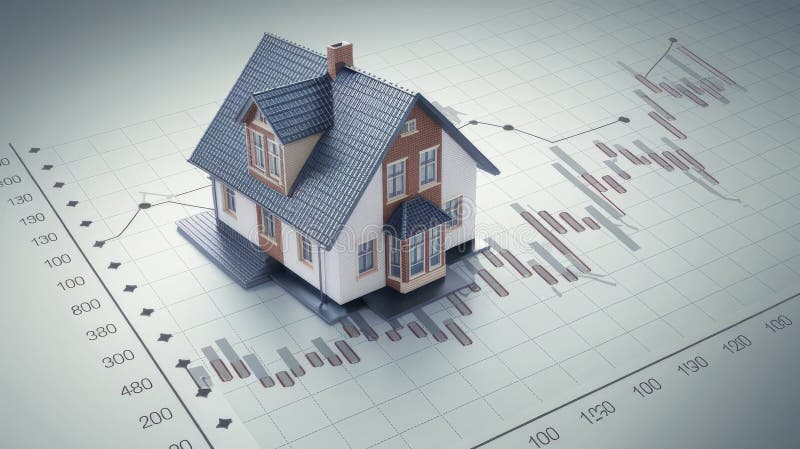
Free with trial House model placed on a graph showcasing fluctuating mortgage rates ok. Decrease business graph illustrations House model placed on a graph showcasing fluctuating mortgage rates
Free with trial House model placed on a graph showcasing fluctuating mortgage rates ok. Decrease business graph illustrations House model placed on a graph showcasing fluctuating mortgage rates
Free with trial A green line graph displays fluctuating data points across five days, presented isolated on a clean white background. Decrease business graph illustrations Green line graph showing fluctuating data trends over five days isolated on white background. A green line graph displays fluctuating data points across five. A green line graph displays fluctuating data points across five days, presented isolated on a clean white background
Free with trial A 3D bar graph with light blue bars of decreasing height, indicating a downward trend. A bright yellow arrow points downwards, crossing over the bars, symbolizing financial decline or economic recession. The background is a soft, muted pink. Decrease business graph illustrations Downward Trend Graph with Falling Arrow Illustrating Financial Decline or Economic Recession. A 3D bar graph with light blue bars of decreasing height, indicating a downward trend. A bright yellow arrow points downwards, crossing over the bars, symbolizing financial decline or economic recession. The background is a soft, muted pink
Free with trial 3d bar chart illustrating growth, analysis, and business progress with colorful visual representation of data ,Generative ai. Decrease business graph illustrations 3d bar chart, visualizing growth, data analysis, and business progress for effective communication. 3d bar chart illustrating growth, analysis, and business progress with colorful visual representation of data ,Generative ai
Free with trial Realistic image showcasing a gas pump nozzle alongside a stock market graph of fuel price trends, Generated by AI. Decrease business graph illustrations Realistic image showcasing a gas pump nozzle alongside a stock market graph of fuel price trends
Free with trial Business refers to the organized efforts and activities of individuals or groups to produce, buy, sell, and exchange goods or services for profit. Decrease business graph illustrations The piggy bank and coins for Business concept 3d rendering. Business refers to the organized efforts and activities of individuals or groups to produce, buy, sell, and exchange goods or services for profit
Free with trial Business refers to the organized efforts and activities of individuals or groups to produce, buy, sell, and exchange goods or services for profit. Decrease business graph illustrations The Arrow down and coins for Business concept 3d rendering. Business refers to the organized efforts and activities of individuals or groups to produce, buy, sell, and exchange goods or services for profit
Free with trial This compelling red zigzag line graph vividly illustrates a downward market trend, offering a concise yet insightful representation of declining stock prices. The dynamic zigzag pattern clearly highlights fluctuations and sharp drops in the data, making it an ideal tool for visualizing market analysis and economic indicators. The falling red line graph effectively communicates the negative. Decrease business graph illustrations Analyzing a Declining Market Trend Visualizing Falling Stock Prices with a Red Zigzag Line Graph. This compelling red zigzag line graph vividly illustrates a downward market trend, offering a concise yet insightful representation of declining stock prices. The dynamic zigzag pattern clearly highlights fluctuations and sharp drops in the data, making it an ideal tool for visualizing market analysis and economic indicators. The falling red line graph effectively communicates the negative
Free with trial Business refers to the organized efforts and activities of individuals or groups to produce, buy, sell, and exchange goods or services for profit. Decrease business graph illustrations The Arrow down and coins for Business concept 3d rendering. Business refers to the organized efforts and activities of individuals or groups to produce, buy, sell, and exchange goods or services for profit
Free with trial Business refers to the organized efforts and activities of individuals or groups to produce, buy, sell, and exchange goods or services for profit. Decrease business graph illustrations The Arrow down and coins for Business concept 3d rendering. Business refers to the organized efforts and activities of individuals or groups to produce, buy, sell, and exchange goods or services for profit
Free with trial Gold business icons on dark background graphs, charts, money, global, growth, finance, planning, idea, vibrant background Generative AI. Decrease business graph illustrations Gold business icons on dark background graphs, charts, money, global, growth, finance, planning, idea
Free with trial Business refers to the organized efforts and activities of individuals or groups to produce, buy, sell, and exchange goods or services for profit. Decrease business graph illustrations The piggy bank and coins for Business concept 3d rendering. Business refers to the organized efforts and activities of individuals or groups to produce, buy, sell, and exchange goods or services for profit
Free with trial Business refers to the organized efforts and activities of individuals or groups to produce, buy, sell, and exchange goods or services for profit. Decrease business graph illustrations The Arrow down and coins for Business concept 3d rendering. Business refers to the organized efforts and activities of individuals or groups to produce, buy, sell, and exchange goods or services for profit
Free with trial Business refers to the organized efforts and activities of individuals or groups to produce, buy, sell, and exchange goods or services for profit. Decrease business graph illustrations The Arrow down and coins for Business concept 3d rendering. Business refers to the organized efforts and activities of individuals or groups to produce, buy, sell, and exchange goods or services for profit
Free with trial Business refers to the organized efforts and activities of individuals or groups to produce, buy, sell, and exchange goods or services for profit. Decrease business graph illustrations The piggy bank and coins for Business concept 3d rendering. Business refers to the organized efforts and activities of individuals or groups to produce, buy, sell, and exchange goods or services for profit
Free with trial Business refers to the organized efforts and activities of individuals or groups to produce, buy, sell, and exchange goods or services for profit. Decrease business graph illustrations The Arrow down and coins for Business concept 3d rendering. Business refers to the organized efforts and activities of individuals or groups to produce, buy, sell, and exchange goods or services for profit