Free with trial A monitor displays a downward trending bar graph, symbolizing financial loss or economic decline. The visual representation emphasizes negative trends and potential risks. Decrease business graph vectors Vector art of monitor displaying a downward trending bar graph, indicating financial loss or economic decline. A monitor displays a downward trending bar graph, symbolizing financial loss or economic decline. The visual representation emphasizes negative trends and potential risks
Free with trial Set Data analysis Financial growth and decrease on seamless pattern. Vector. Decrease business graph vectors Set Data analysis, Financial growth and decrease on seamless pattern. Vector
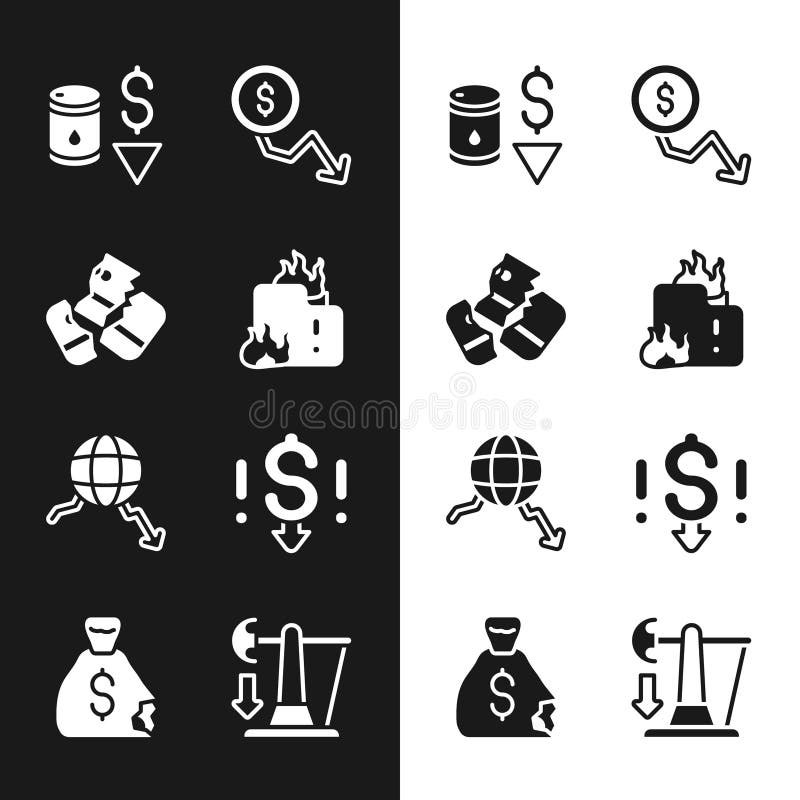
Free with trial Set line Shutdown of factory Dollar rate decrease Debt ball chained coin Calculation expenses Mobile stock trading Worker and Global economic crisis news icon. Vector. Decrease business graph illustrations Set line Shutdown of factory, Dollar rate decrease, Debt ball chained coin, Calculation expenses, Mobile stock trading. Set line Shutdown of factory Dollar rate decrease Debt ball chained coin Calculation expenses Mobile stock trading Worker and Global economic crisis news icon. Vector.
Free with trial Set Financial growth decrease Server Search data analysis Pie chart infographic cloud computing Browser with exclamation mark Data and icon. Vector. Decrease business graph illustrations Set Financial growth decrease, Server, Search data analysis, Pie chart infographic, cloud computing, Browser with. Set Financial growth decrease Server Search data analysis Pie chart infographic cloud computing Browser with exclamation mark Data and icon. Vector.
Free with trial Set Financial growth decrease and Sales funnel with chart icon. Vector. Decrease business graph illustrations Set Financial growth, decrease and Sales funnel with chart icon. Vector
Free with trial Set line Global economic crisis Drop in crude oil price Dollar rate decrease Money bag Burning dollar bill and Safe icon. Vector. Decrease business graph vectors Set line Global economic crisis, Drop in crude oil price, Dollar rate decrease, Money bag, Burning dollar bill and Safe
Free with trial Hand drawn bar graph showing a downward trend with a sale tag for discounts price reductions and market decline. Decrease business graph vectors Hand drawn bar graph showing a downward trend with a sale tag for discounts price reductions and market decline
Free with trial Red arrow pointing downward on colorful vertical bars. Business financial crisis chart with decreasing trend line. Economic data visualization. Decrease business graph illustrations Red arrow pointing downward on colorful vertical bars. Business financial crisis chart with decreasing trend line
Free with trial White line Financial growth decrease icon isolated on white background. Increasing revenue. Red circle button. Vector. Decrease business graph vectors White line Financial growth decrease icon isolated on white background. Increasing revenue. Red circle button. Vector
Free with trial Black Financial growth decrease icon isolated seamless pattern on green background. Increasing revenue. Vector. Decrease business graph vectors Black Financial growth decrease icon isolated seamless pattern on green background. Increasing revenue. Vector
Free with trial Eight circular icons with black backgrounds each feature a different chart or graph symbol. The frames are bordered by a sequence of colorful lines: red, green, blue, and yellow. The icons include bar graphs, line graphs, a pie chart, and scatter plots, all depicted in white. Each symbol includes axes and grid patterns, indicating statistical or financial data representation. The arrangement is in two rows of four, emphasizing symmetry and variety in chart types. A i Generated. Decrease business graph vectors Collection of eight different chart and graph icons displayed in circular black frames with colorful borders. Eight circular icons with black backgrounds each feature a different chart or graph symbol. The frames are bordered by a sequence of colorful lines: red, green, blue, and yellow. The icons include bar graphs, line graphs, a pie chart, and scatter plots, all depicted in white. Each symbol includes axes and grid patterns, indicating statistical or financial data representation. The arrangement is in two rows of four, emphasizing symmetry and variety in chart types. A i Generated
Free with trial Toy bear with red poker chips and financial graph illustrating stock market downturn, capturing the concept of bear market and investment risk, Generative AI. Decrease business graph illustrations Toy bear with red poker chips and financial graph illustrating stock market downturn, capturing the concept of bear market and
Free with trial Set line Financial growth decrease, Stacks paper money cash, Pie chart infographic and Pos terminal icon. Vector. Decrease business graph illustrations Set line Financial growth decrease, Stacks paper money cash, Pie chart infographic and Pos terminal icon. Vector
Free with trial Hand Drawn Graphic Chart Showing Initial Growth then Downward Trend to Final State Illustrating Business Cycle. Decrease business graph vectors Hand Drawn Graphic Chart Showing Initial Growth then Downward Trend to Final State Illustrating Business Cycle
Free with trial In a virtual space, a 3D graph displaying decreasing carbon emissions stands against modern corporate buildings. Corporate carbon reduction. Decrease business graph illustrations In a virtual space, a 3D graph displaying decreasing carbon emissions stands against modern corporate buildings
Free with trial Generative ai, The image shows a red tiled wall with a white arrow pointing down and a red bar graph that is decreasing in height. The background is a red tiled wall with white lines, and the floor is a red shiny surface with the reflection of the g. Decrease business graph illustrations The image shows a red bar graph with a white arrow pointing downwards, representing a declining trend. The graph is set against a. generative ai, The image shows a red tiled wall with a white arrow pointing down and a red bar graph that is decreasing in height. The background is a red tiled wall with white lines, and the floor is a red shiny surface with the reflection of the g
Free with trial Up and down graphic trend isolated on dark background. Falling and rising graph with buy and sell buttons. Stock exchange concept. Trader profit and loss. Vector illustration. Decrease business graph vectors Up and down graphic trend isolated on dark background. Falling and rising graph with buy and sell buttons. Stock exchange concept
Free with trial Bar Chart With Downward Arrow Line Icon. Business Decline, Financial Loss, And Market Downturn Outline Symbol. Economic Analysis And Trend Tracking. Editable Stroke. Isolated Vector Illustration. Decrease business graph vectors Bar Chart With Downward Arrow Line Icon. Business Decline, Financial Loss, And Market Downturn Outline Symbol. Economic
Free with trial Set Isometric Drop in crude oil price, Briefcase, Dollar rate decrease and Glass money jar with coin icon. Vector. Decrease business graph illustrations Set Isometric Drop in crude oil price, Briefcase, Dollar rate decrease and Glass money jar with coin icon. Vector
Free with trial Set line Falling property prices Dollar rate decrease Tearing money banknote Storm Drop crude oil Mobile stock trading Briefcase and icon. Vector. Decrease business graph illustrations Set line Falling property prices, Dollar rate decrease, Tearing money banknote, Storm, Drop crude oil, Mobile stock. Set line Falling property prices Dollar rate decrease Tearing money banknote Storm Drop crude oil Mobile stock trading Briefcase and icon. Vector.
Free with trial Decreasing bar graph illustration simple hand drawn financial decline, negative trend analysis chart with arrow axes, AI. Decrease business graph vectors Decreasing bar graph illustration simple hand drawn financial decline, negative trend analysis chart with arrow axes, AI
Free with trial Businessmen hold coins, run on stack of money in bar chart. Complete of business competiition, pursuit of economic success, financial management, capital market performance, and profit growth. Decrease business graph vectors Businessmen hold coins, run on stack of money in bar chart. Complete of business competiition, pursuit of economic success
Free with trial A bar chart with a downward-pointing red arrow and decreasing black bars symbolizing loss and failure. Finance, business, and economics concept. Decrease business graph illustrations A bar chart with a downward-pointing red arrow and decreasing black bars symbolizing loss and failure. Finance, business, and
Free with trial Financial Loss, Economic Downturn, And Business Decline Symbol Collection. Declining Bar Chart With Downward Arrow Line And Solid Icon Set. Market Analysis. Isolated Vector Illustration. Decrease business graph vectors Financial Loss, Economic Downturn, And Business Decline Symbol Collection. Declining Bar Chart With Downward Arrow Line
Free with trial Illustration of economic crisis, financial background. Stacks gold coins, US dollars with falling financial graph chart, global economic recession. Stock market crash, investment risk. Decrease business graph illustrations Illustration of economic crisis, financial background. Stacks gold coins, US dollars with falling financial graph chart, global
Free with trial Analyzing the Decline: Understanding the Downward Trend in Graph Data and Its Implications. Decrease business graph illustrations Analyzing the Decline Understanding the Downward Trend in Graph Data and Its Implications
Free with trial Set Search data analysis, Pie chart infographic, Calculator, Financial growth decrease, with folder, and icon. Vector. Decrease business graph vectors Set Search data analysis, Pie chart infographic, Calculator, Financial growth decrease, with folder, and icon. Vector
Free with trial Set Data analysis Financial growth decrease Mind map infographic Cloud download and upload Calculator Pie chart and icon. Vector. Decrease business graph illustrations Set Data analysis, Financial growth decrease, Mind map infographic, Cloud download and upload, Calculator, Pie chart and
Free with trial Set Global economic crisis Mobile stock trading Dollar rate decrease Hanging sign with Sale Stop delivery cargo truck and Shutdown of factory icon. Vector. Decrease business graph illustrations Set Global economic crisis, Mobile stock trading, Dollar rate decrease, Hanging sign with Sale, Stop delivery cargo. Set Global economic crisis Mobile stock trading Dollar rate decrease Hanging sign with Sale Stop delivery cargo truck and Shutdown of factory icon. Vector.
Free with trial Colorful Financial growth decrease icon isolated on white background. Increasing revenue. Square button. 3D render illustration. Decrease business graph illustrations Colorful Financial growth decrease icon isolated on white background. Increasing revenue. Square button. 3D render
Free with trial Set line Dollar rate decrease Drop in crude oil price Mobile stock trading Briefcase Global economic crisis and Bank building icon. Vector. Decrease business graph vectors Set line Dollar rate decrease, Drop in crude oil price, Mobile stock trading, Briefcase, Global economic crisis, and. Set line Dollar rate decrease Drop in crude oil price Mobile stock trading Briefcase Global economic crisis and Bank building icon. Vector.
Free with trial Businessman flat character design, falling down arrow chart. Business failure, investment loss. Vector illustration. Decrease business graph vectors Businessman flat character design, falling down arrow chart. Business failure, investment loss. Vector illustration
Free with trial Set Digital speed meter Location Delivery tracking Graph chart diagram Hierarchy organogram Infographic element and Financial growth decrease icon. Vector. Decrease business graph illustrations Set Digital speed meter, Location, Delivery tracking, Graph, chart, diagram, Hierarchy organogram, Infographic element. Set Digital speed meter Location Delivery tracking Graph chart diagram Hierarchy organogram Infographic element and Financial growth decrease icon. Vector.
Free with trial Analyzing the Decline: Understanding the Downward Trend in Graph Data and Its Implications. Decrease business graph illustrations Analyzing the Decline Understanding the Downward Trend in Graph Data and Its Implications
Free with trial Analyzing the Decline: Understanding the Downward Trend in Graph Data and Its Implications. Decrease business graph illustrations Analyzing the Decline: Understanding the Downward Trend in Graph Data and Its Implications
Free with trial 3D graph in virtual space portrays dwindling carbon emissions over time against futuristic corporate buildings. Corporate carbon reduction. Decrease business graph illustrations 3D graph in virtual space portrays dwindling carbon emissions over time against futuristic corporate buildings
Free with trial Black line Financial growth decrease icon isolated on white background. Increasing revenue. Random dynamic shapes. Vector. Decrease business graph illustrations Black line Financial growth decrease icon isolated on white background. Increasing revenue. Random dynamic shapes
Free with trial Set line Casino chip with dollar, Financial growth decrease, increase and Lottery ticket. Glowing neon icon. Vector. Decrease business graph vectors Set line Casino chip with dollar, Financial growth decrease, increase and Lottery ticket. Glowing neon icon. Vector
Free with trial Filled outline Financial growth decrease icon isolated on white background. Increasing revenue. Flat filled outline style with shadow. Vector. Decrease business graph illustrations Filled outline Financial growth decrease icon isolated on white background. Increasing revenue. Flat filled outline
Free with trial White line Financial growth decrease icon isolated seamless pattern on red background. Increasing revenue. Vector. Decrease business graph vectors White line Financial growth decrease icon isolated seamless pattern on red background. Increasing revenue. Vector
Free with trial Set line Pie chart infographic Pyramid infographics Light bulb Financial growth decrease Unknown search Arrow and Target icon. Vector. Decrease business graph vectors Set line Pie chart infographic, Pyramid infographics, Light bulb, Financial growth decrease, Unknown search, Arrow, and. Set line Pie chart infographic Pyramid infographics Light bulb Financial growth decrease Unknown search Arrow and Target icon. Vector.
Free with trial Green Financial growth decrease icon isolated on blue background. Increasing revenue. Minimalism concept. 3D render illustration. Decrease business graph illustrations Green Financial growth decrease icon isolated on blue background. Increasing revenue. Minimalism concept. 3D render
Free with trial Grunge Financial growth decrease icon isolated on white background. Increasing revenue. Monochrome vintage drawing. Vector. Decrease business graph illustrations Grunge Financial growth decrease icon isolated on white background. Increasing revenue. Monochrome vintage drawing
Free with trial Set Fire in burning house Credit card Drop crude oil price Dollar rate decrease Global economic crisis and Money bag icon. Vector. Decrease business graph illustrations Set Fire in burning house, Credit card, Drop crude oil price, Dollar rate decrease, Global economic crisis, and Money. Set Fire in burning house Credit card Drop crude oil price Dollar rate decrease Global economic crisis and Money bag icon. Vector.
Free with trial Set line Employee dismissal Global economic crisis Pie chart infographic Dollar rate decrease Safe Briefcase and Drop crude oil price icon. Vector. Decrease business graph vectors Set line Employee dismissal, Global economic crisis, Pie chart infographic, Dollar rate decrease, Safe, Briefcase and. Set line Employee dismissal Global economic crisis Pie chart infographic Dollar rate decrease Safe Briefcase and Drop crude oil price icon. Vector.
Free with trial Set Dollar rate decrease, Tearing money banknote, Global economic crisis and Stop delivery cargo truck icon. Vector. Decrease business graph illustrations Set Dollar rate decrease, Tearing money banknote, Global economic crisis and Stop delivery cargo truck icon. Vector
Free with trial Businessman runs and holds coins on a green arrow graph rising on a stack of coins to coin slot. Growth, wealth create, financial, investment goal, corporate develop, economic, profit and loss. Decrease business graph vectors Businessman runs and holds coins on a green arrow graph rising on a stack of coins to coin slot. Growth, wealth create, financial
Free with trial A businessman holds a coin, runs on stack of money in bar chart. Concepts of business development, pursuit of economic success, financial management, capital market performance, and profit growth. Decrease business graph vectors A businessman holds a coin, runs on stack of money in bar chart. Concepts of business development, pursuit of economic success
Free with trial Stock market plunged falling down, economic crash, investing failure or mistake, price drop, recession, investment risk concept, graph fall down to the floor. Decrease business graph illustrations Economic crash, investing failure or mistake, price drop, recession, investment risk concept, graph fall down to the floor.
Free with trial Economic critical crisis concept. The red lower arrow and graph icons on white background. Recession financial, cryptocurrency, gold, and the stock market. Losing money and cash. Bearish. Decrease business graph vectors Economic critical crisis concept. The red lower arrow and graph icons on white background. Recession financial, cryptocurrency
Free with trial Crumbling bar graph made of earth-colored material, symbolizing decline or instability, stands among broken debris on a plain background. Decrease business graph illustrations A collapsed bar graph made of earth-colored material, symbolizing decline or instability, is set amid broken debris. crumbling bar graph made of earth-colored material, symbolizing decline or instability, stands among broken debris on a plain background.
Free with trial Set line Search data analysis Server Cloud download and upload Binary code Financial growth decrease Browser with exclamation mark Data and icon. Vector. Decrease business graph vectors Set line Search data analysis, Server, Cloud download and upload, Binary code, Financial growth decrease, Browser with. Set line Search data analysis Server Cloud download and upload Binary code Financial growth decrease Browser with exclamation mark Data and icon. Vector.
Free with trial Black line Financial growth decrease icon isolated seamless pattern on green background. Increasing revenue. Vector. Decrease business graph illustrations Black line Financial growth decrease icon isolated seamless pattern on green background. Increasing revenue. Vector
Free with trial Set line Project team base, Financial growth decrease, Pyramid chart infographics and Delivery tracking icon. Vector. Decrease business graph illustrations Set line Project team base, Financial growth decrease, Pyramid chart infographics and Delivery tracking icon. Vector
Free with trial Visualizes the economic downturn in india with a declining chart and arrow. Illustrates financial crisis, market crash, and investment losses. Represents a business downfall and trade decline. Decrease business graph illustrations India economy recession chart financial crisis stock market crash business downfall investment loss trade decline. visualizes the economic downturn in india with a declining chart and arrow. Illustrates financial crisis, market crash, and investment losses. Represents a business downfall and trade decline.
Free with trial Glowing neon line Financial growth decrease icon isolated on black background. Increasing revenue. Colorful outline concept. Vector. Decrease business graph vectors Glowing neon line Financial growth decrease icon isolated on black background. Increasing revenue. Colorful outline
Free with trial Filled outline Financial growth decrease icon isolated on white background. Increasing revenue. Vector. Decrease business graph vectors Filled outline Financial growth decrease icon isolated on white background. Increasing revenue. Vector
Free with trial Russian flag overlaid with a stock market chart featuring a candlestick graph. The chart indicates a fluctuating, predominantly downward trend, with multicolored candlesticks suggesting market volatility. The flag's colors�white, blue, and red�are visible, merging with the financial data. Horizontal lines denote different price levels, providing context for the market analysis. This visual combination suggests an economic analysis of the Russian market, with an emphasis on its performance trends. Decrease business graph illustrations Russia Stock Market Chart. Russia Flag With Stock Market Data Chart, Trading Graph. Candlestick Chart With Falling Trend. Russian flag overlaid with a stock market chart featuring a candlestick graph. The chart indicates a fluctuating, predominantly downward trend, with multicolored candlesticks suggesting market volatility. The flag's colors�white, blue, and red�are visible, merging with the financial data. Horizontal lines denote different price levels, providing context for the market analysis. This visual combination suggests an economic analysis of the Russian market, with an emphasis on its performance trends.
Free with trial Isometric line Financial growth decrease icon isolated on yellow background. Increasing revenue. Black circle button. Vector. Decrease business graph vectors Isometric line Financial growth decrease icon isolated on yellow background. Increasing revenue. Black circle button
Free with trial Set line Drop in crude oil price Global economic crisis Prison cell door Dollar rate decrease Mobile stock trading and icon. Vector. Decrease business graph illustrations Set line Drop in crude oil price, Global economic crisis, Prison cell door, Dollar rate decrease, Mobile stock trading. Set line Drop in crude oil price Global economic crisis Prison cell door Dollar rate decrease Mobile stock trading and icon. Vector.
Free with trial Set Isometric line Dollar rate decrease, Global economic crisis, Pie chart infographic and Drop crude oil price icon. Vector. Decrease business graph illustrations Set Isometric line Dollar rate decrease, Global economic crisis, Pie chart infographic and Drop crude oil price icon
Free with trial This compelling stock image showcases a stark red arrow pointing downwards, a powerful visual representation of decline. The minimalist design focuses solely on the downward trend, making the message of negative movement immediately apparent. Perfect for conveying a range of concepts, from a downturn in business performance to a falling market share or a project that's fallen behind schedule. Decrease business graph illustrations Visualizing Declining Trends A Minimalist Stock Photo of a Dramatic Red Arrow Down Illustrating Business Performance. This compelling stock image showcases a stark red arrow pointing downwards, a powerful visual representation of decline. The minimalist design focuses solely on the downward trend, making the message of negative movement immediately apparent. Perfect for conveying a range of concepts, from a downturn in business performance to a falling market share or a project that's fallen behind schedule.
Free with trial Two hands cradle glowing symbols. On the left, a percentage sign emanates warmth and light, while the right hand holds an upward-trending graph, symbolizing growth. Tiny, shimmering particles float between them, suggesting the exchange of financial concepts. Created ai. Decrease business graph illustrations Boost your business success with strategic financial growth and rising interest rates now with this dynamic composition. Two hands cradle glowing symbols. On the left, a percentage sign emanates warmth and light, while the right hand holds an upward-trending graph, symbolizing growth. Tiny, shimmering particles float between them, suggesting the exchange of financial concepts. Created ai
Free with trial Businessmen hold banknotes, run on stack of money in bar chart. Complete of business competiition, pursuit of economic success, financial management, capital market performance, and profit growth. Decrease business graph vectors Businessmen hold banknotes, run on stack of money in bar chart. Complete of business competiition, pursuit of economic success
Free with trial A symbolic representation of financial downturn using a bar graph decreasing in height with a dead branch as an arrow pointing down. Sand dune backdrop enhances the aridity concept. Decrease business graph illustrations Declining profits shown by a downward trend graph in sand with a dry branch symbolizing economic crisis or recession. A symbolic representation of financial downturn using a bar graph decreasing in height with a dead branch as an arrow pointing down. Sand dune backdrop enhances the aridity concept
Free with trial Minimalist business concept image showing the word RISK on white cube blocks with a yellow warning sign, red dice and red downward chart. Clean studio composition with copy space, representing financial risk, uncertainty, crisis, volatility, danger, decision making, investment risk and business challenges. Decrease business graph illustrations Minimal Risk Business Concept With Warning Sign Dice And Downward Chart. Minimalist business concept image showing the word RISK on white cube blocks with a. Minimalist business concept image showing the word RISK on white cube blocks with a yellow warning sign, red dice and red downward chart. Clean studio composition with copy space, representing financial risk, uncertainty, crisis, volatility, danger, decision making, investment risk and business challenges.
Free with trial A digital hand displays an illuminated financial growth graph with various statistics against a dark city backdrop, emphasizing technology in data analysis and investment trends. Scalp. Decrease business graph illustrations Digital hand presenting glowing financial growth graph with statistics and global connectivity showcasing data analytics. A digital hand displays an illuminated financial growth graph with various statistics against a dark city backdrop, emphasizing technology in data analysis and investment trends. Scalp
Free with trial Economic critical crisis concept. The lower line graph and bar chart on red background. Recession financial, cryptocurrency, gold, and the stock market. Losing money and cash. Bearish. Decrease business graph vectors Economic critical crisis concept. The lower line graph and bar chart on red background. Recession financial, cryptocurrency, gold
Free with trial Infographic world map with charts, graphs, and data visualizations for business reports, presentations, and website content, vibrant background Generative AI. Decrease business graph illustrations Infographic world map with charts, graphs, and data visualizations for business reports, presentations, and website content
Free with trial Color Financial growth decrease icon isolated on white background. Increasing revenue. Flat filled outline style with shadow. Vector. Decrease business graph illustrations Color Financial growth decrease icon isolated on white background. Increasing revenue. Flat filled outline style with
Free with trial Set line Safe Drop in crude oil price Dollar rate decrease Money bag Mobile stock trading Pie chart infographic and icon. Vector. Decrease business graph vectors Set line Safe, Drop in crude oil price, Dollar rate decrease, Money bag, Mobile stock trading, Pie chart infographic and
Free with trial Set line Treasure chest Gold bars Chalkboard with diagram Stacks paper money cash ATM and Financial growth decrease and Price tag dollar icon. Vector. Decrease business graph vectors Set line Treasure chest, Gold bars, Chalkboard with diagram, Stacks paper money cash, ATM and, Financial growth decrease. Set line Treasure chest Gold bars Chalkboard with diagram Stacks paper money cash ATM and Financial growth decrease and Price tag dollar icon. Vector.
Free with trial Set line Financial growth decrease Data analysis Browser with stocks market Pie chart infographic Coal mine trolley and Cloud computing lock icon. Vector. Decrease business graph vectors Set line Financial growth decrease, Data analysis, Browser with stocks market, Pie chart infographic, Coal mine trolley. Set line Financial growth decrease Data analysis Browser with stocks market Pie chart infographic Coal mine trolley and Cloud computing lock icon. Vector.
Free with trial Glowing neon line Financial growth decrease icon isolated on blue background. Increasing revenue. Vector. Decrease business graph illustrations Glowing neon line Financial growth decrease icon isolated on blue background. Increasing revenue. Vector
Free with trial Inflation graph shows rising costs. Recession question mark graph indicates economic decline. Concepts of market fluctuation, financial crisis and budget challenges. Decrease business graph illustrations Inflation graph shows rising costs. Recession question mark graph indicates economic decline. Concepts of market fluctuation
Free with trial Abstract red background, black graph line, decline, instability, financial crisis. Symbolizes risk, uncertainty, downward trend. Can be used for display or montage your products. Generative AI. Decrease business graph illustrations Red Market Trend Abstract red background black graph line decline instability financial crisis Symbolizes risk uncertainty. Abstract red background, black graph line, decline, instability, financial crisis. Symbolizes risk, uncertainty, downward trend. Can be used for display or montage your products. Generative AI
Free with trial Black and white descending graph diagram. loss or decline. flat design style. Suitable for use in reports, illustrations, presentations, etc. vector design template. Decrease business graph vectors Black and white descending graph diagram. loss or decline. flat design style. Suitable for use in reports, illustrations
Free with trial White robot kneeling and examining a stack of plates forming a descending graph on a green background, representing economic decline or market analysis in a futuristic and conceptual way. Decrease business graph illustrations Robotic figure analyzing stacked plates forming descending graph pattern, symbolizing economic downturn against green. White robot kneeling and examining a stack of plates forming a descending graph on a green background, representing economic decline or market analysis in a futuristic and conceptual way
Free with trial Red wooden arrow points down on yellow background. Business, market decline. Indicates economic recession, financial loss, investment risk. Shows negative trends, bankruptcy. Useful for. Decrease business graph illustrations Red wooden arrow points down on yellow background. Business, market decline. Indicates economic recession, financial loss
Free with trial Colorful Financial growth decrease icon isolated on white background. Increasing revenue. Minimalism concept. 3D render illustration. Decrease business graph illustrations Colorful Financial growth decrease icon isolated on white background. Increasing revenue. Minimalism concept. 3D render