Free with trial Rocket launching with decreasing bar graph, surrounded by tropical leaves on a blue background. Created with the help of Generative AI tools. Decrease business graph illustrations Rocket launching with decreasing bar graph, surrounded by tropical leaves on a blue background
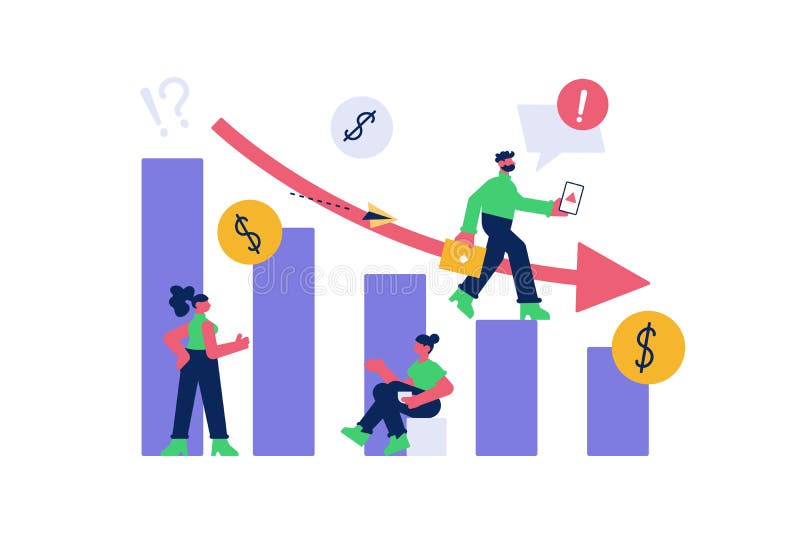
Free with trial Businessman throwing red line graph arrow to target on falling banknotes bar graph for risk management investment rebalancing and financial loss prevention concept. Decrease business graph vectors Businessman throwing red line graph arrow to target on falling banknotes bar graph for risk management investment rebalancing and. Financial loss prevention
Free with trial Capital decrease concept vector icon design, 48x48 pixel perfect and editable stroke. Decrease business graph vectors Capital decrease icon. Capital decrease concept vector icon design, 48x48 pixel perfect and editable stroke
Free with trial Colorful pie chart is showing positive statistics and business growth, target and financial analysis and marketing report, data with copy space. Decrease business graph illustrations Colorful pie chart is showing positive statistics and business growth, target and financial analysis and marketing
Free with trial GDP wooden blocks symbolize global economy slowdown and economic recession crisis impacting inflation finance and business market trends. Generative AI. Decrease business graph illustrations GDP wooden blocks symbolize global economy slowdown and economic recession crisis impacting inflation finance and business mar
Free with trial Global economic slowdown impacts finance and business market with inflation and recession crisis shown by red arrow over globe symbolizing economy. Generative AI. Decrease business graph illustrations Global economic slowdown impacts finance and business market with inflation and recession crisis shown by red arrow over globe
Free with trial Slow economic growth and inflation create global finance crisis with market slowdown impacting business and increasing risk of recession. Generative AI. Decrease business graph illustrations Slow economic growth and inflation create global finance crisis with market slowdown impacting business and increasing risk of
Free with trial Global economy faces slowdown with inflation and recession causing finance crisis impacting business and market trends negatively. Generative AI. Decrease business graph illustrations Global economy faces slowdown with inflation and recession causing finance crisis impacting business and market trends negativ
Free with trial A red stock market graph is displayed on a digital screen. The background is a blurred image of a financial district with people walking by. The graph indicates a decline in the market. Decrease business graph illustrations Red Stock Market Graph Displayed on a Digital Screen in a Financial District at Night. A red stock market graph is displayed on a digital screen. The background is a blurred image of a financial district with people walking by. The graph indicates a decline in the market
Free with trial Financial decrease concept with stacked gold coins and a red arrow pointing down, clearly labeled with word decrease. Represents falling value, investment loss, and economic downturn. Decline of wealth. Decrease business graph illustrations Stack Of Gold Coins With Red Down Arrow Indicating Decrease In Financial Value. Financial decrease concept with stacked gold coins and a red arrow pointing down, clearly labeled with word decrease. Represents falling value, investment loss, and economic downturn. Decline of wealth
Free with trial Businessman Hunting Piggy Bank Jumping Down on Falling Stack of Gold Bars Bar Graph with Red Arrow Spear Representing Gold Market Crash Financial Loss and Asset Devaluation. Decrease business graph vectors Businessman Hunting Piggy Bank Jumping Down on Falling Stack of Gold Bars Bar Graph with Red Arrow Spear Representing Gold Market
Free with trial Hands holding a tablet displaying a stock market graph, illustrating finance, investment analysis, and modern digital trading. Decrease business graph illustrations Hands holding tablet displaying stock market graph. Hands holding a tablet displaying a stock market graph, illustrating finance, investment analysis, and modern digital trading.
Free with trial Graph going Up and Down sign with green and red arrows vector set. Flat design vector set of a concept of sales bar chart symbol icon with arrow moving down and sales bar chart with arrow moving up. Decrease business graph vectors Graph going Up and Down sign with green and red arrows vector set. Flat design vector set of a concept of sales bar chart arrows. Graph going Up and Down sign with green and red arrows vector set. Flat design vector set of a concept of sales bar chart symbol icon with arrow moving down and sales bar chart with arrow moving up.
Free with trial This vibrant abstract graph illustrates the dynamic trends in financial markets, highlighting fluctuations in trading data and investment opportunities. Decrease business graph illustrations Abstract financial trading graph with vibrant color scheme showcasing fluctuating market trends and data analysis visuals. This vibrant abstract graph illustrates the dynamic trends in financial markets, highlighting fluctuations in trading data and investment opportunities
Free with trial Trend down graph icon. stock icon on white background. flat style. financial market crash icon for your web site design, logo, app, UI. graph chart downtrend symbol. chart going down sign. Decrease business graph vectors Trend down graph icon. stock icon on white background. flat style. financial market crash icon for your web site design, logo, app
Free with trial GDP wooden blocks symbolize global economy slowdown and economic recession crisis with inflation impacting finance and business market growth. Generative AI. Decrease business graph illustrations GDP wooden blocks symbolize global economy slowdown and economic recession crisis with inflation impacting finance and business
Free with trial Abstract blue 3D bar chart with glowing line graph shows market growth. Digital data visualization indicates positive trend. Financial analysis graphic, with bokeh. Decrease business graph illustrations Abstract blue 3D bar chart with glowing line graph shows market growth. Digital data visualization indicates positive trend.
Free with trial Business graph icon. Flat design. Vector illustration, EPS 10. Decrease business graph vectors Recession statistics financial failure concept. Business graph icon. Flat design. Vector illustration, EPS 10.
Free with trial Downfall red arrows of business sale drops vector. Decrease business graph vectors Downfall red arrows of business sale drops
Free with trial Stressed businessman with falling red arrow graph overlay indicating financial crisis, bankruptcy, and stock market recession. Generative AI. Decrease business graph illustrations Stressed businessman with falling red arrow graph overlay indicating financial crisis bankruptcy and stock market recession
Free with trial A downward trending graph with a dollar sign illustrates economic decline, financial loss, and market downturn, isolated on a white background for clarity. Decrease business graph vectors Vector art of a downward trending graph with a dollar sign, , illustrating economic decline, financial loss, and market downturn. A downward trending graph with a dollar sign illustrates economic decline, financial loss, and market downturn, isolated on a white background for clarity
Free with trial Two business banners with space for text. Vector flat design. Horizontal layout. Bankrupt standing on the background of decreasing chart. African bankrupt business woman standing with spread arms. Decrease business graph vectors Two business banners with space for text.
Free with trial Laptop displaying a declining chart with an error sign, symbolizing business failure. Decrease business graph vectors Laptop showing declining chart with error sign, business failure concept. Laptop displaying a declining chart with an error sign, symbolizing business failure
Free with trial Cost reduction concept. Quality increase and cost optimization, Hands typing on a laptop with digital icons representing business efficiency and cost reduction. Effective business, Expense reduce. Decrease business graph illustrations Cost reduction concept. Quality increase and cost optimization, Hands typing on a laptop with digital icons representing business
Free with trial Golden dragon statue symbolizes strength amid global economy slowdown and inflation crisis impacting business and market finance recession. Generative AI. Decrease business graph illustrations Golden dragon statue symbolizes strength amid global economy slowdown and inflation crisis impacting business and market finance
Free with trial Economic crisis and inflation impact global business market causing slowdown and recession in finance sectors with sharp decline trends. Generative AI. Decrease business graph illustrations Economic crisis and inflation impact global business market causing slowdown and recession in finance sectors with sharp decline
Free with trial Slow economic growth and inflation create global finance crisis causing market slowdown and business recession impacting economy deeply. Generative AI. Decrease business graph illustrations Slow economic growth and inflation create global finance crisis causing market slowdown and business recession impacting economy
Free with trial Business concept vector illustration. Chart Falling businessman and falling down arrow. Crisis graphic. Business fail. Decrease business graph illustrations Business concept vector illustration. Chart Falling businessman and falling down arrow. Business fail
Free with trial Sine waves analysis outline icon in white and black colors. sine waves analysis flat vector icon from business and analytics collection for web, mobile apps and ui. Decrease business graph vectors Sine waves analysis outline icon in white and black colors. sine waves analysis flat vector icon from business and analytics
Free with trial Businessman Hunting Piggy Bank Jumping Down on Falling Stack of Gold Coins Bar Graph with Red Arrow Spear Representing Savings Depletion Financial Loss and Economic Downturn. Decrease business graph vectors Businessman Hunting Piggy Bank Jumping Down on Falling Stack of Gold Coins Bar Graph with Red Arrow Spear Representing Savings
Free with trial This image features an intricate bar graph displaying colorful statistical data trends, perfect for business reports and presentations. Analyze metrics effectively. Decrease business graph illustrations Colorful Data Visualization with Bar Graphs and Trends Displaying Statistical Information on a White Background. This image features an intricate bar graph displaying colorful statistical data trends, perfect for business reports and presentations. Analyze metrics effectively
Free with trial The arab businessman in oil price business concept. Decrease business graph illustrations The arab businessman in oil price business concept
Free with trial Colorful wooden blocks arranged curve symbolize global economy slowdown and economic crisis impacting finance, business, market, inflation. Generative AI. Decrease business graph illustrations Colorful wooden blocks arranged curve symbolize global economy slowdown and economic crisis impacting finance business market. Colorful wooden blocks arranged curve symbolize global economy slowdown and economic crisis impacting finance, business, market, inflation. Generative AI
Free with trial Open lab top with green graph is going down with bear graphic represents stock market is bear market at that time. Decrease business graph vectors BEAR AND GRAPH ON COMPUTER. Open lab top with green graph is going down with bear graphic represents stock market is bear market at that time.
Free with trial Infographic timeline. Block diagram, Identification card and Decreasing graph icons simple set. Romantic gift sign. Algorithm path, Person document, Column chart. Surprise with love. Vector. Decrease business graph vectors Block diagram, Identification card and Decreasing graph icons set. Romantic gift sign. Vector. Infographic timeline. Block diagram, Identification card and Decreasing graph icons simple set. Romantic gift sign. Algorithm path, Person document, Column chart. Surprise with love. Vector
Free with trial Businessman Hunting Piggy Bank Jumping Down on Falling Stack of Banknotes Bar Graph with Red Arrow Spear Representing Cash Flow Loss Economic Recession and Financial Crisis. Decrease business graph vectors Businessman Hunting Piggy Bank Jumping Down on Falling Stack of Banknotes Bar Graph with Red Arrow Spear Representing Cash Flow
Free with trial Businessman riding piggy bank jumping down on falling money banknotes bar graph staircase escaping red arrow spear during stock market crash and financial investment loss. Decrease business graph vectors Businessman riding piggy bank jumping down on falling money banknotes bar graph staircase escaping red arrow spear during stock
Free with trial Abstract financial bar chart with red downtrend line arrow graph on blue color background. Decrease business graph illustrations Abstract financial bar chart with red downtrend line arrow graph on blue color background
Free with trial This image represents financial loss with a graph showing a downward trend, symbolizing economic decline. A hand supports the graph, highlighting investment risks. Decrease business graph vectors Vector art of financial loss concept a hand supports a graph showing a downward trend, indicating economic decline and potential. This image represents financial loss with a graph showing a downward trend, symbolizing economic decline. A hand supports the graph, highlighting investment risks
Free with trial Line graph, Target and Report timer icons simple set. Blog, Pie chart and Efficacy signs. Market diagram, Targeting. Education set. Line line graph icon. Editable stroke. Vector. Decrease business graph vectors Line graph, Target and Report timer icons set. Blog, Pie chart and Efficacy signs. Market diagram, Targeting. Vector. Line graph, Target and Report timer icons simple set. Blog, Pie chart and Efficacy signs. Market diagram, Targeting. Education set. Line line graph icon. Editable stroke. Vector
Free with trial Sine waves analysis icon on white background. Simple element illustration from Business and analytics concept. sine waves analysis sign icon symbol design. Decrease business graph vectors Sine waves analysis icon on white background. Simple element illustration from Business and analytics concept
Free with trial Oil price growth graph illustration. Oil pump icons on growing chart. Modern brochure, report or flyer design template. 3D rendering. Neon bulb illumination. Decrease business graph illustrations Oil price graph. Oil price growth graph illustration. Oil pump icons on growing chart. Modern brochure, report or flyer design template. 3D rendering. Neon bulb illumination
Free with trial Stacked coins on wooden blocks symbolize global economy slowdown and economic crisis with inflation impacting finance business market recession. Generative AI. Decrease business graph illustrations Stacked coins on wooden blocks symbolize global economy slowdown and economic crisis with inflation impacting finance business
Free with trial Economic critical crisis concept. The bar graph with a down arrow on red world map background. Recession financial, cryptocurrency, gold, and the stock market. Losing money and cash. Bearish. Decrease business graph vectors Economic critical crisis concept. The bar graph with a down arrow on red world map background. Recession financial, cryptocurrency
Free with trial An asian business woman with falling down graph is confused. Bankruptcy concept. Vector line design illustration. Vertical layout with a text space. Decrease business graph vectors Bankruptcy
Free with trial Businessman riding piggy bank jumping down on falling gold bars bar graph staircase escaping red arrow spear during stock market crash and precious metal investment loss. Decrease business graph vectors Businessman riding piggy bank jumping down on falling gold bars bar graph staircase escaping red arrow spear during stock market
Free with trial Decreased graph with coins on a colored background. Decrease business graph illustrations Decreased graph with coins
Free with trial A neon dollar sign with an arrow pointing down symbolizes financial loss, economic downturn, or decrease in value. The design is modern and visually striking. Decrease business graph vectors Vector art of neon dollar sign pointing down, symbolizing financial loss, economic downturn, or decrease in value with a modern. A neon dollar sign with an arrow pointing down symbolizes financial loss, economic downturn, or decrease in value. The design is modern and visually striking
Free with trial Businessman pointing at declining graph icon flat style vector illustration. Decrease business graph vectors Businessman pointing at declining graph icon flat style
Free with trial Businessman riding piggy bank jumping down on falling gold coins bar graph staircase escaping red arrow spear during stock market crash and gold price decline concept. Decrease business graph vectors Businessman riding piggy bank jumping down on falling gold coins bar graph staircase escaping red arrow spear during stock market
Free with trial The Cost reduction and coins for Business concept 3d rendering. Decrease business graph illustrations The Cost reduction and coins for Business concept 3d rendering
Free with trial The Cost reduction and coins for Business concept 3d rendering. Decrease business graph illustrations The Cost reduction and coins for Business concept 3d rendering
Free with trial Dollar Loss graph vector icon symbol isolated on white background eps10. Decrease business graph vectors Dollar Loss graph vector icon symbol isolated on white background
Free with trial The Cost reduction and coins for Business concept 3d rendering. Decrease business graph illustrations The Cost reduction and coins for Business concept 3d rendering
Free with trial The Cost reduction and coins for Business concept 3d rendering. Decrease business graph illustrations The Cost reduction and coins for Business concept 3d rendering
Free with trial The Cost reduction and coins for Business concept 3d rendering. Decrease business graph illustrations The Cost reduction and coins for Business concept 3d rendering
Free with trial The Cost reduction and coins for Business concept 3d rendering. Decrease business graph illustrations The Cost reduction and coins for Business concept 3d rendering
Free with trial A vibrant line graph visually representing fluctuating data trends over time, highlighting growth with colorful markers in green, yellow, and orange for better insights. Decrease business graph illustrations Colorful Line Graph Showing Data Trends with Green, Yellow, and Orange Indicators Representing Growth and Fluctuations Across. A vibrant line graph visually representing fluctuating data trends over time, highlighting growth with colorful markers in green, yellow, and orange for better insights
Free with trial Handmade origami style 3d chart showing falling trend. sharp pointed white paper sculpture casting shadows on flat surface. minimalist conceptual photography. economic crisis representation. business failure metaphor. clean architectural paper design. Decrease business graph illustrations Creative paper art representing white downward arrow graph on light blue background symbolizing financial decline or recession. Handmade origami style 3d chart showing falling trend. sharp pointed white paper sculpture casting shadows on flat surface. minimalist conceptual photography. economic crisis representation. business failure metaphor. clean architectural paper design
Free with trial The Cost reduction and coins for Business concept 3d rendering. Decrease business graph illustrations The Cost reduction and coins for Business concept 3d rendering
Free with trial The Cost reduction and coins for Business concept 3d rendering. Decrease business graph illustrations The Cost reduction and coins for Business concept 3d rendering
Free with trial Line drawing of a flipchart showing a graph with a downward arrow representing economic downturn. Decrease business graph vectors Flipchart showing arrow graph going down representing financial crisis. Line drawing of a flipchart showing a graph with a downward arrow representing economic downturn
Free with trial The Cost reduction and coins for Business concept 3d rendering. Decrease business graph illustrations The Cost reduction and coins for Business concept 3d rendering
Free with trial The Cost reduction and coins for Business concept 3d rendering. Decrease business graph illustrations The Cost reduction and coins for Business concept 3d rendering
Free with trial The Cost reduction and coins for Business concept 3d rendering. Decrease business graph illustrations The Cost reduction and coins for Business concept 3d rendering
Free with trial The Cost reduction and coins for Business concept 3d rendering. Decrease business graph illustrations The Cost reduction and coins for Business concept 3d rendering
Free with trial Abstract financial bar chart with red downtrend line arrow graph on blue color background. Decrease business graph illustrations Abstract financial bar chart with red downtrend line arrow graph on blue color background
Free with trial Business decline chart icon, color set. Simple vector logo. Decrease business graph vectors Business decline chart icon, color set
Free with trial Decreasing graph with euro symbol, 3D Rendering. Decrease business graph illustrations Decreasing graph with euro symbol
Free with trial Widescreen abstract financial chart with downtrend line graph arrow and world map in stock market on red color background. Decrease business graph illustrations Widescreen abstract financial chart with downtrend line graph arrow and world map in stock market on red color background
Free with trial Decreasing graph with euro symbol, 3D Rendering. Decrease business graph illustrations Decreasing graph with euro symbol
Free with trial A businessman presents a glowing holographic bar and line graph displaying a peak followed by a sharp financial downturn and market decline. This visual represents economic challenges and risk. Decrease business graph illustrations Business professional holding a glowing financial chart showing a significant market downturn and economic decline in performance. A businessman presents a glowing holographic bar and line graph displaying a peak followed by a sharp financial downturn and market decline. This visual represents economic challenges and risk.
Free with trial Financial chart with red arrow down. Graph of economic recession. Vector illustration. Decrease business graph vectors Financial chart with red arrow down. Graph of economic recession
Free with trial Minimalistic animated red bar chart visualizing steady decline and downward performance. Represents business losses, market downturn, economic slowdown, financial risk, crisis scenarios, and negative growth in a modern digital style. Decrease business graph illustrations Declining Business Chart Showing Negative Market Trend. Minimalistic animated red bar chart visualizing steady decline and downward performance. Represents business losses, market downturn, economic slowdown, financial risk, crisis scenarios, and negative growth in a modern digital style.
Free with trial Graph with arrow going down. vector symbol. Decrease business graph illustrations Graph with arrow going down. vector symbol
Free with trial World financial crisis. Business failure, economy crash or bankruptcy concept. Crisis management, rating decrease or company bankruptcy. Vector business team losing profit flat illustration. Decrease business graph vectors Global financial crisis and global finance bankruptcy. World financial crisis. Business failure, economy crash or bankruptcy concept. Crisis management, rating decrease or company bankruptcy. Vector business team losing profit flat illustration
Free with trial Market finance fall. Financial graph down. Businessman sits sad in front of a falling market. Financial crisis. Vector illustration flat design. Isolated on white background. Decrease business graph vectors Market finance fall. Financial graph down. Vector flat. Market finance fall. Financial graph down. Businessman sits sad in front of a falling market. Financial crisis. Vector illustration flat design. Isolated on white background.
Free with trial Money loss. Cash with down arrow stocks graph, concept of financial crisis, market fall. Vector stock illustration. Decrease business graph vectors Money loss. Cash with down arrow stocks graph, concept of financial crisis, market fall. Vector illustration.