Free with trial A stacked area chart performance data with distinct colored segments in a rainbow gradient. The vertical axis percentages from 0% to 170%, and the horizontal axis percentage values. Decrease business graph illustrations Stacked area chart showing level performance with rainbow colors and percentage axis graph data. A stacked area chart performance data with distinct colored segments in a rainbow gradient. The vertical axis percentages from 0% to 170%, and the horizontal axis percentage values
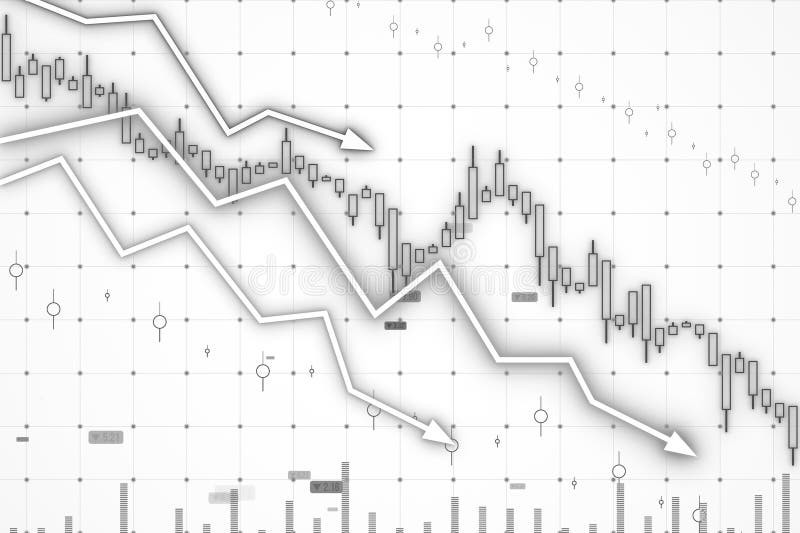
Free with trial This image represents a financial crisis with a downward trend and a broken surface. Decrease business graph illustrations Economic downturn concept with a red graph and a blue arrow pointing down. This image represents a financial crisis with a downward trend and a broken surface
Free with trial Photo of handwritten charts illustrating inflation and potential recession. Graphs show rising prices and economic downturn concerns. Financial crisis concept depicted with, business. Decrease business graph illustrations Photo of handwritten charts illustrating inflation and potential recession. Graphs show rising prices and economic downturn
Free with trial A black bar chart showing a downward trend with an arrow on a white background. Clear details and vibrant colo. Decrease business graph illustrations Black downward trending bar chart with arrow on white background graph. A black bar chart showing a downward trend with an arrow on a white background. Clear details and vibrant colo
Free with trial A bold, red 3D arrow points downward, symbolizing decline or decrease. The arrow features a sharp, zigzag design, conveying movement and direction. Its glossy surface reflects light, enhancing its vivid appearance. The background is a clean, minimalistic white, emphasizing the arrow's striking color and form. Decrease business graph vectors Red 3d arrow pointing downward against black background symbolizing decline. A bold, red 3D arrow points downward, symbolizing decline or decrease. The arrow features a sharp, zigzag design, conveying movement and direction. Its glossy surface reflects light, enhancing its vivid appearance. The background is a clean, minimalistic white, emphasizing the arrow's striking color and form.
Free with trial Flat lay colorful arrow sign symbol falling down on blue background copy space. Abstract economy crisis, stock market collapse, business, finance and investment loss concept. Decrease business graph illustrations Flat lay colorful arrow sign symbol falling down on blue background copy space.
Free with trial A sharp red arrow points downwards, illustrating a significant decrease or failure. This visual metaphor is commonly used to represent economic recession, stock market losses, or declining performance. Decrease business graph illustrations Red downward trend arrow symbolizing financial decline and market downturn. A sharp red arrow points downwards, illustrating a significant decrease or failure. This visual metaphor is commonly used to represent economic recession, stock market losses, or declining performance
Free with trial A businessman in a suit points to a check mark icon and declining graph illustrating cost reduction The visual presentation emphasizes decreasing costs to improve profits with a money bag symbolizing the potential financial gains from effective strategies and successful implementation. Decrease business graph illustrations Cost reduction strategy presented by businessman demonstrating declining trend to increase profits. A businessman in a suit points to a check mark icon and declining graph illustrating cost reduction The visual presentation emphasizes decreasing costs to improve profits with a money bag symbolizing the potential financial gains from effective strategies and successful implementation
Free with trial 3d bar chart with orange and green bars on a blue grid background isolated on white. Decrease business graph illustrations 3d bar chart with orange and green bars on blue grid background graph data. 3d bar chart with orange and green bars on a blue grid background isolated on white
Free with trial This 3D rendering showcases stacks of Bitcoin-like coins alongside a rising bar graph, illustrating cryptocurrency market growth. The image is generated by AI and ideal for illustrating financial concepts related to digital currencies. Decrease business graph illustrations Cryptocurrency Growth Chart. This 3D rendering showcases stacks of Bitcoin-like coins alongside a rising bar graph, illustrating cryptocurrency market growth. The image is generated by AI and ideal for illustrating financial concepts related to digital currencies.
Free with trial A shimmering dollar sign amid falling fragments, reflecting a dramatic financial downturn event. Decrease business graph illustrations Financial Market Crash: Falling dollar sign with a dark stock graph backdrop. A shimmering dollar sign amid falling fragments, reflecting a dramatic financial downturn event
Free with trial A person in a business suit examines a screen displaying market data with downward trending red lines, suggesting analysis of financial trends Perfect for business and investment themes. Decrease business graph illustrations Analyzing Market Data Shown on Screen by Person in Suit. A person in a business suit examines a screen displaying market data with downward trending red lines, suggesting analysis of financial trends Perfect for business and investment themes
Free with trial A conceptual image depicting a factory with a downward trending graph, symbolizing a decline in production or industrial recession. The image uses a paper craft style, showing hands interacting with the elements. Ideal for illustrating economic downturn, manufacturing challenges, or automation impact on jobs. The dark smoke adds a visual element of pollution. Decrease business graph illustrations Factory Production Decline: Industrial Recession Concept. A conceptual image depicting a factory with a downward trending graph, symbolizing a decline in production or industrial recession. The image uses a paper craft style, showing hands interacting with the elements. Ideal for illustrating economic downturn, manufacturing challenges, or automation impact on jobs. The dark smoke adds a visual element of pollution.
Free with trial A visual depiction of decreasing financial returns with a pyramid of coins descending alongside a sloping graph illustrating a downward economic trend. Decrease business graph illustrations Declining interest rates represented by stacked coins and downward trend graph. A visual depiction of decreasing financial returns with a pyramid of coins descending alongside a sloping graph illustrating a downward economic trend
Free with trial Bar graph with declining values, percentage on black square, globe in blue square. Ideal for data, statistics, global business, market trends, finance, analysis research flat simple metaphor. Decrease business graph vectors Bar chart with decreasing bars alongside percentage and globe icons for data and global analytics. Bar graph with declining values, percentage on black square, globe in blue square. Ideal for data, statistics, global business, market trends, finance, analysis research flat simple metaphor
Free with trial Hand-drawn financial charts, graphs, and calculators perfect for business, finance, and accounting illustrations. These vector illustrations depict various tools used for data analysis and financial calculations. Decrease business graph vectors Collection of Hand Drawn Financial Charts and Calculators. Hand-drawn financial charts, graphs, and calculators perfect for business, finance, and accounting illustrations. These vector illustrations depict various tools used for data analysis and financial calculations.
Free with trial A visual representation of financial losses or declining market trends, ideal for economic reports and business analysis presentations. Decrease business graph illustrations Bar chart showing a significant decline, emphasized by a red arrow pointing downwards and a magnifying glass. A visual representation of financial losses or declining market trends, ideal for economic reports and business analysis presentations
Free with trial The image shows a visual representation of a downward trend using a bar chart and a bold red arrow pointing downward. The chart is displayed on a light-colored easel with a small figure standing behind it, suggesting a presentation or analysis of decreasing values over time, possibly in a business or financial context. Decrease business graph illustrations Declining trend illustrated with bar chart and arrow on easel. The image shows a visual representation of a downward trend using a bar chart and a bold red arrow. The image shows a visual representation of a downward trend using a bar chart and a bold red arrow pointing downward. The chart is displayed on a light-colored easel with a small figure standing behind it, suggesting a presentation or analysis of decreasing values over time, possibly in a business or financial context
Free with trial A suited man observes a declining stock market chart on a large screen in a dimly lit office setting. Great for illustrating finance and business concepts. Decrease business graph illustrations Man Viewing Falling Stock Market Chart on Screen in Office. A suited man observes a declining stock market chart on a large screen in a dimly lit office setting. Great for illustrating finance and business concepts
Free with trial Red falling arrow and declining chart with stock market data overlay on office interior background, symbolizing global financial collapse impact. Decrease business graph illustrations Financial market crash with red downward arrow and stock graph lines descending sharply over modern office background during. Red falling arrow and declining chart with stock market data overlay on office interior background, symbolizing global financial collapse impact
Free with trial A stylized illustration of a downward arrow pointing towards a dollar sign inside a circular frame symbolizing financial decline or decrease with a clean minimalistic design perfect for financial analysis and economic topics. Decrease business graph illustrations Downward Arrow with Dollar Sign in Circular Frame Financial Concept Illustration. A stylized illustration of a downward arrow pointing towards a dollar sign inside a circular frame symbolizing financial decline or decrease with a clean minimalistic design perfect for financial analysis and economic topics
Free with trial A vibrant image featuring a thick, textured green arrow pointing upwards, symbolizing growth, success, and progress. Contrasting this, a bold red arrow points downwards, representing decline, loss, and failure. Both arrows are rendered with a painterly style, suggesting a hand-drawn or artistic representation of financial or market trends. The clean white background isolates the arrows, emphasizing their symbolic meaning. This visual is ideal for illustrating concepts like stock market fluctuations, business performance, positive and negative trends, or decision-making. Decrease business graph illustrations Up and Down Arrows: Growth vs. Decline. A vibrant image featuring a thick, textured green arrow pointing upwards, symbolizing growth, success, and progress. Contrasting this, a bold red arrow points downwards, representing decline, loss, and failure. Both arrows are rendered with a painterly style, suggesting a hand-drawn or artistic representation of financial or market trends. The clean white background isolates the arrows, emphasizing their symbolic meaning. This visual is ideal for illustrating concepts like stock market fluctuations, business performance, positive and negative trends, or decision-making.
Free with trial A dynamic red jagged arrow plunges downward, visually representing a sharp decline, economic downturn, or negative trend in business and finance. Ideal for charting losses or market drops. Decrease business graph illustrations Red jagged arrow pointing down symbolizing financial decline or negative trend. A dynamic red jagged arrow plunges downward, visually representing a sharp decline, economic downturn, or negative trend in business and finance. Ideal for charting losses or market drops
Free with trial A striking red arrow curves downwards, symbolizing a financial downturn economic recession or declining performance. This graphic conveys a clear message of loss, regression, or negative trends. Decrease business graph illustrations Red downward arrow symbol showing decline and negative trend in business and finance. A striking red arrow curves downwards, symbolizing a financial downturn economic recession or declining performance. This graphic conveys a clear message of loss, regression, or negative trends
Free with trial ?a high-quality 3d illustration of a miniature wooden house placed on the tallest block of a declining bar graph . set on a wooden table with soft natural sunlight from a window, this image conceptualizes debt reduction, mortgage payments, decreasing real estate prices, or strategic financial planning for home ownership. Decrease business graph illustrations Wooden house model on descending bar chart representing mortgage reduction or property market analysis. ?a high-quality 3d illustration of a miniature wooden house placed on the tallest block of a declining bar graph. set on a wooden table with soft natural sunlight from a window, this image conceptualizes debt reduction, mortgage payments, decreasing real estate prices, or strategic financial planning for home ownership.
Free with trial Close-up of stacks of gold coins resting on a financial chart, symbolizing wealth, investment, finance, and economic growth. The image evokes a sense of prosperity and success in business and trading. Decrease business graph illustrations Stacks of Gold Coins on Financial Chart. Close-up of stacks of gold coins resting on a financial chart, symbolizing wealth, investment, finance, and economic growth. The image evokes a sense of prosperity and success in business and trading.
Free with trial Stock fall recession economy crisis financial global market chart on red decline background concept with loss price down finance graph or digital crash diagram failure money. Decrease business graph illustrations Stock fall recession economy crisis financial global market chart on red decline background concept with loss price down finance
Free with trial This vibrant image, generated by AI, depicts a cityscape with a dynamic graph illustrating growth and potential decline. The color transition symbolizes economic fluctuations, offering a visual representation of urban development and market trends. Decrease business graph illustrations AI-Generated Cityscape Growth Chart. This vibrant image, generated by AI, depicts a cityscape with a dynamic graph illustrating growth and potential decline. The color transition symbolizes economic fluctuations, offering a visual representation of urban development and market trends.
Free with trial Blue upward bar graph with arrow and falling coin near a sad face. Ideal for finance, economy, investment risks, financial loss, market analysis, emotional impact, business strategies. Simple flat. Decrease business graph vectors Financial growth with unhappy outcome reflected by increasing bar chart, falling coin, and sad face. Blue upward bar graph with arrow and falling coin near a sad face. Ideal for finance, economy, investment risks, financial loss, market analysis, emotional impact, business strategies. Simple flat
Free with trial A financial graph depicting a decline, featuring vibrant red and yellow candlesticks on a sleek digital background, conveying market downturns. Decrease business graph illustrations Digital stock market chart showing a downward trend with red and yellow candlesticks. A financial graph depicting a decline, featuring vibrant red and yellow candlesticks on a sleek digital background, conveying market downturns
Free with trial Falling bar chart with a red warning sign signifies financial risk and economic decline, suggesting the need for caution in investing and business strategies. Decrease business graph illustrations Declining Chart with Warning Sign Illustrating Market Downturn. Falling bar chart with a red warning sign signifies financial risk and economic decline, suggesting the need for caution in investing and business strategies
Free with trial Red graph plummeting down with the word crash superposed, representing a financial crisis. Decrease business graph illustrations Stock market crashing showing economic crisis. Red graph plummeting down with the word crash superposed, representing a financial crisis
Free with trial A vibrant illustration depicting financial challenges, including a broken piggy bank, money stacks, a declining graph, and a safe, symbolizing financial literacy and banking. Decrease business graph vectors Financial Challenges and Solutions Illustration. A vibrant illustration depicting financial challenges, including a broken piggy bank, money stacks, a declining graph, and a safe, symbolizing financial literacy and banking.
Free with trial A vibrant circular chart displaying a twenty percent decrease with bright colors and clean design, ideal for business, finance, and analytics presentations. Decrease business graph illustrations Colorful Circular Chart with Percentage Reduction in Modern Data Visualization Style. A vibrant circular chart displaying a twenty percent decrease with bright colors and clean design, ideal for business, finance, and analytics presentations
Free with trial A modern workspace features a desktop computer displaying hand-drawn charts and graphs, representing data analysis and business insights. The screen shows various types of charts including bar graphs, line graphs, and pie charts. The overall image projects a sense of productivity and strategic pla. Decrease business graph illustrations Data Visualization on Desktop. A modern workspace features a desktop computer displaying hand-drawn charts and graphs, representing data analysis and business insights. The screen shows various types of charts including bar graphs, line graphs, and pie charts. The overall image projects a sense of productivity and strategic pla
Free with trial This image shows a calculator, tablet, and financial charts, all generated by AI for illustrative purposes. The blue color scheme emphasizes the data-driven nature of modern finance and business analytics. The image suggests efficiency and precision in financial planning and analysis. Decrease business graph illustrations Financial Data Analysis. This image shows a calculator, tablet, and financial charts, all generated by AI for illustrative purposes. The blue color scheme emphasizes the data-driven nature of modern finance and business analytics. The image suggests efficiency and precision in financial planning and analysis.
Free with trial Visual representation of financial trends with euro symbols, depicting both upward and downward movements in bar graph format, suitable for economic analysis. Decrease business graph vectors Bar charts showing euro currency growth and decline isolated on transparent background. Visual representation of financial trends with euro symbols, depicting both upward and downward movements in bar graph format, suitable for economic analysis
Free with trial Illustration of a depressed stickman holding a financial report, with a downward currency sign in a thought bubble. Symbolizes economic downturn or financial loss. Perfect for illustrating business. Decrease business graph illustrations Depressed Stickman Character Holds a Financial Report with Downward Dollar Sign Thought Bubble Illustration. Illustration of a depressed stickman holding a financial report, with a downward currency sign in a thought bubble. Symbolizes economic downturn or financial loss. Perfect for illustrating business
Free with trial 3D bar chart with red arrows pointing upwards, reflecting off a shiny, blue surface. The clean, minimalist design symbolizes financial growth, business success, and positive market trends. Ideal for use in presentations, financial reports, and marketing materials related to investment, stock market, and economic progress. Decrease business graph illustrations Financial Growth 3D Bar Chart with Red Arrows. 3D bar chart with red arrows pointing upwards, reflecting off a shiny, blue surface. The clean, minimalist design symbolizes financial growth, business success, and positive market trends. Ideal for use in presentations, financial reports, and marketing materials related to investment, stock market, and economic progress
Free with trial Visualize investment loss with this 3D rendering. A downward-pointing red arrow plunges towards scattered coins on a smartphone screen, symbolizing financial decline. Ideal for illustrating market downturns, recession risks, and online banking losses. Use this image for business, finance, or technology content. The purple pastel background adds a modern touch to this digital illustration of a. Decrease business graph illustrations Investment loss concept with down arrow and coins on smartphone. Visualize investment loss with this 3D rendering. A downward-pointing red arrow plunges towards scattered coins on a smartphone screen, symbolizing financial decline. Ideal for illustrating market downturns, recession risks, and online banking losses. Use this image for business, finance, or technology content. The purple pastel background adds a modern touch to this digital illustration of a
Free with trial A striking visual representation of sustainable energy and financial growth. Wind turbines stand tall against a dramatic sunset, symbolizing renewable energy. A superimposed financial chart illustrates upward trends, suggesting positive investment and economic progress in the green energy sector. The image combines environmental consciousness with business concepts, ideal for illustrating investment, sustainability, and future-oriented themes. Decrease business graph illustrations Sustainable Energy Investment: Wind Turbines and Financial Chart. A striking visual representation of sustainable energy and financial growth. Wind turbines stand tall against a dramatic sunset, symbolizing renewable energy. A superimposed financial chart illustrates upward trends, suggesting positive investment and economic progress in the green energy sector. The image combines environmental consciousness with business concepts, ideal for illustrating investment, sustainability, and future-oriented themes.
Free with trial A 3D illustration of a statistic down icon isolated on a white background symbolizing decline in data or business performance. Decrease business graph illustrations Statistic down 3D illustration. A 3D illustration of a statistic down icon isolated on a white background symbolizing decline in data or business performance
Free with trial A 3D illustration of a statistic down icon isolated on a white background symbolizing decline in data or business performance. Decrease business graph illustrations Statistic down 3D illustration. A 3D illustration of a statistic down icon isolated on a white background symbolizing decline in data or business performance
Free with trial A striking 3D rendering depicts a bold red downward trend arrow overlaid on a subtle grid, immediately conveying a sense of decline and loss. Set against a pristine white background, the graphic powerfully symbolizes financial instability, market downturns, and the potential for recession. This illustration is ideal for conveying concepts of investment risk, negative business trends, and economic. Decrease business graph illustrations Red downward trend arrow and grid symbolizing decline or recession on white background. A striking 3D rendering depicts a bold red downward trend arrow overlaid on a subtle grid, immediately conveying a sense of decline and loss. Set against a pristine white background, the graphic powerfully symbolizes financial instability, market downturns, and the potential for recession. This illustration is ideal for conveying concepts of investment risk, negative business trends, and economic
Free with trial A hand-drawn red graph on a whiteboard shows a sharp downward trend, signifying a decline. This visual representation, generated by AI, is perfect for illustrating negative growth, market crashes, or economic downturns. The image is clean and easily understandable, ideal for presentations and repor. Decrease business graph illustrations Declining Trend on Whiteboard. A hand-drawn red graph on a whiteboard shows a sharp downward trend, signifying a decline. This visual representation, generated by AI, is perfect for illustrating negative growth, market crashes, or economic downturns. The image is clean and easily understandable, ideal for presentations and repor
Free with trial A magnifying glass focuses on a vibrant bar graph, symbolizing financial growth and investment opportunities. Stacks of gold coins rest on a financial report, enhancing the visual representation of wealth and prosperity. This 3D rendering, generated by AI, is ideal for illustrating financial concep. Decrease business graph illustrations Financial Growth Analysis. A magnifying glass focuses on a vibrant bar graph, symbolizing financial growth and investment opportunities. Stacks of gold coins rest on a financial report, enhancing the visual representation of wealth and prosperity. This 3D rendering, generated by AI, is ideal for illustrating financial concep
Free with trial Set Safe Global economic crisis Stop delivery cargo truck Employee dismissal Pie chart infographic Dollar rate decrease and icon. Vector. Decrease business graph illustrations Set Safe, Global economic crisis, Stop delivery cargo truck, Employee dismissal, Pie chart infographic, Dollar rate. Set Safe Global economic crisis Stop delivery cargo truck Employee dismissal Pie chart infographic Dollar rate decrease and icon. Vector.
Free with trial Hand drawing a down arrow over a decreasing bar chart on a green chalkboard. Decrease business graph illustrations Hand drawing declining bar graph on blackboard. Hand drawing a down arrow over a decreasing bar chart on a green chalkboard
Free with trial This image depicts a computer screen displaying a sharply declining stock market graph, generated by AI. The red line dramatically illustrates a significant market downturn, accompanied by numerous data points and financial indicators. The dark aesthetic enhances the sense of urgency and potential. Decrease business graph illustrations AI-Generated Stock Market Decline. This image depicts a computer screen displaying a sharply declining stock market graph, generated by AI. The red line dramatically illustrates a significant market downturn, accompanied by numerous data points and financial indicators. The dark aesthetic enhances the sense of urgency and potential
Free with trial Financial business concept going bankrupt flat vector design. design vector illustration. Decrease business graph vectors Flat design bankruptcy concept. financial business concept going bankrupt flat vector design.design vector illustration
Free with trial A striking 3D render features a bold red arrow, sharply angled downwards, positioned on a textured wooden surface. The arrow's zigzag path suggests a dynamic decline, making it a powerful visual metaphor for financial downturns, market crashes, or negative trends. The warm tones of the wood contrast with the vibrant red, creating a visually engaging composition. This image is ideal for illustrating concepts related to economic recession, business failure, loss, or any situation involving a downward trajectory. Decrease business graph illustrations Red Arrow Pointing Downward on Wooden Background. A striking 3D render features a bold red arrow, sharply angled downwards, positioned on a textured wooden surface. The arrow's zigzag path suggests a dynamic decline, making it a powerful visual metaphor for financial downturns, market crashes, or negative trends. The warm tones of the wood contrast with the vibrant red, creating a visually engaging composition. This image is ideal for illustrating concepts related to economic recession, business failure, loss, or any situation involving a downward trajectory.
Free with trial Red line graph shows a sharp stock market decline. Economic downturn visualized. Decrease business graph illustrations Stock Market Decline: A Visual Representation of Economic Downturn. Red line graph shows a sharp stock market decline. Economic downturn visualized
Free with trial Percent arrows up and down icon set. Income and cost increase and decrease arrow icons. Decrease business graph vectors Percent arrows up and down icon set
Free with trial A stack of coins rests on a financial chart showing a downward trend. This image, generated by AI, visually represents economic fluctuations and market instability. The dark coins emphasize the seriousness of the financial situation depicted by the graph. Decrease business graph illustrations Financial Market Trends. A stack of coins rests on a financial chart showing a downward trend. This image, generated by AI, visually represents economic fluctuations and market instability. The dark coins emphasize the seriousness of the financial situation depicted by the graph.
Free with trial A minimalist, black and white vector icon representing a bar chart or graph. The icon features a series of vertical bars of varying heights, set against a base of horizontal lines. This clean and modern design is ideal for representing data, statistics, progress, growth, or financial information in digital and print media. Its simple aesthetic makes it versatile for use in presentations, websites, apps, and infographics. Decrease business graph vectors Abstract Bar Chart Icon. A minimalist, black and white vector icon representing a bar chart or graph. The icon features a series of vertical bars of varying heights, set against a base of horizontal lines. This clean and modern design is ideal for representing data, statistics, progress, growth, or financial information in digital and print media. Its simple aesthetic makes it versatile for use in presentations, websites, apps, and infographics.
Free with trial This vibrant image depicts a stock market graph, generated by AI, showcasing a dramatic decline. The fiery red and orange hues emphasize the volatility and potential losses. The futuristic cityscape backdrop adds a layer of technological complexity, suggesting the interconnectedness of global fina. Decrease business graph illustrations AI-Generated Stock Market Decline. This vibrant image depicts a stock market graph, generated by AI, showcasing a dramatic decline. The fiery red and orange hues emphasize the volatility and potential losses. The futuristic cityscape backdrop adds a layer of technological complexity, suggesting the interconnectedness of global fina
Free with trial This isometric illustration shows a delicious breakfast plate alongside a stock market graph, representing the connection between food trends and market data. The visual, generated by AI, is perfect for illustrating articles about food market analysis or investment opportunities in the food industr. Decrease business graph illustrations Breakfast Market Trends. This isometric illustration shows a delicious breakfast plate alongside a stock market graph, representing the connection between food trends and market data. The visual, generated by AI, is perfect for illustrating articles about food market analysis or investment opportunities in the food industr
Free with trial A cartoon illustration of a man interacting with a bar chart. The man is depicted in a simple, clean style, wearing a blue shirt and brown pants. He is holding a green bar, seemingly adjusting or interacting with the colorful bars displayed on a table. The illustration is suitable for conveying concepts related to data analysis, business, finance, and presentation. Decrease business graph illustrations Cartoon Man and Bar Chart. A cartoon illustration of a man interacting with a bar chart. The man is depicted in a simple, clean style, wearing a blue shirt and brown pants. He is holding a green bar, seemingly adjusting or interacting with the colorful bars displayed on a table. The illustration is suitable for conveying concepts related to data analysis, business, finance, and presentation.
Free with trial Description: Simple line art illustration of a scatter plot graph showing an uneven distribution of data points. Perfect for presentations or reports. Decrease business graph vectors Abstract Data Visualization: Scatter Plot Chart with Irregular Data Points. Description: Simple line art illustration of a scatter plot graph showing an uneven distribution of data points. Perfect for presentations or reports.
Free with trial Global economic downturn sketch falling arrows, documents around Earth business illustration. Decrease business graph illustrations Global Economy Sketch - World Globe with Growth and Decline Arrows. Global economic downturn sketch falling arrows, documents around Earth business illustration
Free with trial Stylized digital illustration showing a virtual coin with a declining market chart in the background. this image symbolizes financial risks, price fluctuations, and market volatility in the electronic currency sector. Decrease business graph vectors Digital illustration of a virtual currency coin with a falling market graph representing financial price volatility. stylized digital illustration showing a virtual coin with a declining market chart in the background. this image symbolizes financial risks, price fluctuations, and market volatility in the electronic currency sector
Free with trial Circular bar chart with red upward arrow and dark gray downward arrow icon for growth and analytics featuring improvement, decrease, trend with. Decrease business graph vectors Circular bar chart with red upward arrow and dark gray downward arrow icon for growth
Free with trial Conceptual image depicting real estate market analysis. A magnifying glass focuses on a brightly lit house model, surrounded by other house models and a rising graph, all set on a reflective surface. The scene suggests research, investment, and growth in the housing market. Ideal for illustrating articles or presentations on real estate trends, property valuation, and housing market forecasts. Decrease business graph illustrations Real Estate Market Analysis
Free with trial A set of black icons representing percentage changes, including arrows and circular symbols. The icons depict various concepts such as decrease, increase, and rotation, all incorporating percentage signs. The simple design makes them versatile for use in financial, statistical, or educational materials. Decrease business graph illustrations Black percentage icons set. A set of black icons representing percentage changes, including arrows and circular symbols. The icons depict various concepts such as decrease, increase, and rotation, all incorporating percentage signs. The simple design makes them versatile for use in financial, statistical, or educational materials.
Free with trial Abstract 3D render of a descending bar chart made of blue glass rectangles. The bars are reflected on a glossy surface, creating a clean and modern aesthetic. The image can be used to represent data visualization, financial trends, business performance, or concepts like decline, recession, or negative growth. The cool blue color palette adds a sense of calm and professionalism. Decrease business graph illustrations Abstract Blue Glass Bar Chart. Abstract 3D render of a descending bar chart made of blue glass rectangles. The bars are reflected on a glossy surface, creating a clean and modern aesthetic. The image can be used to represent data visualization, financial trends, business performance, or concepts like decline, recession, or negative growth. The cool blue color palette adds a sense of calm and professionalism.
Free with trial This image showcases a dynamic graph, generated by AI, illustrating fluctuating data patterns. The abstract, wave-like design creates a visually engaging representation of complex information, perfect for presentations or reports needing a modern aesthetic. Its cool blue tones evoke a sense of calm. Decrease business graph illustrations Abstract Data Visualization. This image showcases a dynamic graph, generated by AI, illustrating fluctuating data patterns. The abstract, wave-like design creates a visually engaging representation of complex information, perfect for presentations or reports needing a modern aesthetic. Its cool blue tones evoke a sense of calm
Free with trial An upward trending bar graph displayed on a laptop screen, illuminated against a backdrop of blurred city lights at night. Shows financial success and progress. Decrease business graph illustrations Financial Growth Chart on Laptop Screen at Night. An upward trending bar graph displayed on a laptop screen, illuminated against a backdrop of blurred city lights at night. Shows financial success and progress.
Free with trial A graph showing a downward trend on a grid background. 3D Rendering. Decrease business graph illustrations Declining stock market trend illustration. 3D Rendering. A graph showing a downward trend on a grid background. 3D Rendering
Free with trial Chart icon with descending bar graph, gear with cross, and downward arrow with dollar symbol, minimal black silhouette for finance loss and cost reduction concept. Decrease business graph vectors Chart icon with descending bar graph, gear with cross, and downward arrow with dollar symbol
Free with trial A glossy red arrow curves downwards, symbolizing a decrease or downward trend, isolated on a clean white background. Decrease business graph illustrations A glossy red arrow curves downwards indicating a decline or fall isolated on white background. A glossy red arrow curves downwards, symbolizing a decrease or downward trend, isolated on a clean white background
Free with trial A 3D rendered red arrow sign pointing downwards, mounted on a black circular base. The image is set against a plain white background, highlighting the contrast between the red arrow and the dark base. This image can be used to represent decline, decrease, or downward trend in various contexts such as finance, statistics, or presentations. Decrease business graph illustrations Red Arrow Sign on Black Base. A 3D rendered red arrow sign pointing downwards, mounted on a black circular base. The image is set against a plain white background, highlighting the contrast between the red arrow and the dark base. This image can be used to represent decline, decrease, or downward trend in various contexts such as finance, statistics, or presentations.
Free with trial Abstract illustration of a downward trending arrow chart. The arrows are depicted in varying shades of blue and green, suggesting a gradual decline. This image can be used to represent concepts such as loss, decrease, negative growth, or a downward trend in various fields like finance, sales, or performance metrics. The clean background and simple design make it versatile for presentations, reports, and infographics. Decrease business graph illustrations Decreasing Trend Arrow Chart. Abstract illustration of a downward trending arrow chart. The arrows are depicted in varying shades of blue and green, suggesting a gradual decline. This image can be used to represent concepts such as loss, decrease, negative growth, or a downward trend in various fields like finance, sales, or performance metrics. The clean background and simple design make it versatile for presentations, reports, and infographics.
Free with trial Digital red graph with falling stock price on large screen in bright corporate office, concept of financial crisis and economic collapse, 3D Rendering. Decrease business graph illustrations Red downward financial chart on screen in modern office showing market crash, economic recession, and global investment crisis. Digital red graph with falling stock price on large screen in bright corporate office, concept of financial crisis and economic collapse, 3D Rendering
Free with trial Digital red graph with falling stock price on large screen in bright corporate office, concept of financial crisis and economic collapse, 3D Rendering. Decrease business graph illustrations Red downward financial chart on screen in modern office showing market crash, economic recession, and global investment crisis. Digital red graph with falling stock price on large screen in bright corporate office, concept of financial crisis and economic collapse, 3D Rendering
Free with trial A modern, clean isometric illustration showcasing various data visualizations. Multiple charts and graphs, including bar charts, line graphs, and pie charts, are displayed on floating screens, representing data analysis, business intelligence, or financial reporting. Ideal for presentations, reports, or website banners related to data-driven concepts. Decrease business graph illustrations Isometric 3D Data Visualization: Charts and Graphs on Floating Screens. A modern, clean isometric illustration showcasing various data visualizations. Multiple charts and graphs, including bar charts, line graphs, and pie charts, are displayed on floating screens, representing data analysis, business intelligence, or financial reporting. Ideal for presentations, reports, or website banners related to data-driven concepts.
Free with trial A 3D bar chart shows a downward trend with a prominent red arrow indicating a significant decrease in value. Decrease business graph illustrations Red arrow graph showing steep decline in bar chart data. A 3D bar chart shows a downward trend with a prominent red arrow indicating a significant decrease in value
Free with trial Hand drawing a decreasing bar graph with chalk on a dark chalkboard. Decrease business graph illustrations Hand drawing declining bar chart on blackboard. Hand drawing a decreasing bar graph with chalk on a dark chalkboard
Free with trial Bench vise clamp press coins for control cost reduction with white wall background on wooden table. Concept of cost reduction, cost cut in business or production, optimize continuous improvement. Decrease business graph illustrations Bench vise clamp press coins for control cost reduction with white wall background on wooden table.
Free with trial This image depicts a financial downturn concept, featuring a candlestick chart with downward-pointing arrows. The dark blue background emphasizes the negative trend and market decline. Perfect for illustrating financial reports, economic analysis, or business presentations about market volatility and investment risks. Decrease business graph illustrations Financial Downturn Concept Stock Market Crash with Arrows and Candles on Dark Blue Background. This image depicts a financial downturn concept, featuring a candlestick chart with downward-pointing arrows. The dark blue background emphasizes the negative trend and market decline. Perfect for illustrating financial reports, economic analysis, or business presentations about market volatility and investment risks.
Free with trial An abstract image featuring four cylindrical shapes of varying heights, arranged in a descending order. The cylinders are dark, with the tops illuminated by a warm, golden light. The background gradients from a warm orange to a darker brown, creating a sense of depth and mystery. This image conveys concepts of decline, progress, or stages, and can be used to represent business trends, data visualization, or abstract concepts. Decrease business graph illustrations Abstract Cylinders in Dim Light. An abstract image featuring four cylindrical shapes of varying heights, arranged in a descending order. The cylinders are dark, with the tops illuminated by a warm, golden light. The background gradients from a warm orange to a darker brown, creating a sense of depth and mystery. This image conveys concepts of decline, progress, or stages, and can be used to represent business trends, data visualization, or abstract concepts.