Free with trial A 3D rendered image featuring two arrows pointing downwards on a white background. A bold red arrow descends sharply, while a thinner blue arrow follows a slightly different path. A small red ring is depicted at the point where the red arrow touches the surface, suggesting a low point or impact. This visual represents a concept of decline or loss. Decrease business graph illustrations Red and Blue Arrows Pointing Downward on White Background Representing Decline Keywords: arrow, down, decline, decrease, loss, red. A 3D rendered image featuring two arrows pointing downwards on a white background. A bold red arrow descends sharply, while a thinner blue arrow follows a slightly different path. A small red ring is depicted at the point where the red arrow touches the surface, suggesting a low point or impact. This visual represents a concept of decline or loss
Free with trial Realistic financial graphs index number analysis business investment market economy and trading concept. Generative AI glowing lines and diagram on digital screen charts crypto data blur light line. Decrease business graph illustrations Trading market financial graphs and glowing lines diagram on digital neural network AI generated art. Realistic financial graphs index number analysis business investment market economy and trading concept. Generative AI glowing lines and diagram on digital screen charts crypto data blur light line
Free with trial Realistic financial graphs index number analysis business investment market economy and trading concept. Generative AI glowing lines and diagram on digital screen charts crypto data blur light line. Decrease business graph illustrations Trading market financial graphs and glowing lines diagram on digital neural network AI generated art. Realistic financial graphs index number analysis business investment market economy and trading concept. Generative AI glowing lines and diagram on digital screen charts crypto data blur light line
Free with trial A dynamic image showcasing digital financial data and fluctuating stock market graphs. the red lines suggest market volatility, providing a powerful visual for economic analysis, investment strategies, or financial presentations. Generative AI. Decrease business graph illustrations Stock Market Volatility Concept with Digital Financial Data and Graph Displays for Economic Analysis Generative AI. A dynamic image showcasing digital financial data and fluctuating stock market graphs. the red lines suggest market volatility, providing a powerful visual for economic analysis, investment strategies, or financial presentations. Generative AI
Free with trial Set line Global economic crisis Mobile stock trading Dollar rate decrease Shutdown of factory Safe Drop crude oil price and Calculation expenses icon. Vector. Decrease business graph vectors Set line Global economic crisis, Mobile stock trading, Dollar rate decrease, Shutdown of factory, Safe, Drop crude oil. Set line Global economic crisis Mobile stock trading Dollar rate decrease Shutdown of factory Safe Drop crude oil price and Calculation expenses icon. Vector.
Free with trial Set Global economic crisis Drop in crude oil price Dollar rate decrease Employee dismissal Hanging sign with Sale and Gold bars icon. Vector. Decrease business graph illustrations Set Global economic crisis, Drop in crude oil price, Dollar rate decrease, Employee dismissal, Hanging sign with Sale. Set Global economic crisis Drop in crude oil price Dollar rate decrease Employee dismissal Hanging sign with Sale and Gold bars icon. Vector.
Free with trial Set Drop in crude oil price Global economic crisis Gold bars Dollar rate decrease Shutdown of factory Prison cell door and Money bag icon. Vector. Decrease business graph illustrations Set Drop in crude oil price, Global economic crisis, Gold bars, Dollar rate decrease, Shutdown of factory, Prison cell. Set Drop in crude oil price Global economic crisis Gold bars Dollar rate decrease Shutdown of factory Prison cell door and Money bag icon. Vector.
Free with trial Set of linear graphs with red and blue lines showing different trends and dynamics vector illustration. Change in time of election results or income. For business analytics, financial reports. Decrease business graph vectors Set of linear graphs with red and blue lines showing different trends and dynamics vector illustration. Change in time of election
Free with trial Set line Cloud computing lock Pie chart infographic Financial growth Search with folder Document and decrease icon. Vector. Decrease business graph illustrations Set line Cloud computing lock, Pie chart infographic, Financial growth, Search with folder, Document and decrease icon
Free with trial Set Fire in burning house Broken piggy bank Pie chart infographic Contract money and pen Drop crude oil price Gold bars Dollar rate decrease and icon. Vector. Decrease business graph vectors Set Fire in burning house, Broken piggy bank, Pie chart infographic, Contract money and pen, Drop crude oil price, Gold. Set Fire in burning house Broken piggy bank Pie chart infographic Contract money and pen Drop crude oil price Gold bars Dollar rate decrease and icon. Vector.
Free with trial A vibrant infographic visualizes global consumption trends using circular graphs and colorful gradients This modern data visualization effectively presents worldwide consumption patterns, highlighting key insights for business analysis, market research, and economic reporting Ideal for presentations and publications, its design ensures easy data comprehension AI Generative. Decrease business graph illustrations Abstract Infographic Global Consumption Trends Visualization with Circular Graphs and Colorful Gradients Modern Data Visualization. A vibrant infographic visualizes global consumption trends using circular graphs and colorful gradients This modern data visualization effectively presents worldwide consumption patterns, highlighting key insights for business analysis, market research, and economic reporting Ideal for presentations and publications, its design ensures easy data comprehension AI Generative
Free with trial Sugar cubes pile sits before financial chart screen with market data. Concept of commodity trading, investment in sugar prices. Stock exchange graph shows futures rise, fall. Decrease business graph illustrations Sugar cubes pile sits before financial chart screen with market data. Concept of commodity trading, investment in sugar prices.
Free with trial Set line Shutdown of factory Pie chart infographic Dollar rate decrease Employee dismissal Bank building Drop crude oil price and Tearing money banknote icon. Vector. Decrease business graph vectors Set line Shutdown of factory, Pie chart infographic, Dollar rate decrease, Employee dismissal, Bank building, Drop crude. Set line Shutdown of factory Pie chart infographic Dollar rate decrease Employee dismissal Bank building Drop crude oil price and Tearing money banknote icon. Vector.
Free with trial Uptrend or downtrend set on a dark grey to black minimalist studio background, represented by an upward scrolling white columnar bar chart. 3D render visualizing market trend or challenging business. Decrease business graph illustrations Uptrend or downtrend set on a dark grey to black minimalist studio background, represented by an upward scrolling white columnar
Free with trial Businessman pointing at a digital interface with interactive graphs representing quality and cost, with arrows indicating trends�quality is increasing while cost is decreasing, illustrating a business performance improvement. Decrease business graph illustrations Businessman interacting with digital interface showing quality and cost graphs with arrows pointing up and down. businessman pointing at a digital interface with interactive graphs representing quality and cost, with arrows indicating trends�quality is increasing while cost is decreasing, illustrating a business performance improvement
Free with trial This compelling data visualization showcases a clear downward trend, perfect for illustrating declining performance, market share, or other metrics. The dark background provides a striking contrast to the graph's lines, emphasizing the trend's trajectory. The visual clarity makes it an excellent tool for conveying complex information effectively, whether for internal reports, presentations to. Decrease business graph illustrations Visualizing Declining Trends A Dark Night Graph Depicts a Downward Trajectory in Data Ideal for Reports Presentations. This compelling data visualization showcases a clear downward trend, perfect for illustrating declining performance, market share, or other metrics. The dark background provides a striking contrast to the graph's lines, emphasizing the trend's trajectory. The visual clarity makes it an excellent tool for conveying complex information effectively, whether for internal reports, presentations to
Free with trial A set of line art icons illustrating financial growth, investment strategies, and market analysis, perfect for business presentations and reports with clean design. Decrease business graph vectors Vector art of line art icons depicting financial growth, investment strategies, and market analysis, ideal for illustrating. A set of line art icons illustrating financial growth, investment strategies, and market analysis, perfect for business presentations and reports with clean design
Free with trial Set line Drop in crude oil price, Dollar rate decrease, Pie chart infographic and Prison cell door on seamless pattern. Vector. Decrease business graph vectors Set line Drop in crude oil price, Dollar rate decrease, Pie chart infographic and Prison cell door on seamless pattern
Free with trial Vibrant red line indicates financial market decline on digital display. Chart shows stock market loss, economy decay, investment risk. Red graph pattern represents trading volatility. Decrease business graph illustrations Vibrant red line indicates financial market decline on digital display. Chart shows stock market loss, economy decay, investment
Free with trial Red stock chart with values sharply declining, highlighting financial crisis economic recession. Dramatic fall in market values is emphasized against dark background. Business and. Decrease business graph illustrations Red stock chart with values sharply declining, highlighting financial crisis, economic recession. Dramatic fall in market values. Red stock chart with values sharply declining, highlighting financial crisis economic recession. Dramatic fall in market values is emphasized against dark background. Business and.
Free with trial Businessman pointing at a digital interface with interactive graphs showing quality and cost, where quality is increasing and cost is decreasing, representing trends in business performance, set in a professional and modern workspace. Decrease business graph illustrations Businessman interacting with a digital interface showing quality and cost graphs with arrows pointing up and down. businessman pointing at a digital interface with interactive graphs showing quality and cost, where quality is increasing and cost is decreasing, representing trends in business performance, set in a professional and modern workspace
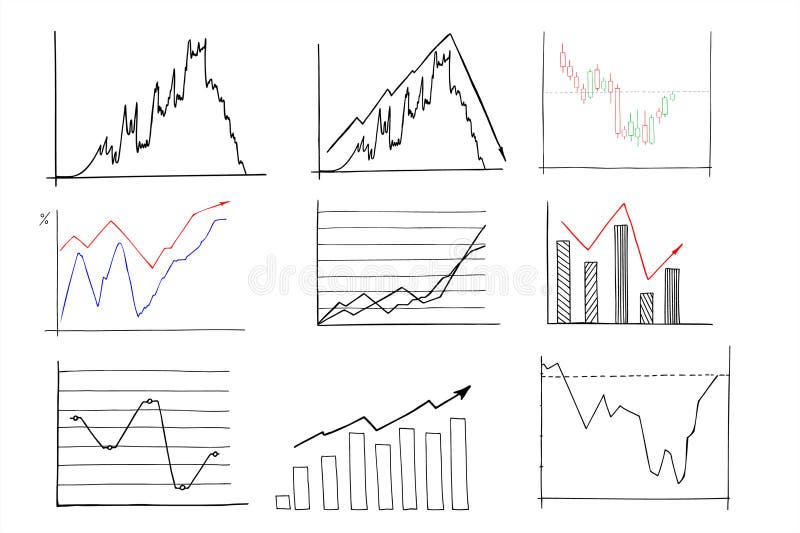
Free with trial Chart line set. Graph, finance report, income growth, economy statistic, diagram, infographic, mind map, data visualization vector illustration. Outline signs of analytic. Editable Stroke. Decrease business graph vectors Analytical graphic chart with trend lines, columns set hand drawn ink sketch. Change in time of election results or income, plans. Chart line set. Graph, finance report, income growth, economy statistic, diagram, infographic, mind map, data visualization vector illustration. Outline signs of analytic. Editable Stroke
Free with trial Colorful 3D bar chart illustration on blue background with red, orange, yellow, turquoise bars. Simple, clean geometric shapes represent statistics, business data for reports. Decrease business graph illustrations Colorful 3D bar chart illustration on blue background with red, orange, yellow, turquoise bars. Simple, clean geometric shapes
Free with trial Climate goal cube, CO2 emissions, sustainable future, strategy. created ai. Decrease business graph illustrations Climate Goal Cube: CO2 Emission Reduction Strategy - Target for Sustainable Future with Decreasing Graph on Wooden Blocks for. Climate goal cube, CO2 emissions, sustainable future, strategy. created ai
Free with trial This impactful image displays the American flag beneath cutouts of a factory, a house, and a downward trend graph, all surrounded by wooden blocks, symbolizing economic challenges. Decrease business graph illustrations Economic indicators show a factory, house, and downward trend on an American flag. This impactful image displays the American flag beneath cutouts of a factory, a house, and a downward trend graph, all surrounded by wooden blocks, symbolizing economic challenges.
Free with trial Golden dollar coins stack and up arrow. Flat vector icon isolated on white. Economy, finance, money symbol. Currency pictogram. Vector illustration. decrease. Decrease business graph vectors Golden dollar coins stack and up arrow. Flat vector icon isolated on white. Economy, finance, money symbol. Currency pictogram.
Free with trial Golden dollar sign with red arrow pointing down. Financial crisis concept, recession chart, stock market crash symbol. Economic downturn, loss, decrease, risk, bad investment money. Decrease business graph illustrations Golden dollar sign with red arrow pointing down. Financial crisis concept, recession chart, stock market crash symbol. Economic
Free with trial Illustration of dejected penguin observing red arrow pointing down on chart, symbolizing financial crisis. Economic downturn concept includes market decrease, trading loss investment. Decrease business graph illustrations Illustration of dejected penguin observing red arrow pointing down on chart, symbolizing financial crisis. Economic downturn
Free with trial Close up view of red falling bar chart with laptop and potted plant in background. It represents financial crisis downturn risk and business failure in market. Investment analytics. Decrease business graph illustrations Close up view of red falling bar chart with laptop and potted plant in background. It represents financial crisis downturn risk
Free with trial Three red arrows pointing down with white percentage symbols signifying a drop in prices or economic decline isolated on transparent background. Decrease business graph vectors Three red downward pointing arrows with percentage symbols indicating a decrease in value or sales isolated on transparent. Three red arrows pointing down with white percentage symbols signifying a drop in prices or economic decline isolated on transparent background
Free with trial Red wooden arrow points downwards on dark background. Image shows economic decline. Graphic represents market crash financial crisis. Photo captures negative trend. Business loss risk. Decrease business graph illustrations Red wooden arrow points downwards on dark background. Image shows economic decline. Graphic represents market crash financial
Free with trial Purple and gray light graph. Motion. A point moving along a graph line that goes up and down in animation. High quality 4k footage. Decrease business graph illustrations Purple and gray light graph. Motion.A point moving along a graph line that goes up and down in animation.
Free with trial Purple and gray light graph. Motion. A point moving along a graph line that goes up and down in animation. High quality 4k footage. Decrease business graph illustrations Purple and gray light graph. Motion.A point moving along a graph line that goes up and down in animation.
Free with trial Purple and gray light graph. Motion. A point moving along a graph line that goes up and down in animation. High quality 4k footage. Decrease business graph illustrations Purple and gray light graph. Motion.A point moving along a graph line that goes up and down in animation.
Free with trial Generative AI : Economic crisis concept shown by declining graphs and digital indicators overlap modernistic city background. Double exposure. business concept. Decrease business graph illustrations Generative AI Economic crisis concept shown by declining graphs and digital indicators overlap modernistic city ba. Generative AI : Economic crisis concept shown by declining graphs and digital indicators overlap modernistic city background. Double exposure. business concept.
Free with trial US economy crisis concept with American flag and red arrow down, stock market crash and financial recession, urgency text on digital graph, USA investment failure and national debt problem visualization. Generative AI. Decrease business graph illustrations US economy crisis concept with American flag and red arrow down stock market crash and financial recession urgency text on. US economy crisis concept with. US economy crisis concept with American flag and red arrow down, stock market crash and financial recession, urgency text on digital graph, USA investment failure and national debt problem visualization. Generative AI
Free with trial Generative AI : Economic crisis concept shown by declining graphs and digital indicators overlap modernistic city background. Double exposure. business concept. Decrease business graph illustrations Generative AI Economic crisis concept shown by declining graphs and digital indicators overlap modernistic city ba. Generative AI : Economic crisis concept shown by declining graphs and digital indicators overlap modernistic city background. Double exposure. business concept.
Free with trial Global inflation trends shown on digital screen world map. Macroeconomic research paper presents finance economy data analysis. Study report shows online statistic, monitoring graph of. Decrease business graph illustrations Global inflation trends shown on digital screen world map. Macroeconomic research paper presents finance economy data analysis.
Free with trial Red arrow going down stock icon on white background. Bankruptcy, financial market crash icon for your web site design, logo, app, UI. graph chart down trend symbol. chart going down sign. Decrease business graph vectors Red arrow going down stock icon on white background. Bankruptcy, financial market crash icon for your web site design
Free with trial Red arrow going down stock icon on white background. Bankruptcy, financial market crash icon for your web site design, logo, app, UI. graph chart down trend symbol. chart going down sign. Decrease business graph vectors Red arrow going down stock icon on white background. Bankruptcy, financial market crash icon for your web site design
Free with trial Red wooden arrow points downwards on black background. Image suggests market decline economic crisis. Closeup view shows details of arrow. Potential themes include business loss. Decrease business graph illustrations Red wooden arrow points downwards on black background. Image suggests market decline economic crisis. Closeup view shows details
Free with trial Simple black arrow points down on plain white background. Minimalist design suggests direction. Illustration suitable for graphic design projects, business presentations tech. Decrease business graph illustrations Simple black arrow points down on plain white background. Minimalist design suggests direction. Illustration suitable for graphic
Free with trial Multiple US dollar bills falling down like rain near a tattered American flag over a black background. A red downward trending stock market graph line shows economic instability, market decline. Generative Ai. Decrease business graph illustrations Multiple US dollar bills falling down like rain near a tattered American flag over a black background. A red downward trending
Free with trial Red 3d arrow going down stock icon on white background. Bankruptcy, financial market crash icon for your web site design, logo, app, UI. graph chart downtrend symbol. chart going down sign. Decrease business graph vectors Red 3d arrow going down stock icon on white background. Bankruptcy, financial market crash icon for your web site design. Red 3d arrow going down stock icon on white background. Bankruptcy, financial market crash icon for your web site design, logo, app, UI. graph chart downtrend symbol.chart going down sign.
Free with trial This image features red and green arrows pointing downwards, symbolizing a decline or negative trend in markets, finance, or business. It represents loss and reduction. Decrease business graph vectors Vector art of a visual representation of downward trends with red and green arrows indicating decline isolated on white background. This image features red and green arrows pointing downwards, symbolizing a decline or negative trend in markets, finance, or business. It represents loss and reduction
Free with trial A vibrant depiction of the American flag overlaid with financial graphs, conveying economic activity and market fluctuations. The colors are bold and dynamic, reflecting financial markets' volatile nature and patriotic symbolism. Decrease business graph illustrations American flag merged with fluctuating financial graph, symbolizing economic trends and stock market dynamics. A vibrant depiction of the American flag overlaid with financial graphs, conveying economic activity and market fluctuations. The colors are bold and dynamic, reflecting financial markets' volatile nature and patriotic symbolism.
Free with trial A businessman in a suit holds a bar chart showing quality increasing and cost decreasing, with golden sparkles. Decrease business graph illustrations Businessman Holding Upward Trending Bar Chart Showing Quality Increase and Cost Decrease with Golden Sparkles Modern technology. A businessman in a suit holds a bar chart showing quality increasing and cost decreasing, with golden sparkles
Free with trial Red 3d arrow going down stock icon on white background. Bankruptcy, financial market crash icon for your web site design, logo, app, UI. graph chart downtrend symbol. chart going down sign. Decrease business graph vectors Red 3d arrow going down stock icon on white background. Bankruptcy, financial market crash icon for your web site design. Red 3d arrow going down stock icon on white background. Bankruptcy, financial market crash icon for your web site design, logo, app, UI. graph chart downtrend symbol.chart going down sign.
Free with trial Red 3d arrow going down stock icon on white background. Bankruptcy, financial market crash icon for your web site design, logo, app, UI. graph chart downtrend symbol. chart going down sign. Decrease business graph vectors Red 3d arrow going down stock icon on white background. Bankruptcy, financial market crash icon for your web site design
Free with trial Red 3d arrow going down stock icon on white background. Bankruptcy, financial market crash icon for your web site design, logo, app, UI. graph chart downtrend symbol. chart going down sign. Decrease business graph vectors Red 3d arrow going down stock icon on white background. Bankruptcy, financial market crash icon for your web site design. Red 3d arrow going down stock icon on white background. Bankruptcy, financial market crash icon for your web site design, logo, app, UI. graph chart downtrend symbol.chart going down sign.
Free with trial Red 3d arrow going down stock icon on white background. Bankruptcy, financial market crash icon for your web site design, logo, app, UI. graph chart downtrend symbol. chart going down sign. Decrease business graph vectors Red 3d arrow going down stock icon on white background. Bankruptcy, financial market crash icon for your web site design. Red 3d arrow going down stock icon on white background. Bankruptcy, financial market crash icon for your web site design, logo, app, UI. graph chart downtrend symbol.chart going down sign.
Free with trial Golden bitcoin coins stack and up arrow. Flat vector icon isolated on white. Economy, finance, money symbol. Currency pictogram. Vector illustration. decrease. Decrease business graph vectors Golden bitcoin coins stack and up arrow. Flat vector icon isolated on white. Economy, finance, money symbol. Currency pictogram.
Free with trial Golden bitcoin coins stack and up arrow. Flat vector icon isolated on white. Economy, finance, money symbol. Currency pictogram. Vector illustration. decrease. Decrease business graph vectors Golden bitcoin coins stack and up arrow. Flat vector icon isolated on white. Economy, finance, money symbol. Currency pictogram.
Free with trial Realistic financial graphs index number analysis business investment market economy and trading concept. Generative AI glowing lines and diagram on digital screen charts crypto data blur light line. Decrease business graph illustrations Trading market financial graphs and glowing lines diagram on digital neural network AI generated art. Realistic financial graphs index number analysis business investment market economy and trading concept. Generative AI glowing lines and diagram on digital screen charts crypto data blur light line
Free with trial Realistic financial graphs index number analysis business investment market economy and trading concept. Generative AI glowing lines and diagram on digital screen charts crypto data blur light line. Decrease business graph illustrations Trading market financial graphs and glowing lines diagram on digital neural network AI generated art. Realistic financial graphs index number analysis business investment market economy and trading concept. Generative AI glowing lines and diagram on digital screen charts crypto data blur light line
Free with trial Realistic financial graphs index number analysis business investment market economy and trading concept. Generative AI glowing lines and diagram on digital screen charts crypto data blur light line. Decrease business graph illustrations Trading market financial graphs and glowing lines diagram on digital neural network AI generated art. Realistic financial graphs index number analysis business investment market economy and trading concept. Generative AI glowing lines and diagram on digital screen charts crypto data blur light line
Free with trial Realistic financial graphs index number analysis business investment market economy and trading concept. Generative AI glowing lines and diagram on digital screen charts crypto data blur light line. Decrease business graph illustrations Trading market financial graphs and glowing lines diagram on digital neural network AI generated art. Realistic financial graphs index number analysis business investment market economy and trading concept. Generative AI glowing lines and diagram on digital screen charts crypto data blur light line
Free with trial Realistic financial graphs index number analysis business investment market economy and trading concept. Generative AI glowing lines and diagram on digital screen charts crypto data blur light line. Decrease business graph illustrations Trading market financial graphs and glowing lines diagram on digital neural network AI generated art. Realistic financial graphs index number analysis business investment market economy and trading concept. Generative AI glowing lines and diagram on digital screen charts crypto data blur light line
Free with trial Realistic financial graphs index number analysis business investment market economy and trading concept. Generative AI glowing lines and diagram on digital screen charts crypto data blur light line. Decrease business graph illustrations Trading market financial graphs and glowing lines diagram on digital neural network AI generated art. Realistic financial graphs index number analysis business investment market economy and trading concept. Generative AI glowing lines and diagram on digital screen charts crypto data blur light line
Free with trial Set line Drop in crude oil price Stop delivery cargo truck and Dollar rate decrease icon. Vector. Decrease business graph vectors Set line Drop in crude oil price, Stop delivery cargo truck and Dollar rate decrease icon. Vector
Free with trial European Union Flag with Decreasing Stock Market Graph. Decrease business graph illustrations European Union Flag with Decreasing Stock Market
Free with trial Red arrow pointing downward on a financial spreadsheet, magnifying glass focusing on economic decline. Concept for recession, market crash, business loss, and negative financial trends. Decrease business graph illustrations Red arrow pointing downward on a financial spreadsheet, magnifying glass focusing on economic decline.
Free with trial Red arrow pointing downward on a financial spreadsheet, magnifying glass focusing on economic decline. Concept for recession, market crash, business loss, and negative financial trends. Decrease business graph illustrations Red arrow pointing downward on a financial spreadsheet, magnifying glass focusing on economic decline.
Free with trial Red arrow pointing downward on a financial spreadsheet, magnifying glass focusing on economic decline. Concept for recession, market crash, business loss, and negative financial trends. Decrease business graph illustrations Red arrow pointing downward on a financial spreadsheet, magnifying glass focusing on economic decline.
Free with trial Red arrow pointing downward on a financial spreadsheet, magnifying glass focusing on economic decline. Concept for recession, market crash, business loss, and negative financial trends. Decrease business graph illustrations Red arrow pointing downward on a financial spreadsheet, magnifying glass focusing on economic decline.
Free with trial Red arrow pointing downward on a financial spreadsheet, magnifying glass focusing on economic decline. Concept for recession, market crash, business loss, and negative financial trends. Decrease business graph illustrations Red arrow pointing downward on a financial spreadsheet, magnifying glass focusing on economic decline.
Free with trial Red arrow pointing downward on a financial spreadsheet, magnifying glass focusing on economic decline. Concept for recession, market crash, business loss, and negative financial trends. Decrease business graph illustrations Red arrow pointing downward on a financial spreadsheet, magnifying glass focusing on economic decline.
Free with trial Red arrow pointing downward on a financial spreadsheet, magnifying glass focusing on economic decline. Concept for recession, market crash, business loss, and negative financial trends. Decrease business graph illustrations Red arrow pointing downward on a financial spreadsheet, magnifying glass focusing on economic decline.
Free with trial Red arrow pointing downward on a financial spreadsheet, magnifying glass focusing on economic decline. Concept for recession, market crash, business loss, and negative financial trends. Decrease business graph illustrations Red arrow pointing downward on a financial spreadsheet, magnifying glass focusing on economic decline.
Free with trial Red arrow pointing downward on a financial spreadsheet, magnifying glass focusing on economic decline. Concept for recession, market crash, business loss, and negative financial trends. Decrease business graph illustrations Red arrow pointing downward on a financial spreadsheet, magnifying glass focusing on economic decline.
Free with trial Red arrow pointing downward on a financial spreadsheet, magnifying glass focusing on economic decline. Concept for recession, market crash, business loss, and negative financial trends. Decrease business graph illustrations Red arrow pointing downward on a financial spreadsheet, magnifying glass focusing on economic decline.
Free with trial A stylized image depicting the depreciation of the Japanese Yen. A glowing red downward trending graph with the word 'DEPRECIATION' and the yen symbol is overlaid on a blurred Japanese flag in the background. The image conveys a sense of economic downturn and financial crisis in Japan. Decrease business graph illustrations Japanese Yen Depreciation Chart. A stylized image depicting the depreciation of the Japanese Yen. A glowing red downward trending graph with the word 'DEPRECIATION' and the yen symbol is overlaid on a blurred Japanese flag in the background. The image conveys a sense of economic downturn and financial crisis in Japan.
Free with trial Reduction chart icon isolated on white background. Eps 10. Decrease business graph vectors Reduction Chart Icon Set. Downward graph vector symbol in a black filled and outlined style. Decline Trend Sign. Reduction chart icon isolated on white background. Eps 10
Free with trial Charts and diagrams icon collection. Duotone color. Vector illustration. Containing graphic, infographic, graph, pie chart, graphs, bar chart, circular diagram, diagram, decrease, increase, with three design. Decrease business graph vectors Economics strategy, analysis of sales, statistic, data statistic illustration set or collection for banner, landing web page. Charts and diagrams icon collection. Duotone color. Vector illustration. Containing graphic, infographic, graph, pie chart, graphs, bar chart, circular diagram, diagram, decrease, increase, with three design
Free with trial Charts and diagrams icon collection. Duotone color. Vector illustration. Containing graphic, infographic, graph, pie chart, graphs, bar chart, circular diagram, diagram, decrease, increase, with three design. Decrease business graph vectors Economics strategy, analysis of sales, statistic, data statistic illustration set or collection for banner, landing web page. Charts and diagrams icon collection. Duotone color. Vector illustration. Containing graphic, infographic, graph, pie chart, graphs, bar chart, circular diagram, diagram, decrease, increase, with three design
Free with trial Charts and diagrams icon collection. Duotone color. Vector illustration. Containing graphic, infographic, graph, pie chart, graphs, bar chart, circular diagram, diagram, decrease, increase, with three design. Decrease business graph vectors Economics strategy, analysis of sales, statistic, data statistic illustration set or collection for banner, landing web page. Charts and diagrams icon collection. Duotone color. Vector illustration. Containing graphic, infographic, graph, pie chart, graphs, bar chart, circular diagram, diagram, decrease, increase, with three design
Free with trial Charts and diagrams icon collection. Duotone color. Vector illustration. Containing graphic, infographic, graph, pie chart, graphs, bar chart, circular diagram, diagram, decrease, increase, with three design. Decrease business graph vectors Economics strategy, analysis of sales, statistic, data statistic illustration set or collection for banner, landing web page. Charts and diagrams icon collection. Duotone color. Vector illustration. Containing graphic, infographic, graph, pie chart, graphs, bar chart, circular diagram, diagram, decrease, increase, with three design
Free with trial A businessman analyzes a digital tablet displaying a carbon emission reduction chart, symbolizing environmental sustainability and climate change mitigation. The graph illustrates a downward trend in CO2 emissions, highlighting the importance of environmental protection and sustainable development. This visual representation conveys concepts of clean energy, green technology, and eco-friendly. Decrease business graph illustrations Businessman analyzing carbon emission reduction chart on a digital tablet illustrating environmental sustainability and climate. A businessman analyzes a digital tablet displaying a carbon emission reduction chart, symbolizing environmental sustainability and climate change mitigation. The graph illustrates a downward trend in CO2 emissions, highlighting the importance of environmental protection and sustainable development. This visual representation conveys concepts of clean energy, green technology, and eco-friendly
Free with trial A businessman presents a forward-thinking carbon reduction strategy on a digital screen, illustrating ambitious future goals and environmental sustainability initiatives. The image highlights the importance of reducing emissions and achieving net zero targets. This visual emphasizes the connection between corporate responsibility and protecting our planet. The presentation showcases a graph. Decrease business graph illustrations Businessman presenting a carbon reduction strategy on a digital screen highlighting future goals and environmental sustainability. A businessman presents a forward-thinking carbon reduction strategy on a digital screen, illustrating ambitious future goals and environmental sustainability initiatives. The image highlights the importance of reducing emissions and achieving net zero targets. This visual emphasizes the connection between corporate responsibility and protecting our planet. The presentation showcases a graph
Free with trial A business professional presents carbon emission reduction targets on a tablet screen, emphasizing environmental sustainability initiatives. The image showcases a detailed presentation with clear data visualizations, including graphs and charts, illustrating key strategies for achieving net-zero emissions. This modern illustration highlights the importance of corporate responsibility in combating. Decrease business graph illustrations A businessperson presenting carbon emission reduction targets on a tablet screen with environmental sustainability icons. A business professional presents carbon emission reduction targets on a tablet screen, emphasizing environmental sustainability initiatives. The image showcases a detailed presentation with clear data visualizations, including graphs and charts, illustrating key strategies for achieving net-zero emissions. This modern illustration highlights the importance of corporate responsibility in combating