Free with trial A 3D rendered graphic depicts a bar chart with three vertical bars of varying heights: two blue bars flanking a taller yellow bar. At the top of the yellow bar, a central yellow sphere is connected by white rods to two smaller blue spheres, resembling a molecular structure or a network. The entire graphic is isolated on a white background, suggesting concepts of data analysis, growth, and. Decrease business graph illustrations 3D Rendered Bar Chart with Connecting Spheres Representing Data Analysis graph statistics. A 3D rendered graphic depicts a bar chart with three vertical bars of varying heights: two blue bars flanking a taller yellow bar. At the top of the yellow bar, a central yellow sphere is connected by white rods to two smaller blue spheres, resembling a molecular structure or a network. The entire graphic is isolated on a white background, suggesting concepts of data analysis, growth, and
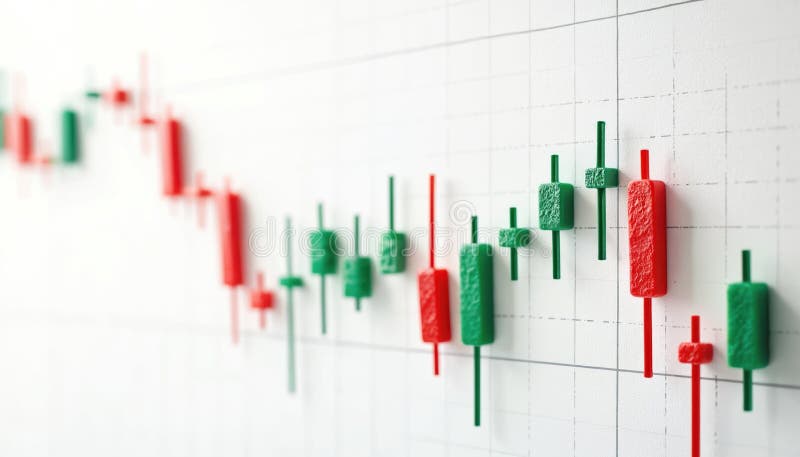
Free with trial Candlestick chart shows stock market fluctuations. Green candles show price increase, red candles pointing price decrease. Financial diagram of investment chart shows up down trends. Decrease business graph illustrations Candlestick chart shows stock market fluctuations. Green candles show price increase, red candles pointing price decrease.
Free with trial Four stacks of Canadian coins, varying in height, are shown with red downward-pointing arrows on their sides. The isolated object on a white background symbolizes a decrease in currency value or economic downturn. created Ai. Decrease business graph illustrations Canadian currency stacks with downward red arrows indicating financial decline isolated on white background. Four stacks of Canadian coins, varying in height, are shown with red downward-pointing arrows on their sides. The isolated object on a white background symbolizes a decrease in currency value or economic downturn. created Ai
Free with trial Three stacks of golden coins are arranged on a white surface. A prominent red arrow, indicating a downward trend, is positioned diagonally above the coins, pointing towards the right. The arrow's sharp angles and vibrant red color convey a sense of financial decline or loss. The coins are depicted in varying heights, with a single coin resting on top of the middle stack. Decrease business graph illustrations Red downward trending graph arrow over stacks of gold coins on a white background finance. Three stacks of golden coins are arranged on a white surface. A prominent red arrow, indicating a downward trend, is positioned diagonally above the coins, pointing towards the right. The arrow's sharp angles and vibrant red color convey a sense of financial decline or loss. The coins are depicted in varying heights, with a single coin resting on top of the middle stack
Free with trial Three stacks of gold coins decrease in height from left to right, with a red arrow pointing downwards across them. Isolated on a transparent background. Decrease business graph vectors Stacks of gold coins with red downward trend arrow isolated on a transparent background money. Three stacks of gold coins decrease in height from left to right, with a red arrow pointing downwards across them. Isolated on a transparent background
Free with trial Colorful growth chart featuring orange and teal bars with upward and downward arrows on a clean white background representing progress decline business data trends and financial performance metrics. Decrease business graph illustrations Colorful growth chart with orange and teal bars and upward and downward arrows on white background. colorful growth chart featuring orange and teal bars with upward and downward arrows on a clean white background representing progress decline business data trends and financial performance metrics
Free with trial Economic Loss icon Flat set in black and white color outline vector. Decrease business graph vectors Economic Loss Icon for Financial Downturns, Business Challenges, and Market Analysis Illustrations. Economic Loss icon Flat set in black and white color outline vector
Free with trial A dramatic downward trending graph illustrates the global economic downturn and financial crisis. Red arrows emphasize the sharp decline in the global market, signifying instability, risk, and uncertainty for businesses and investors. Data visualization of a critical economic prediction, generated by AI. Decrease business graph illustrations Global economic downturn recession financial crisis. A dramatic downward trending graph illustrates the global economic downturn and financial crisis. Red arrows emphasize the sharp decline in the global market, signifying instability, risk, and uncertainty for businesses and investors. Data visualization of a critical economic prediction, generated by AI.
Free with trial Hand-drawn line chart doodle is showing grid backdrop and axis over gradient background, copy space. Data visualization, infographics, analytics, diagram, business, educational, minimalistic. Decrease business graph illustrations Hand-drawn line chart doodle is showing grid backdrop and axis over gradient background, copy space
Free with trial Abstract digital illustration featuring blue and red bar charts and line graphs on a dark blue background. Orange and light blue points highlight data trends. The style is clean and modern. Decrease business graph illustrations Abstract Financial Data Visualization Blue Red Charts Graphs Lines Points finance business. Abstract digital illustration featuring blue and red bar charts and line graphs on a dark blue background. Orange and light blue points highlight data trends. The style is clean and modern
Free with trial Illustration shows a worried businesswoman in front of a falling financial chart with red and green lines depicting economic decline, serious mood. Generative AI. Decrease business graph vectors Businesswoman with declining financial graph showing economic downturn and loss trends vector illustration. Illustration shows a worried businesswoman in front of a falling financial chart with red and green lines depicting economic decline, serious mood. Generative AI
Free with trial A vibrant illustration depicting a piggy bank amidst scattered coins symbolizing a financial crisis The backdrop shows a sharply declining stock market graph highlighting economic downturn and potential investment losses A powerful visual representation of financial instability. Decrease business graph illustrations Piggy Bank Savings Crisis Economic Downturn Falling Stock Market Financial Loss AI generated. A vibrant illustration depicting a piggy bank amidst scattered coins symbolizing a financial crisis The backdrop shows a sharply declining stock market graph highlighting economic downturn and potential investment losses A powerful visual representation of financial instability
Free with trial A vibrant red arrow zigzags downward against a stark white background The arrow's sharp angles create a dynamic visual representation of a negative trend. The image is clean and simple. Decrease business graph illustrations Red Zigzag Arrow Downward Trending Graphic White Background Sharp Angles Decline Decrease Fall. A vibrant red arrow zigzags downward against a stark white background The arrow's sharp angles create a dynamic visual representation of a negative trend. The image is clean and simple
Free with trial A man's hand in a white shirt sleeve is holding a jagged red arrow pointing downward, representing a drop or decline. The arrow appears three-dimensional and zigzags as it moves lower. Set against a clean white background, the image conveys concepts such as financial loss, market crash, business downturn, or economic crisis. Image created with AI. Decrease business graph illustrations Businessman hand holding red descending arrow symbolizing economic decline or financial loss. A man's hand in a white shirt sleeve is holding a jagged red arrow pointing downward, representing a drop or decline. The arrow appears three-dimensional and zigzags as it moves lower. Set against a clean white background, the image conveys concepts such as financial loss, market crash, business downturn, or economic crisis. Image created with AI.
Free with trial A striking graph illustrates opposing trends one line sharply decreases while another rises, enveloped in warm orange hues that evoke energy and transformation. Decrease business graph illustrations Dynamic Trends Displayed Through Contrasting Lines in Shades of Orange With a Vivid Background. A striking graph illustrates opposing trends one line sharply decreases while another rises, enveloped in warm orange hues that evoke energy and transformation
Free with trial This powerful visual concept depicts a devastating financial crisis and economic downturn. Symbolic wooden blocks, including a crumbling bank structure, represent bank failure and the ensuing recession. A cracked block and a falling arrow down highlight the downward trend and potential for loss in the stock market crash. Ideal for illustrating themes of investment risk, debt, finance, business. Decrease business graph illustrations Financial crisis concept illustrating bank failure and economic decline with symbolic blocks. This powerful visual concept depicts a devastating financial crisis and economic downturn. Symbolic wooden blocks, including a crumbling bank structure, represent bank failure and the ensuing recession. A cracked block and a falling arrow down highlight the downward trend and potential for loss in the stock market crash. Ideal for illustrating themes of investment risk, debt, finance, business
Free with trial This graph chart depicts a significant downward trend in the stock market, indicating a period of market decline. The red arrows clearly show the loss in value across various investment instruments. This market downturn highlights the inherent volatility of financial markets and the need for careful financial analysis. Understanding the factors driving this decline, such as economic downturns,. Decrease business graph illustrations Analyzing a Red Downward Trend Chart Stock Market Decline and Potential Investment Strategies. This graph chart depicts a significant downward trend in the stock market, indicating a period of market decline. The red arrows clearly show the loss in value across various investment instruments. This market downturn highlights the inherent volatility of financial markets and the need for careful financial analysis. Understanding the factors driving this decline, such as economic downturns,
Free with trial Stacks of gold coins decrease in height from left to right, with a sharp red arrow indicating a downward trend. Decrease business graph illustrations Financial decline illustrated by falling coin stacks and red arrow. Stacks of gold coins decrease in height from left to right, with a sharp red arrow indicating a downward trend
Free with trial Three stacks of gold coins decrease in height from left to right, overlaid by a red arrow pointing downwards. Isolated on a transparent background. Decrease business graph vectors Stacks of gold coins with red downward trending arrow isolated on a transparent background money. Three stacks of gold coins decrease in height from left to right, overlaid by a red arrow pointing downwards. Isolated on a transparent background
Free with trial Stacks of gold coins sit before a fluctuating red arrow graph illustrating concepts of financial growth market trends investment risk and economic change The image depicts uncertainty and the potential for both profit and loss. Decrease business graph illustrations Financial Growth Stock Market Coins Red Arrow Investment Business Economy Finance Money Success. Stacks of gold coins sit before a fluctuating red arrow graph illustrating concepts of financial growth market trends investment risk and economic change The image depicts uncertainty and the potential for both profit and loss
Free with trial A character is gripping a large red arrow pointing downward, representing a decrease or decline in values, set against a clean white background. Decrease business graph illustrations Character Holding a Large Red Downward Arrow Symbolizes Decline Against a Simple White Background. A character is gripping a large red arrow pointing downward, representing a decrease or decline in values, set against a clean white background
Free with trial A graph visually depicts two distinct lines, one showing a pronounced increase while the other reflects a steady decline, all presented in striking orange tones. Decrease business graph illustrations Trends in Data Representation Illustrating Contrasting Growth and Decline Patterns in Vibrant Hues. A graph visually depicts two distinct lines, one showing a pronounced increase while the other reflects a steady decline, all presented in striking orange tones
Free with trial A sharp red arrow, indicating a downward trend, is superimposed over a thick stack of green dollar bills. The dollar bills are depicted with a subtle texture and the dollar sign. The image is set against a clean white background, emphasizing the concept of financial decline or loss. Decrease business graph illustrations Red Downward Arrow Graph Over a Stack of Green Dollar Bills on White Background money finance. A sharp red arrow, indicating a downward trend, is superimposed over a thick stack of green dollar bills. The dollar bills are depicted with a subtle texture and the dollar sign. The image is set against a clean white background, emphasizing the concept of financial decline or loss
Free with trial Reduction chart icon vector logo set collection for web app ui. Decrease business graph vectors Reduction chart icon set depicting data reduction symbols, ideal for business analytics and performance visuals. Reduction chart icon vector logo set collection for web app ui
Free with trial A close-up, angled view of a digital stock market ticker board. The screen displays rows of numbers in vibrant red and green LED lights against a dark background. Red numbers typically indicate a price decrease or negative performance, while green signifies an increase or positive performance. The display shows various financial data, including stock prices, trading volumes, and potentially chart lines, creating a dynamic and abstract representation of financial markets and trading. Decrease business graph illustrations Stock Market Ticker Display with Red and Green Numbers. A close-up, angled view of a digital stock market ticker board. The screen displays rows of numbers in vibrant red and green LED lights against a dark background. Red numbers typically indicate a price decrease or negative performance, while green signifies an increase or positive performance. The display shows various financial data, including stock prices, trading volumes, and potentially chart lines, creating a dynamic and abstract representation of financial markets and trading.
Free with trial A financial illustration shows coins decreasing in size along a horizontal axis, representing devaluation. An upward-pointing arrow indicates increasing inflation percentages, with labels of "4%", "20%", and "50%". The chart is labeled "INFLATION" at the top, with percentages scattered around. Broken pieces from a large coin suggest fragmentation and loss of value. The background features a subtle line graph, reinforcing the economic theme. Decrease business graph illustrations Inflation increasing and devaluing money, showing a financial chart with coins and an arrow going up. A financial illustration shows coins decreasing in size along a horizontal axis, representing devaluation. An upward-pointing arrow indicates increasing inflation percentages, with labels of "4%", "20%", and "50%". The chart is labeled "INFLATION" at the top, with percentages scattered around. Broken pieces from a large coin suggest fragmentation and loss of value. The background features a subtle line graph, reinforcing the economic theme.
Free with trial Set Dollar rate decrease, Mobile stock trading, Burning dollar bill and Shutdown of factory icon. Vector. Decrease business graph vectors Set Dollar rate decrease, Mobile stock trading, Burning dollar bill and Shutdown of factory icon. Vector
Free with trial Percentage sign icon, related to accounting, ideal for financial, tax, or business-related designs. Decrease business graph vectors Professional Percentage Sign Icon for Accounting Purposes. Percentage sign icon, related to accounting, ideal for financial, tax, or business-related designs.
Free with trial Orange arrow pointing downward through clouds towards earth. Global economic downturn visualization for market analysis and business decline concept. Decrease business graph illustrations Orange arrow pointing downward through clouds towards earth. Global economic downturn visualization
Free with trial Percentage sign icon, related to accounting, ideal for financial, tax, or business-related designs. Decrease business graph vectors Professional Percentage Sign Icon for Accounting Purposes. Percentage sign icon, related to accounting, ideal for financial, tax, or business-related designs.
Free with trial A percentage sign is a symbol used to indicate a proportion or ratio in relation to a whole. It is commonly used in finance, business, and marketing contexts, and more. Decrease business graph vectors Illustration of a percentage sign, a symbol used to indicate a proportion or ratio in relation to a whole. A percentage sign is a symbol used to indicate a proportion or ratio in relation to a whole. It is commonly used in finance, business, and marketing contexts, and more
Free with trial Blue folder with chart, business organization, data analysis, and report presentation concept. streamline your workflow ,Generative ai. Decrease business graph illustrations Blue folder with chart, streamlining business data analysis and report presentation for enhanced workflow. Blue folder with chart, business organization, data analysis, and report presentation concept. streamline your workflow ,Generative ai
Free with trial Red glossy 3d arrow going down stock icon on white background. Bankruptcy, financial market crash icon for your web site design, logo, app, UI. graph chart downtrend symbol. chart going down sign. Decrease business graph vectors Red glossy 3d arrow going down stock icon on white background. Bankruptcy, financial market crash icon for your web site design
Free with trial A striking graph displays two lines, one depicting a steady decline and the other a sharp rise, rendered in vibrant gradient shades, symbolizing market fluctuations. Decrease business graph illustrations Visual Representation of Contrasting Trends With Dynamic Gradient Colors Showcasing Market Shifts. A striking graph displays two lines, one depicting a steady decline and the other a sharp rise, rendered in vibrant gradient shades, symbolizing market fluctuations
Free with trial A stylized illustration showing a man painting a downward trending stock market chart symbolizing financial loss and market decline in bright colors. Decrease business graph illustrations Man paints declining stock market graph with green showing the downturn in a stylized illustration. A stylized illustration showing a man painting a downward trending stock market chart symbolizing financial loss and market decline in bright colors.
Free with trial Set line Credit card, Pie chart infographic, Prison cell door and Dollar rate decrease icon. Vector. Decrease business graph illustrations Set line Credit card, Pie chart infographic, Prison cell door and Dollar rate decrease icon. Vector
Free with trial Three-dimensional rectangular bars stand side-by-side on a white background. The bars are of different heights, with the shortest on the left, a medium-height bar in the middle, and the tallest bar on the right. The bars are colored blue, pink, and orange, respectively. This arrangement visually represents a bar chart or graph, suggesting concepts of growth, data comparison, or progress. Decrease business graph illustrations Three 3D Rendered Rectangular Bars of Varying Heights and Colors on a White Background bar chart. Three-dimensional rectangular bars stand side-by-side on a white background. The bars are of different heights, with the shortest on the left, a medium-height bar in the middle, and the tallest bar on the right. The bars are colored blue, pink, and orange, respectively. This arrangement visually represents a bar chart or graph, suggesting concepts of growth, data comparison, or progress
Free with trial Red arrow pointing downward represents a financial downturn and economic loss against a backdrop of bar graphs indicating market decline and potential investment risks suggesting a challenging econom. Decrease business graph illustrations Red downward trend arrow illustrates financial loss and market decline on a bar graph background. Red arrow pointing downward represents a financial downturn and economic loss against a backdrop of bar graphs indicating market decline and potential investment risks suggesting a challenging econom
Free with trial A set of black and white icons representing stock market data analysis and financial growth. 94. Decrease business graph vectors Stock market data analysis charts and graphs business finance and investment vector icon set design 100. a set of black and white icons representing stock market data analysis and financial growth. 94
Free with trial Generative ai, The image is a red stock market graph showing a sharp decline, with a large, red arrow pointing down. The graph is set against a background of a grid pattern of red squares. The image suggests a negative economic trend. Decrease business graph illustrations The image is a red stock chart showing a downward trend. The red arrow is pointing down, indicating that the stock market is in a. generative ai, The image is a red stock market graph showing a sharp decline, with a large, red arrow pointing down. The graph is set against a background of a grid pattern of red squares. The image suggests a negative economic trend
Free with trial Hand interacting with blue chart, analyzing growth, trends, and financial performance data ,Generative ai. Decrease business graph illustrations Hand analyzing blue chart, deciphering growth trends and financial performance for business success. Hand interacting with blue chart, analyzing growth, trends, and financial performance data ,Generative ai
Free with trial A digital globe displays import tariffs data points with percentage decreases in red and blue against a blurred cityscape at night. The globe is rendered in a futuristic style with glowing lines. Decrease business graph illustrations Global Import Tariffs Digital Globe Night Cityscape Data Points Percentage Decrease Red Blue image. A digital globe displays import tariffs data points with percentage decreases in red and blue against a blurred cityscape at night. The globe is rendered in a futuristic style with glowing lines
Free with trial This graph illustrates a compelling visual narrative, showcasing a sharp rise alongside a notable decline, created with vibrant gradient colors. Decrease business graph illustrations Graphical Representation of Contrasting Trends in Vibrant Gradient Hues Revealing Significant Changes. This graph illustrates a compelling visual narrative, showcasing a sharp rise alongside a notable decline, created with vibrant gradient colors
Free with trial Businessman holds smartphone displaying an image of a global economic recession, with a red downward pointing arrow and a declining employment graph, signifying an economic crisis, financial losses. Decrease business graph illustrations Businessman holds smartphone displaying an image of a global economic recession, with a red downward pointing arrow and a. Declining employment graph. Businessman holds smartphone displaying an image of a global economic recession, with a red downward pointing arrow and a declining employment graph, signifying an economic crisis, financial losses
Free with trial A bold red arrow sharply declines in a zigzag pattern, symbolizing a steep drop in performance or value. This visual powerfully conveys financial loss, economic downturn, or negative trends. Decrease business graph illustrations Red arrow descending sharp decline downward trend graph represents financial loss economic downturn. A bold red arrow sharply declines in a zigzag pattern, symbolizing a steep drop in performance or value. This visual powerfully conveys financial loss, economic downturn, or negative trends
Free with trial Reduction chart icon Black line art vector in black and white outline set collection sign. Decrease business graph vectors Decline Chart Icon Illustrating Decrease in Performance, Economic Downturn, and Analytical Data. Reduction chart icon Black line art vector in black and white outline set collection sign
Free with trial A vibrant watercolor painting of a colorful tree alongside a bar graph showing fluctuating growth, symbolizing nature, growth, change, resilience, and potential. Elegant empty space crafted for branding, ads, and product presentations. Suitable for marketing campaigns and creative displays. . Generative AI. Decrease business graph illustrations Watercolor Tree and Growth Chart A vibrant watercolor painting of a colorful tree alongside a bar graph showing fluctuating. A vibrant watercolor painting of a colorful tree alongside a bar graph showing fluctuating growth, symbolizing nature, growth, change, resilience, and potential. Elegant empty space crafted for branding, ads, and product presentations. Suitable for marketing campaigns and creative displays. . Generative AI
Free with trial A single, shiny red arrow curves downwards, signifying a decrease or negative direction, presented on a clean white background. Decrease business graph illustrations A glossy red downward curving arrow indicating a decline or negative trend isolated on white background. A single, shiny red arrow curves downwards, signifying a decrease or negative direction, presented on a clean white background
Free with trial Bar Chart With Downward Arrow Solid Icon. Economic Decline, Financial Loss, And Market Downturn Silhouette Symbol. Business Analysis. Isolated Vector Illustration. Decrease business graph vectors Bar Chart With Downward Arrow Solid Icon. Economic Decline, Financial Loss, And Market Downturn Silhouette Symbol
Free with trial A red bar chart against a dark background showing a significant stock market decline. The image suggests financial crisis, risk, and economic downturn, suitable for business and financial related content. Decrease business graph illustrations Red Stock Market Chart Plunging During Financial Crisis with dark background illustrating sharp decline. A red bar chart against a dark background showing a significant stock market decline. The image suggests financial crisis, risk, and economic downturn, suitable for business and financial related content
Free with trial Declining Bar Chart With Downward Arrow Icon. Economic Downturn, Financial Loss, And Market Decline Outline Symbol. Business Analysis And Risk Assessment. Editable Stroke. Isolated Vector Illustration. Decrease business graph vectors Declining Bar Chart With Downward Arrow Icon. Economic Downturn, Financial Loss, And Market Decline Outline Symbol
Free with trial Set line Shutdown of factory Pie chart infographic Tearing money banknote Storm Mobile stock trading Money bag Dollar rate decrease and Bank building icon. Vector. Decrease business graph illustrations Set line Shutdown of factory, Pie chart infographic, Tearing money banknote, Storm, Mobile stock trading, Money bag. Set line Shutdown of factory Pie chart infographic Tearing money banknote Storm Mobile stock trading Money bag Dollar rate decrease and Bank building icon. Vector.
Free with trial This image showcases vibrant 3D bar and pie charts, illustrating growth and statistical data. Perfect for presentations or reports on financial success. Decrease business graph illustrations Colorful 3D Bar and Pie Charts Showing Business Growth and Statistics. This image showcases vibrant 3D bar and pie charts, illustrating growth and statistical data. Perfect for presentations or reports on financial success.
Free with trial Bar Chart With Downward Trend Line Icon. Financial Decline, Economic Recession, And Market Analysis Outline Symbol. Business Performance Tracking. Editable Stroke. Isolated Vector Illustration. Decrease business graph vectors Bar Chart With Downward Trend Line Icon. Financial Decline, Economic Recession, And Market Analysis Outline Symbol
Free with trial Purple-toned financial visualization depicting stock market volatility, candlestick graph overlaying New York City skyline with currency indicators. Decrease business graph illustrations Candlestick chart showing stock market volatility with New York City skyline and dollar signs, in purple monochrome. Purple-toned financial visualization depicting stock market volatility, candlestick graph overlaying New York City skyline with currency indicators
Free with trial Bar Chart With Downward Trend Line Solid Icon. Financial Decline, Economic Downturn, And Market Analysis Silhouette Symbol. Business Performance Tracking. Isolated Vector Illustration. Decrease business graph vectors Bar Chart With Downward Trend Line Solid Icon. Financial Decline, Economic Downturn, And Market Analysis Silhouette
Free with trial A downward-pointing arrow ending in a percentage sign indicates a decline. This visual represents concepts like loss, market downturn, or negative trends in business and finance. Isolated on white. Decrease business graph illustrations Decreasing percentage arrow isolated on white background. use cases: finance, business, marketing. A downward-pointing arrow ending in a percentage sign indicates a decline. This visual represents concepts like loss, market downturn, or negative trends in business and finance. Isolated on white
Free with trial Cost reduction concept shows hands typing on a laptop keyboard with a glowing green icon representing financial savings budget management and efficiency optimization for business strategy planning an. Decrease business graph illustrations Cost reduction savings finance economy budget management efficiency optimization strategy planning analysis. Cost reduction concept shows hands typing on a laptop keyboard with a glowing green icon representing financial savings budget management and efficiency optimization for business strategy planning an
Free with trial Vibrant bar chart visualization with dark background displaying data trends ,Generative ai. Decrease business graph illustrations Colorful bar chart on dark background, data visualization for business performance analysis and trend insights. Vibrant bar chart visualization with dark background displaying data trends ,Generative ai
Free with trial Generative ai, The image shows a red bar graph and a red arrow pointing down on a red grid background, illustrating a significant downward trend. Decrease business graph illustrations The image shows a red and white arrow pointing down in front of a red grid background with a series of 3D red bars depicting. generative ai, The image shows a red bar graph and a red arrow pointing down on a red grid background, illustrating a significant downward trend
Free with trial Set line Dollar rate decrease Shutdown of factory Money bomb dollar crisis Drop in crude oil price Falling property prices Contract money and pen and Bank building icon. Vector. Decrease business graph illustrations Set line Dollar rate decrease, Shutdown of factory, Money bomb dollar crisis, Drop in crude oil price, Falling property. Set line Dollar rate decrease Shutdown of factory Money bomb dollar crisis Drop in crude oil price Falling property prices Contract money and pen and Bank building icon. Vector.
Free with trial A bold red arrow curves and points downwards, symbolizing a decrease or negative trajectory, isolated on a plain white background. Decrease business graph illustrations A vibrant red arrow curves downwards indicating a sharp decline or negative trend isolated on white background. A bold red arrow curves and points downwards, symbolizing a decrease or negative trajectory, isolated on a plain white background
Free with trial A red bar chart showing a significant decline in the stock market. The graph is set against a dark background, emphasizing the concept of financial crisis. The sharp decline and red color convey a sense of loss and market instability. Decrease business graph illustrations Red Stock Market Decline with Bar Chart on Dark Background Financial Crisis Concept. A red bar chart showing a significant decline in the stock market. The graph is set against a dark background, emphasizing the concept of financial crisis. The sharp decline and red color convey a sense of loss and market instability
Free with trial Generative ai, The image shows a bar chart with a red arrow pointing down, indicating a downward trend in a financial market. The glowing blue bars represent rising values, while the red arrow signifies a drop in value,. Decrease business graph illustrations The image shows a blue and red graph with a red arrow pointing downwards, illustrating a decline in a company stock price. generative ai, The image shows a bar chart with a red arrow pointing down, indicating a downward trend in a financial market. The glowing blue bars represent rising values, while the red arrow signifies a drop in value,
Free with trial Set line Drop in crude oil price, Dollar rate decrease, Debt ball chained to coin and Bank building icon. Vector. Decrease business graph illustrations Set line Drop in crude oil price, Dollar rate decrease, Debt ball chained to coin and Bank building icon. Vector
Free with trial Set line Stop delivery cargo truck Dollar rate decrease Money bomb dollar crisis Hanging sign with Sale Mobile stock trading Drop crude oil price and Glass money jar coin icon. Vector. Decrease business graph illustrations Set line Stop delivery cargo truck, Dollar rate decrease, Money bomb dollar crisis, Hanging sign with Sale, Mobile stock. Set line Stop delivery cargo truck Dollar rate decrease Money bomb dollar crisis Hanging sign with Sale Mobile stock trading Drop crude oil price and Glass money jar coin icon. Vector.
Free with trial Set Isometric line Briefcase, Mobile stock trading, Debt ball chained coin and Dollar rate decrease icon. Vector. Decrease business graph illustrations Set Isometric line Briefcase, Mobile stock trading, Debt ball chained coin and Dollar rate decrease icon. Vector
Free with trial Set line Dollar rate decrease Contract money and pen Briefcase Gold bars Falling property prices Mobile stock trading Debt ball chained coin and Stop delivery cargo truck icon. Vector. Decrease business graph illustrations Set line Dollar rate decrease, Contract money and pen, Briefcase, Gold bars, Falling property prices, Mobile stock. Set line Dollar rate decrease Contract money and pen Briefcase Gold bars Falling property prices Mobile stock trading Debt ball chained coin and Stop delivery cargo truck icon. Vector.
Free with trial Generative ai, The image is of a red arrow pointing down, superimposed on a blue and red bar graph, symbolizing a downward trend, potentially indicating a financial or economic decline. Decrease business graph illustrations A large red arrow points downwards over a gridded financial chart showing a sharp decline in value, with the bars of the chart. generative ai, The image is of a red arrow pointing down, superimposed on a blue and red bar graph, symbolizing a downward trend, potentially indicating a financial or economic decline
Free with trial A gleaming gold coin with a ridged edge is depicted against a clean white background. The coin's face features a black circular inset containing a golden bar chart with bars decreasing in height from left to right, accompanied by a downward-pointing arrow. This visual represents financial decline or economic loss. Decrease business graph illustrations Gold Coin with Black Circle Featuring a Downward Trending Bar Chart and Arrow Keywords: coin, gold, money, finance, business. A gleaming gold coin with a ridged edge is depicted against a clean white background. The coin's face features a black circular inset containing a golden bar chart with bars decreasing in height from left to right, accompanied by a downward-pointing arrow. This visual represents financial decline or economic loss
Free with trial Generative AI : Pile of Gold Coins Against a Falling Stock Chart Indicating Market Downturn and Financial Loss business concept. Decrease business graph illustrations Generative AI Pile of Gold Coins Against a Falling Stock Chart Indicating Market Downturn and Financial Loss busin
Free with trial Red arrow crashes through white cracked surface. Downward trend financial market, economic recession, financial crisis concept. Symbol of business failure loss. Decline of economy. 3d. Decrease business graph illustrations Red arrow crashes through white cracked surface. Downward trend financial market, economic recession, financial crisis concept.
Free with trial Decreasing arrow on a textured, rusty surface. Abstract concept representing economic recession and financial decline, business failure, investment risk. Decrease business graph illustrations Decreasing arrow on a textured, rusty surface. Abstract concept representing economic recession and financial decline
Free with trial Wooden cubes spelling tariffs with a decreasing stock market graph in the background, representing the negative impact on global trade and economy. Decrease business graph illustrations Tariffs increasing with decreasing stock market prices impacting global trade and economy. Wooden cubes spelling tariffs with a decreasing stock market graph in the background, representing the negative impact on global trade and economy
Free with trial Wooden cubes spelling tariffs with a decreasing stock market graph in the background, representing the negative impact on global trade and economy. Decrease business graph illustrations Tariffs increasing with decreasing stock market prices impacting global trade and economy. Wooden cubes spelling tariffs with a decreasing stock market graph in the background, representing the negative impact on global trade and economy
Free with trial Set Dollar rate decrease Drop in crude oil price Fire burning house Tearing money banknote Mobile stock trading Shutdown of factory Pie chart infographic and icon. Vector. Decrease business graph vectors Set Dollar rate decrease, Drop in crude oil price, Fire burning house, Tearing money banknote, Mobile stock trading. Set Dollar rate decrease Drop in crude oil price Fire burning house Tearing money banknote Mobile stock trading Shutdown of factory Pie chart infographic and icon. Vector.
Free with trial Generative ai, The image is a red stock market chart with a large red arrow pointing down. The chart is on a red and black grid. It shows a sharp decline in a stock price. This suggests that there is a recession or downturn in the economy. Decrease business graph illustrations The image is a red graph with a large red arrow pointing downwards, signifying a decline in an economic or market trend, on a red. generative ai, The image is a red stock market chart with a large red arrow pointing down. The chart is on a red and black grid. It shows a sharp decline in a stock price. This suggests that there is a recession or downturn in the economy
Free with trial A 3D rendered pie chart composed of three pastel-colored segments: pink, blue, and teal. Two coins are positioned around the chart. A yellow coin with an upward-pointing arrow is above the chart, and a pink coin with a downward-pointing arrow is below it, set against a light purple background. Decrease business graph illustrations 3D Pie Chart with Up and Down Arrows on Coins in Pastel Colors Keywords: pie chart, graph, data, analytics, statistics, finance. A 3D rendered pie chart composed of three pastel-colored segments: pink, blue, and teal. Two coins are positioned around the chart. A yellow coin with an upward-pointing arrow is above the chart, and a pink coin with a downward-pointing arrow is below it, set against a light purple background
Free with trial Set line Dollar rate decrease, Broken piggy bank, Pie chart infographic and Drop crude oil price. Glowing neon icon. Vector. Decrease business graph illustrations Set line Dollar rate decrease, Broken piggy bank, Pie chart infographic and Drop crude oil price. Glowing neon icon
Free with trial Set line Bank building Shutdown of factory Prison cell door Dollar rate decrease Global economic crisis Employee dismissal Storm and Pie chart infographic icon. Vector. Decrease business graph vectors Set line Bank building, Shutdown of factory, Prison cell door, Dollar rate decrease, Global economic crisis, Employee. Set line Bank building Shutdown of factory Prison cell door Dollar rate decrease Global economic crisis Employee dismissal Storm and Pie chart infographic icon. Vector.