Free with trial Financial crisis inflation isometric composition with burning money bar charts broken coin computer and distressed accountants vector illustration. Decrease charts vectors Financial Crisis Accountants Composition. Financial crisis inflation isometric composition with burning money bar charts broken coin computer and distressed. Financial crisis inflation isometric composition with burning money bar charts broken coin computer and distressed accountants vector illustration
Free with trial Revenue Expenses. Financials charts pf Revenue, Growth and Expenses. Decrease charts vectors Revenue Expenses. Financials charts pf Revenue, Growth and Expenses
Free with trial Puppet holding his head against a background of falling charts,. Decrease charts illustrations Graphics fall. Puppet holding his head against a background of falling charts. Puppet holding his head against a background of falling charts,
Free with trial Stock exchange board, market index graphs and charts, vector background. Stock exchange board prices on screen display, tickers, financial data numbers and electronic trade rates. Decrease charts vectors Stock exchange board with market index graph chart. Stock exchange board, market index graphs and charts, vector background. Stock exchange board prices on. Stock exchange board, market index graphs and charts, vector background. Stock exchange board prices on screen display, tickers, financial data numbers and electronic trade rates
Free with trial Business material. Financials charts pf Revenue, Growth and Expenses. Decrease charts vectors Business material. Financials charts pf Revenue, Growth and Expenses
Free with trial Business Chart Down - Black And Golden 3D Illustration - Isolated On White Background. Decrease charts illustrations Business Chart Down - Black And Golden 3D Illustration - Isolated On White Background
Free with trial Financial chart. Sketch graphs and charts for business presentation. Decrease charts vectors Financial chart. Sketch graphs and charts for business presentation
Free with trial Woman adjusting chart position. Woman changes the results of the graph. Decrease charts vectors Woman adjusting chart position. Woman changes the results of the graph
Free with trial Graph down. Black icon graph decline with arrow isolated on white background. Hologram statistic. Deficit direction for business concept design. Analysis information forecast. Vector illustration. Decrease charts vectors Graph down. Black icon graph decline with arrow. Hologram statistic. Deficit direction business. Analysis information forecast. Graph down. Black icon graph. Graph down. Black icon graph decline with arrow isolated on white background. Hologram statistic. Deficit direction for business concept design. Analysis information forecast. Vector illustration
Free with trial Three Elemenst of Time Management in Chart. Sketched charts and graphs of time management. Decrease charts vectors Three Elemenst of Time Management in Chart. Sketched charts and graphs of time management
Free with trial Time Management Planning Goal with the Chart. Sketched charts and graphs of time management. Decrease charts vectors Time Management Planning Goal with the Chart. Sketched charts and graphs of time management
Free with trial Cost optimization concept. Laptop with graph and diagram windows on the screen. Analyzing statistical charts and graphs. Data analysis for business finance investment. Web vector illustration in 3D style. Decrease charts vectors Cost optimization illustration in 3D style. Cost optimization concept. Laptop with graph and diagram windows on the screen. Analyzing statistical charts and. Cost optimization concept. Laptop with graph and diagram windows on the screen. Analyzing statistical charts and graphs. Data analysis for business finance investment. Web vector illustration in 3D style
Free with trial Time Management Efficiency Chart Growth in Factors. Sketched charts and graphs of time management. Decrease charts vectors Time Management Efficiency Chart Growth in Factors. Sketched charts and graphs of time management
Free with trial Revenue Expenses. Financials charts pf Revenue, Growth and Expenses. Decrease charts vectors Revenue Expenses. Financials charts pf Revenue, Growth and Expenses
Free with trial Sketched pictures and charts. Business materials. Decrease charts vectors Diargam and Graphs. Sketched pictures and charts. Business materials. Sketched pictures and charts. Business materials.
Free with trial Sketched pictures and charts. Business materials. Decrease charts vectors Diargam and Graphs. Sketched pictures and charts. Business materials. Sketched pictures and charts. Business materials.
Free with trial Sketched pictures and charts. Business materials. Decrease charts vectors Diargam and Graphs. Sketched pictures and charts. Business materials. Sketched pictures and charts. Business materials.
Free with trial Financial bar graph showing increasing losses. Extending down into the red in a pale pink with currency symbols for the dollar, euro, yen, and pound. Decrease charts illustrations Financial bar graph showing increasing losses. Extending down into the red in a pale pink with currency symbols for the dollar, euro, yen, and pound
Free with trial A computer generated illustration image of a green vertical bar chart and upward arrow showing the increasing trend against a white backdrop. Decrease charts illustrations A green vertical bar chart and upward arrow showing the increasing trend white backdrop. A computer generated illustration image of a green vertical bar chart. A computer generated illustration image of a green vertical bar chart and upward arrow showing the increasing trend against a white backdrop.
Free with trial Blue stock market or financial chart with a declining trend. On a white background - vector. Decrease charts vectors Blue stock market or financial chart with a declining trend. On a white background, vector. Blue stock market or financial chart with a declining trend. On a. Blue stock market or financial chart with a declining trend. On a white background - vector
Free with trial Crisis or stock crash on market, loss trading and investment indicators downturn, vector. Stock exchange market and financial business crisis and economic fall down with flow charts and diagram. Decrease charts illustrations Crisis or stock crash on market, loss trading down. Crisis or stock crash on market, loss trading and investment indicators downturn, vector. Stock exchange. Crisis or stock crash on market, loss trading and investment indicators downturn, vector. Stock exchange market and financial business crisis and economic fall down with flow charts and diagram
Free with trial Unrecognizable businessman using tablet in blurry office with double exposure of falling financial charts. Concept of market crash. Toned image. Decrease charts illustrations Businessman using tablet in office, falling graph. Unrecognizable businessman using tablet in blurry office with double exposure of falling financial charts. Unrecognizable businessman using tablet in blurry office with double exposure of falling financial charts. Concept of market crash. Toned image
Free with trial Crisis or stock crash on market, loss trading and investment indicators downturn, vector. Stock exchange market and financial business crisis and economic fall down with flow charts and diagram. Decrease charts vectors Crisis or stock crash on market, loss trading down. Crisis or stock crash on market, loss trading and investment indicators downturn, vector. Stock exchange. Crisis or stock crash on market, loss trading and investment indicators downturn, vector. Stock exchange market and financial business crisis and economic fall down with flow charts and diagram
Free with trial Arrows pointing up and down or to sides, taking on different shapes and statistical charts. Background of straight or wavy arrows for web design, presentations and infographics. Hand drawn doodle. Decrease charts vectors Arrows pointing up and down or to sides, taking on different shapes. Hand drawn doodle. Arrows pointing up and down or to sides, taking on different shapes and. Arrows pointing up and down or to sides, taking on different shapes and statistical charts. Background of straight or wavy arrows for web design, presentations and infographics. Hand drawn doodle
Free with trial Chart indicators Exchange. Reporting schedules. vector. infographic. Decrease charts vectors Chart indicators Exchange. Reporting schedules. vector. infographic
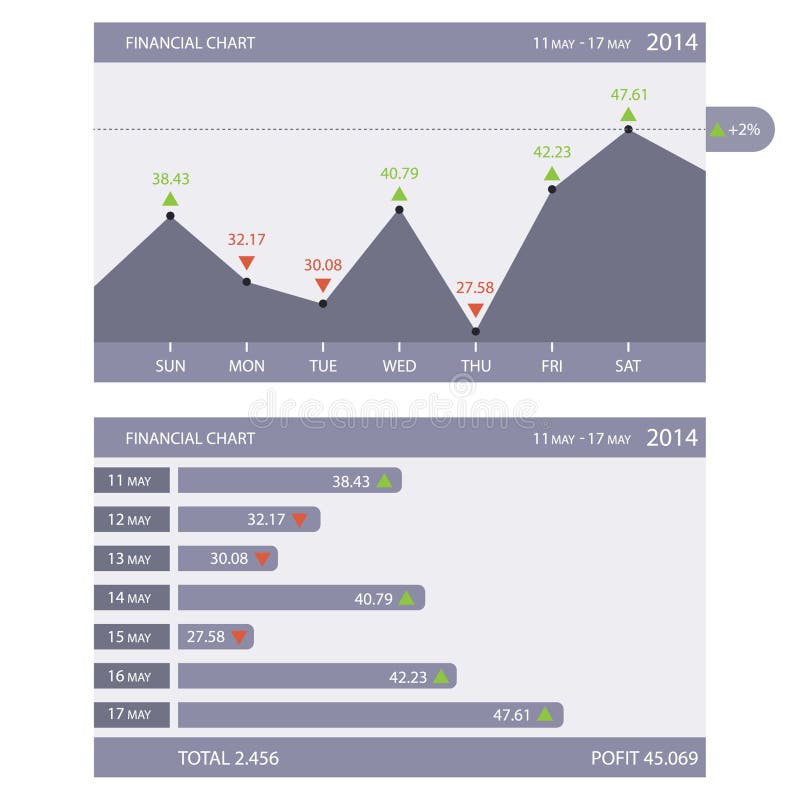
Free with trial Result Up and down financial chart Template. Illustration eps file. Decrease charts illustrations Result Up and down financial chart Template. Illustration eps file
Free with trial Result Up and down financial chart Template. Illustration eps file. Decrease charts vectors Result Up and down financial chart Template. Illustration eps file
Free with trial Professional monitoring business expenses. Woman at desk, assessing financial charts with declining trends and dollar signs. Cost management and reduction focus. Flat vector illustration. Decrease charts vectors Professional monitoring business expenses. Woman. At desk, assessing financial charts with declining trends and dollar signs. Cost management and reduction. Professional monitoring business expenses. Woman at desk, assessing financial charts with declining trends and dollar signs. Cost management and reduction focus. Flat vector illustration.
Free with trial Thailand Stock Exchange market crisis red market price down chart fall / Stock analysis or forex charts graph Business and finance money crisis red negative drop in sales economic fall. Decrease charts illustrations Thailand Stock Exchange market crisis red market price down chart fall Business and finance money crisis red negative drop in. Thailand Stock Exchange market. Thailand Stock Exchange market crisis red market price down chart fall / Stock analysis or forex charts graph Business and finance money crisis red negative drop in sales economic fall
Free with trial Financial chart graph background with world map. Vector. Decrease charts illustrations Financial chart graph background with world map. Vector
Free with trial Result Up and down financial chart Template. Illustration eps file. Decrease charts illustrations Result Up and down financial chart Template. Illustration eps file
Free with trial Arrows pointing down as a symbol of crisis. Black four arrows pointing downwards showing crisis in charts. Decrease charts vectors Arrows pointing down as a symbol of crisis. Black four arrows pointing downwards showing crisis in charts
Free with trial India Bombay Stock Exchange market crisis red market price down chart fall / Stock analysis or forex charts graph Business and finance money crisis background red negative drop in sales economic fall. Decrease charts illustrations India Bombay Stock Exchange market crisis red market price down chart fall Business and finance money crisis background red. India Bombay Stock Exchange market. India Bombay Stock Exchange market crisis red market price down chart fall / Stock analysis or forex charts graph Business and finance money crisis background red negative drop in sales economic fall
Free with trial Sudden flash crash of the bitcoin value. Rise and fall of cryptocurrencies, flash crash of the bitcoin value. Decrease charts vectors Sudden flash crash of the bitcoin value. Rise and fall of cryptocurrencies, flash crash of the bitcoin value
Free with trial Image illustrates a bear market concept with a red bear silhouette and descending stock market charts on a white background. 3D Rendering. Decrease charts illustrations Bear market concept with red stock market chart on white background. 3D Rendering. Image illustrates a bear market concept with a red bear silhouette and. Image illustrates a bear market concept with a red bear silhouette and descending stock market charts on a white background. 3D Rendering
Free with trial Graph icon. With outline and glyph style. Best usage as user interface, infographic element, app icon, web icon, etc. Decrease charts vectors Statistical data icon represented from charts and graphs. Graph icon. With outline and glyph style. Best usage as user interface, infographic element, app icon. Graph icon. With outline and glyph style. Best usage as user interface, infographic element, app icon, web icon, etc.
Free with trial Crisis. Graphs and charts templates. Business infographics. Investment expenses and bad economy reduction. Decrease charts vectors World financial crisis. Crisis. Graphs and charts templates. Business infographics. Investment expenses and bad economy reduction. Crisis. Graphs and charts templates. Business infographics. Investment expenses and bad economy reduction
Free with trial Result Dollar Up and down financial chart Template. Dollar currency Result Up and down financial chart Template illustration eps file. Decrease charts illustrations Result Dollar Up and down financial chart Template. Dollar currency Result Up and down financial chart Template illustration eps file
Free with trial This vector icon set features graph diagrams with arrows indicating growth and decline. The icons represent business metrics and financial performance, with arrows pointing upward for growth and downward for decline. These symbols are ideal for visualizing trends, success, and changes in finance reports or business charts. The clean, simple design ensures clarity, making these icons suitable for use in presentations, reports, or dashboards to effectively communicate financial or business performance. Decrease charts vectors Growing up and down vector icon set. Graph diagram with arrow. Business growth success chart. Finance report symbol. This vector icon set features graph. This vector icon set features graph diagrams with arrows indicating growth and decline. The icons represent business metrics and financial performance, with arrows pointing upward for growth and downward for decline. These symbols are ideal for visualizing trends, success, and changes in finance reports or business charts. The clean, simple design ensures clarity, making these icons suitable for use in presentations, reports, or dashboards to effectively communicate financial or business performance.
Free with trial These data analytics vectors pack is here to enchant you in better way. In this pack, you can find some awesome charts, graphs and analytics vectors. Download, edit and use them!. Decrease charts vectors Data Visualization Flat Vectors Pack. These data analytics vectors pack is here to enchant you in better way. In this pack, you can find some awesome charts. These data analytics vectors pack is here to enchant you in better way. In this pack, you can find some awesome charts, graphs and analytics vectors. Download, edit and use them!
Free with trial Document with charts showing market analysis and financial report. Document is being analyzed with a bar graph and pie chart representing market data. Decrease charts vectors Document with charts showing market analysis and financial report. Document is being analyzed with a bar graph and pie chart representing market data
Free with trial White charts, table, numbers and fiery orange glow beneath. Dark blue cosmic space with perspective location of symbolic data. 3d rendering. Decrease charts illustrations Chart lines with table and fiery glow. White charts, table, numbers and fiery orange glow beneath. Dark blue cosmic space with perspective location of symbolic. White charts, table, numbers and fiery orange glow beneath. Dark blue cosmic space with perspective location of symbolic data. 3d rendering
Free with trial Desperate african-american business woman sitting at workplace with laptop computer with charts going down on a screen. Business fail concept. Vector cartoon illustration isolated on white background. Decrease charts vectors Woman worried about business graph going down. Desperate african-american business woman sitting at workplace with laptop computer with charts going down on a. Desperate african-american business woman sitting at workplace with laptop computer with charts going down on a screen. Business fail concept. Vector cartoon illustration isolated on white background.
Free with trial Coronavirus infection and pandemic causes stock and financial markets to fall. Charts of declining stocks and bonds due to viral infection. World finance crisis. Trendy flat banner. Vector illustration. Decrease charts vectors Coronavirus infection and pandemic causes stock and financial markets to fall. Charts of declining stocks and bonds due to viral infection. World finance
Free with trial Soft skills set. Animated professionals exemplify initiative, flexibility, and customer service. Targets and growth charts enhance the narrative. Decrease charts vectors Soft skills set. Animated professionals exemplify initiative, flexibility, and customer service. Targets and growth charts enhance the narrative
Free with trial Colorful Hexagonal Background Illustration with EPS File for wallpapers , presentation, backgrounds , screensavers. posters. Decrease charts vectors Colorful Hexagonal Background Illustration with EPS File. Colorful Hexagonal Background Illustration with EPS File for wallpapers , presentation. Colorful Hexagonal Background Illustration with EPS File for wallpapers , presentation, backgrounds , screensavers. posters
Free with trial The concept of interest rate monitoring. Professionals analyze fluctuations in mortgage rates using a magnifying glass and charts, ensuring profitable financial decisions. Banking ideas. Flat vector. Decrease charts vectors The concept of interest rate monitoring. Flat vector. The concept of interest rate monitoring. Professionals analyze fluctuations in mortgage rates using a. The concept of interest rate monitoring. Professionals analyze fluctuations in mortgage rates using a magnifying glass and charts, ensuring profitable financial decisions. Banking ideas. Flat vector.
Free with trial Collection of bar graphs. Vector illustration decorative design. Decrease charts vectors Collection of bar graphs. Vector illustration decorative design
Free with trial Professional monitoring business expenses. Woman at desk, assessing financial charts with declining trends and dollar signs. Cost management and reduction focus. Flat vector illustration. Decrease charts vectors Professional monitoring business expenses. Woman at desk, assessing. Financial charts with declining trends and dollar signs. Cost management and reduction. Professional monitoring business expenses. Woman at desk, assessing financial charts with declining trends and dollar signs. Cost management and reduction focus. Flat vector illustration.
Free with trial Illustration of a businessman feeling anxious and overwhelmed by financial loss. The image depicts falling graphs and scattered money symbolizing economic crisis and business failure. Decrease charts illustrations Businessman stressed over financial downturn with falling graphs and money. Illustration of a businessman feeling anxious and overwhelmed by financial loss. The. Illustration of a businessman feeling anxious and overwhelmed by financial loss. The image depicts falling graphs and scattered money symbolizing economic crisis and business failure.
Free with trial Stock exchange chart graph. Finance business report. Abstract stock market multicoloured diagrams, charts and curves with a red background. Decrease charts illustrations Stock exchange chart graph with a red background. Stock exchange chart graph. Finance business report. Abstract stock market multicoloured diagrams, charts and. Stock exchange chart graph. Finance business report. Abstract stock market multicoloured diagrams, charts and curves with a red background.
Free with trial Icon set including chart nad graph variations. Bar graph, pie graph, line graph. Decrease charts vectors Icon set including chart nad graph variations. Bar graph, pie graph, line graph
Free with trial Bar graph with decline concept. Vector illustration decorative design. Decrease charts vectors Bar graph with decline concept. Vector illustration decorative design
Free with trial Colorful cylindrical graphs with icons. Three different growth charts with nine icons. Decrease charts vectors Colorful cylindrical graphs with icons. Three different growth charts with nine icons
Free with trial Decreasing stocks bars graphic icon vector isolated on white background for your web and mobile app design, Decreasing stocks bars graphic logo concept. Decrease charts vectors Decreasing stocks bars graphic icon vector sign and symbol isolated on white background, Decreasing stocks bars graphic logo. Decreasing stocks bars graphic icon. Decreasing stocks bars graphic icon vector isolated on white background for your web and mobile app design, Decreasing stocks bars graphic logo concept
Free with trial Decline concept. Vector illustration decorative design. Decrease charts vectors Decline concept. Vector illustration decorative design
Free with trial Result Up and down financial chart Template. Illustration eps file. Decrease charts illustrations Result Up and down financial chart Template. Illustration eps file
Free with trial Stacked area chart isolated vector image. Stacked area chart. colored isolated vector business analytics graphic concept image. Decrease charts vectors Stacked area chart isolated vector image. Stacked area chart. colored isolated vector business analytics graphic concept image
Free with trial Result Up and down financial chart Template. Illustration eps file. Decrease charts illustrations Result Up and down financial chart Template. Illustration eps file
Free with trial Result Up and down financial chart Template. Illustration eps file. Decrease charts illustrations Result Up and down financial chart Template. Illustration eps file
Free with trial Result Up and down financial chart Template. Illustration eps file. Decrease charts vectors Result Up and down financial chart Template. Illustration eps file
Free with trial Result Up and down financial chart Template. Illustration eps file. Decrease charts vectors Result Up and down financial chart Template. Illustration eps file
Free with trial Drop statistics concept. Man and woman near falling graph. Crisis and recession, financial problems and bankruptcy, Economics. Characters near statistics and charts. Cartoon flat vector illustration. Decrease charts vectors Drop statistics concept. Man and woman near falling graph. Crisis and recession, financial problems and bankruptcy, Economics. Characters near statistics and
Free with trial Stressed business concept. Frightened man and woman looking at graphs and charts. Financial crisis, recession and unemployment. Unsuccessful Entrepreneurs. Cartoon flat vector illustration. Decrease charts vectors Stressed business concept. Frightened man and woman looking at graphs and charts. Financial crisis, recession and unemployment. Unsuccessful Entrepreneurs
Free with trial Set of Check investment, Bitcoin and Presentation icons. Graph chart sign. Business report, Cryptocurrency laptop, Board with charts. Growth report. Classic design check investment icon. Flat design. Decrease charts vectors Check investment, Bitcoin and Presentation icons. Graph chart sign. Vector. Set of Check investment, Bitcoin and Presentation icons. Graph chart sign. Business. Set of Check investment, Bitcoin and Presentation icons. Graph chart sign. Business report, Cryptocurrency laptop, Board with charts. Growth report. Classic design check investment icon. Flat design
Free with trial Vector concept illustration of impact of coronavirus on the stock exchange and global economy. Covid-19 virus causes market fall down. Background with candlestick stock charts, arrows and viruses. Decrease charts vectors Vector concept illustration of impact of coronavirus on the stock exchange and global economy. Covid-19 virus causes market fall. Down. Background with. Vector concept illustration of impact of coronavirus on the stock exchange and global economy. Covid-19 virus causes market fall down. Background with candlestick stock charts, arrows and viruses
Free with trial Set of Product knowledge, Diagram chart and Phone survey icons. Report document sign. Education process, Presentation graph, Mobile quiz test. Page with charts. Classic design product knowledge icon. Decrease charts vectors Product knowledge, Diagram chart and Phone survey icons. Report document sign. Vector. Set of Product knowledge, Diagram chart and Phone survey icons. Report. Set of Product knowledge, Diagram chart and Phone survey icons. Report document sign. Education process, Presentation graph, Mobile quiz test. Page with charts. Classic design product knowledge icon
Free with trial Result Up and down financial chart Template. Illustration eps file. Decrease charts illustrations Result Up and down financial chart Template. Illustration eps file
Free with trial Result Up and down financial chart Template. Illustration eps file. Decrease charts illustrations Result Up and down financial chart Template. Illustration eps file
Free with trial Result Up and down financial chart Template. Illustration eps file. Decrease charts vectors Result Up and down financial chart Template. Illustration eps file
Free with trial Result Up and down financial chart Template. Illustration eps file. Decrease charts illustrations Result Up and down financial chart Template. Illustration eps file
Free with trial Result Up and down financial chart Template. Illustration eps file. Decrease charts illustrations Result Up and down financial chart Template. Illustration eps file
Free with trial Result Up and down financial chart Template. Illustration eps file. Decrease charts illustrations Result Up and down financial chart Template. Illustration eps file
Free with trial Result Up and down financial chart Template. Illustration eps file. Decrease charts illustrations Result Up and down financial chart Template. Illustration eps file
Free with trial Result Up and down financial chart Template. Illustration eps file. Decrease charts illustrations Result Up and down financial chart Template. Illustration eps file
Free with trial Result Up and down financial chart Template. Illustration eps file. Decrease charts vectors Result Up and down financial chart Template. Illustration eps file
Free with trial Result Up and down financial chart Template. Illustration eps file. Decrease charts vectors Result Up and down financial chart Template. Illustration eps file
Free with trial Column re-growth trend chart graphic image. Column re-growth trend chart isolated vector business information graphic image. Decrease charts vectors Column re-growth trend chart graphic image. Column re-growth trend chart isolated vector business information graphic image
Free with trial Result Up and down financial chart Template. Illustration eps file. Decrease charts illustrations Result Up and down financial chart Template. Illustration eps file
Free with trial Result Up and down financial chart Template. Illustration eps file. Decrease charts vectors Result Up and down financial chart Template. Illustration eps file
 Sign in