Free with trial An illustration featuring bags of money and coins set against blue charts or graphs with arrows pointing up and down to represent making and losing money. Decrease charts illustrations Making and Losing Money. An illustration featuring bags of money and coins set against blue charts or graphs with arrows pointing up and down to represent making. An illustration featuring bags of money and coins set against blue charts or graphs with arrows pointing up and down to represent making and losing money
Free with trial Falling graph. 3d rendering of the falling graph. Decrease charts illustrations Falling graph. 3d rendering of the falling graph
Free with trial A set of eight 3D glossy pie charts representing various values. Decrease charts vectors Pie Graphs EPS. A set of eight 3D glossy pie charts representing various values. A set of eight 3D glossy pie charts representing various values.
Free with trial Collection of business bar charts in different versions, on white background. Eps file available. Decrease charts vectors Business Bar Charts Set. Collection of business bar charts in different versions, on white background. Eps file available. Collection of business bar charts in different versions, on white background. Eps file available.
Free with trial A background of stock market numbers and charts. Decrease charts illustrations Stock market chart. A background of stock market numbers and charts. A background of stock market numbers and charts.
Free with trial Graph negatively decreasing. A graph showing a negative decrease. Decrease charts illustrations Graph negatively decreasing. A graph showing a negative decrease
Free with trial Different business charts. Nine different business charts and graphs - additional ai and eps format available on request. Decrease charts vectors Different business charts. Nine different business charts and graphs - additional ai and eps format available on request
Free with trial Business charts. Silhouettes of men and women with business charts-teamwork - additional ai and eps format available on request. Decrease charts vectors Business charts. Silhouettes of men and women with business charts-teamwork - additional ai and eps format available on request
Free with trial Charts and graphs. Set of icons with different types of charts and graphs. Decrease charts vectors Charts and graphs. Set of icons with different types of charts and graphs
Free with trial Stock crisis red market price arrow down chart fall / Stock exchange market analysis or forex charts graph - business and finance money forex crisis losing moving down economic inflation deflation. Decrease charts illustrations Stock crisis red market price arrow down chart fall / Stock exchange market analysis or forex charts graph. Business and finance money forex crisis losing. Stock crisis red market price arrow down chart fall / Stock exchange market analysis or forex charts graph - business and finance money forex crisis losing moving down economic inflation deflation
Free with trial Businessman Profits and Losses. An illustration featuring a businessman standing with chart and arrows going up and down. Decrease charts illustrations Businessman Profits and Losses. An illustration featuring a businessman standing with chart and arrows going up and down
Free with trial Group of financial icons for the rise of the financial market. Decrease charts vectors Stock Market Set - positive. Group of financial icons for the rise of the financial market. Group of financial icons for the rise of the financial market.
Free with trial A set of graph illustrations in bright colors. Decrease charts vectors Graph illustration set. A set of graph illustrations in bright colors. A set of graph illustrations in bright colors.
Free with trial Selection of typical business performance graphs. Pie charts, bar and line business graphs showing performance and sales. Decrease charts vectors Selection of typical business performance graphs. Pie charts, bar and line business graphs showing performance and sales
Free with trial Set of charts. Set of nine business charts isolated on white background. EPS file available. Decrease charts vectors Set of charts. Set of nine business charts isolated on white background.EPS file available
Free with trial Charts and Diagrams Vector Color Line Icon Set. Contains such Icons as Bubble Chart, Column Chart, Pie Chart, Bar Chart, Network Diagram and more. Expanded Stroke. Decrease charts vectors Charts and Diagrams Vector Color Line Icon Set. Contains such Icons as Bubble Chart, Column Chart, Pie Chart, Bar Chart and more. Charts and Diagrams Vector. Charts and Diagrams Vector Color Line Icon Set. Contains such Icons as Bubble Chart, Column Chart, Pie Chart, Bar Chart, Network Diagram and more. Expanded Stroke
Free with trial Graph postively decreasing. A graph showing a positive decrease. Decrease charts illustrations Graph postively decreasing. A graph showing a positive decrease
Free with trial Two hand drawn charts designs. Sketchy illustration. Decrease charts vectors Hand drawn charts. Two hand drawn charts designs. Sketchy illustration. Two hand drawn charts designs. Sketchy illustration.
Free with trial Bar charts. Bar chart on tiled grid. Decrease charts illustrations Bar charts. Bar chart on tiled grid
Free with trial Vector financial. An illustration showing financial fluctuation. Decrease charts vectors Vector financial. An illustration showing financial fluctuation
Free with trial Vector financial. An illustration showing financial fluctuation. Decrease charts vectors Vector financial. An illustration showing financial fluctuation
Free with trial Chart World down. Chart World map down global crisis. Decrease charts vectors Chart World down. Chart World map down global crisis
Free with trial Equal waves. Equal levelled waves. Decrease charts illustrations Equal waves. Equal levelled waves
Free with trial Cool infographics demonstrating business networking on a b-b emphasis connecting different partners or services. These are vector infographs that help you to give a great data visualization examples to your clients or partners. Available in EPS when you download. Decrease charts vectors Infographics - Business Networking. Cool infographics demonstrating business networking on a b-b emphasis connecting different partners or services. These are. Cool infographics demonstrating business networking on a b-b emphasis connecting different partners or services. These are vector infographs that help you to give a great data visualization examples to your clients or partners. Available in EPS when you download.
Free with trial Graphic business ratings. And charts collection. Infographic elements. Decrease charts vectors Graphic business ratings. And charts collection. Infographic elements
Free with trial Statistical control. Quality and finance statistical control. Six sigma chart. Decrease charts illustrations Statistical control. Quality and finance statistical control. Six sigma chart
Free with trial Chart Europe down. Chart with downwards arrow over map of Europe. Decrease charts illustrations Chart Europe down. Chart with downwards arrow over map of Europe
Free with trial Chart currencies down. Chart with downwards arrow over currency symbols. Decrease charts illustrations Chart currencies down. Chart with downwards arrow over currency symbols
Free with trial World downwards chart. Downwards moving chart over a map of the world. Decrease charts illustrations World downwards chart. Downwards moving chart over a map of the world
Free with trial Vector image charts and diagrams for presentation or financial report. Infographics concept. Increase and decrease of indicators in graphic diagram. Colorful vector illustration. Decrease charts vectors Vector image charts and diagrams for presentation or financial report. Infographics concept.Increase and decrease of. Indicators in graphic diagram. Colorful
Free with trial Up and down graph icons. Arrow charts, growth diagram and decline graph, business data analysis and financial trend. Market statistic information vector set. Increase and decrease graph symbols. Decrease charts vectors Up and down graph icons. Arrow charts, growth diagram and decline graph, business data analysis and financial trend. Market. Statistic information vector set. Up and down graph icons. Arrow charts, growth diagram and decline graph, business data analysis and financial trend. Market statistic information vector set. Increase and decrease graph symbols.
Free with trial Vector stock market charts and graphs. Stock market charts and graphs, Vector illustration template design. Decrease charts vectors Vector stock market charts and graphs. Stock market charts and graphs, Vector illustration template design
Free with trial Cool infographics bar charts for your business or marketing presentation. These are vector infographs that help you to give a great data visualization examples to your clients or partners. Available in EPS when you download. Decrease charts vectors Infographics - Bar Charts. Cool infographics bar charts for your business or marketing presentation. These are vector infographs that help you to give a great. Cool infographics bar charts for your business or marketing presentation. These are vector infographs that help you to give a great data visualization examples to your clients or partners. Available in EPS when you download.
Free with trial Charts and Diagrams line icons. Report, 3D Chart, Block diagram and Dot Plot graph linear icons. Trend, Pyramid and Pie chart report symbols. Presentation infochart, process flow diagram. Vector. Decrease charts vectors Charts and Diagrams line icons. Report, 3D Chart, Block diagram and Dot Plot graph linear icons. Trend, Pyramid and Pie chart report symbols. Presentation
Free with trial Loss money on computer stocks graphs, vector illustration, flat cartoon pc and cash charts down arrow on screen, concept of unsuccessful financial trading, bad revenue or economy budget fail. Decrease charts vectors Loss money on computer stocks graphs, vector illustration, flat cartoon pc and cash charts down arrow on screen, concept. Of unsuccessful financial trading, bad. Loss money on computer stocks graphs, vector illustration, flat cartoon pc and cash charts down arrow on screen, concept of unsuccessful financial trading, bad revenue or economy budget fail
Free with trial Person typing on a keyboard while studying stock market charts displayed on a monitor in a dimly lit room Perfect for financial and investment visuals. Decrease charts illustrations Analyzing Stock Market Charts on Computer Screen. Person typing on a keyboard while studying stock market charts displayed on a monitor in a dimly lit room. Person typing on a keyboard while studying stock market charts displayed on a monitor in a dimly lit room Perfect for financial and investment visuals
Free with trial Creative collage picture young man economy inflation falling arrow decrease money loss currency devaluation percent rate. Decrease charts illustrations Creative collage picture young man economy inflation falling arrow decrease money loss currency devaluation percent rate.
Free with trial 3D Rendering of Crypto currencies market goes down concept. Glowing Bitcoin BTC on red candle stick charts with extreme price drop background. Decrease charts illustrations Crypto currencies market goes down concept. Glowing Bitcoin BTC on red candle stick charts. 3D Rendering of Crypto currencies market goes down concept. Glowing. 3D Rendering of Crypto currencies market goes down concept. Glowing Bitcoin BTC on red candle stick charts with extreme price drop background.
Free with trial Business charts. Silhouettes of women and business charts - additional ai and eps format available on request. Decrease charts vectors Business charts. Silhouettes of women and business charts - additional ai and eps format available on request
Free with trial Simple chart. On a black background representin increase, success and decrease. Decrease charts illustrations Simple chart. On a black background representin increase, success and decrease
Free with trial Graphs and Charts. Set of different graphs and charts. Decrease charts vectors Graphs and Charts. Set of different graphs and charts
Free with trial Red and white business graph charts 3в. Decrease charts illustrations Red and white business graph charts. 3
Free with trial Charts. Papers with different graphs and charts, vector eps10 illustration. Decrease charts vectors Charts. Papers with different graphs and charts, vector eps10 illustration
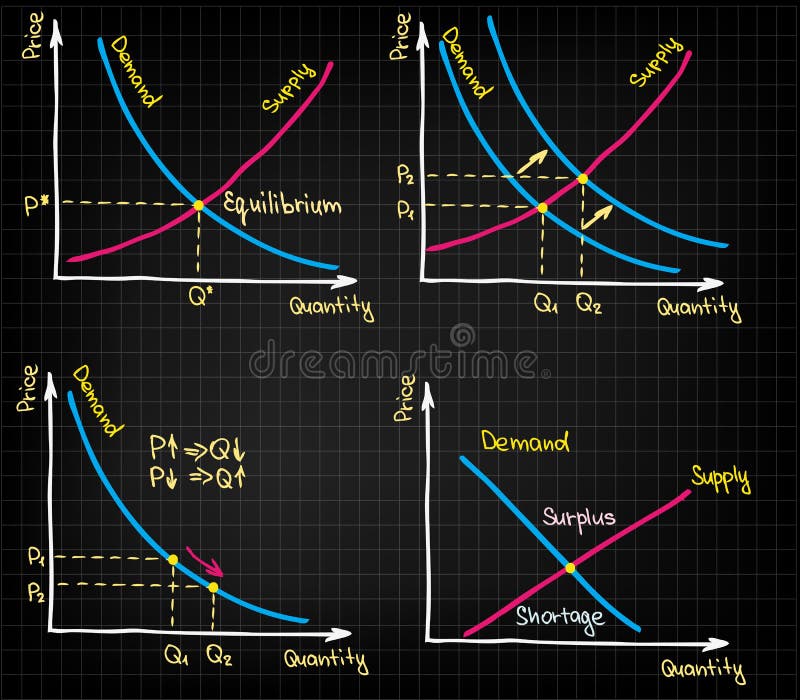
Free with trial Demand Supply Charts. Sketched charts and graphs of supply and demand. Decrease charts vectors Demand Supply Charts. Sketched charts and graphs of supply and demand
Free with trial Charts. A collection of Vector stock diagrams and pie charts on a white background. Decrease charts vectors Charts. A collection of Vector stock diagrams and pie charts on a white background
Free with trial Crisis. Graphs and charts templates. Business infographics. Statistic and data, bankruptcy, financial crisis, money loss, down arrow, economy reduction. Financial chart. Vector illustration. Decrease charts vectors Crisis. Graphs and charts templates. Business infographics. Statistic and data, bankruptcy, financial crisis, money loss, down. Arrow, economy reduction. Crisis. Graphs and charts templates. Business infographics. Statistic and data, bankruptcy, financial crisis, money loss, down arrow, economy reduction. Financial chart. Vector illustration
Free with trial Square guyis running away from negative charts. Decrease charts vectors Square guy-Chasing negative charts. Square guyis running away from negative charts. Square guyis running away from negative charts.
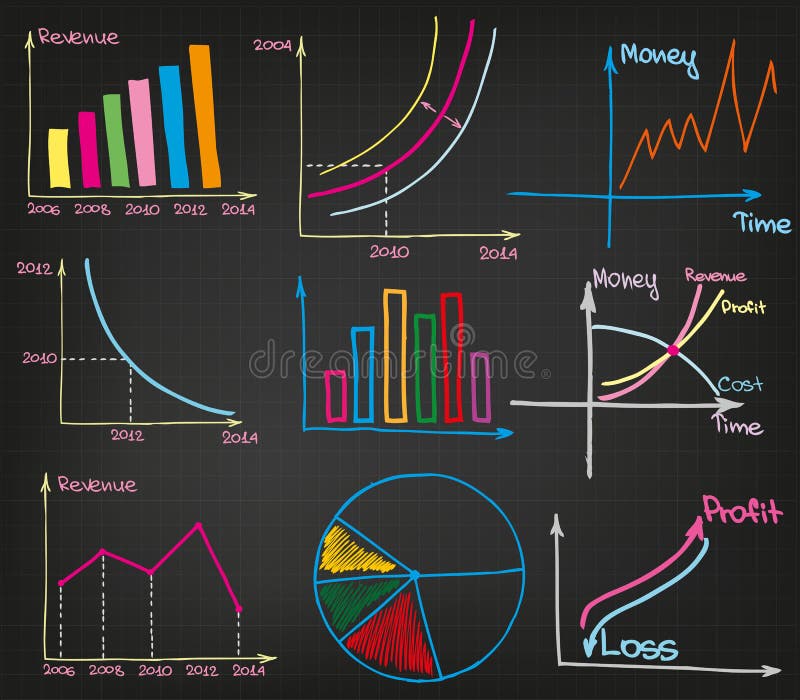
Free with trial Profit Charts. Different kinds of set for business charts. Decrease charts vectors Profit Charts. Different kinds of set for business charts
Free with trial The hands are holding a tablets with stock quote charts on the screens. The fall and increase in the shares price graphs. The trader`s computers, sell, buy buttons. Business flat concept illustration. Decrease charts vectors The tablet computers with stock quote charts on the screens. The hands are holding a tablets with stock quote charts on the screens. The fall and increase in. The hands are holding a tablets with stock quote charts on the screens. The fall and increase in the shares price graphs. The trader`s computers, sell, buy buttons. Business flat concept illustration.
Free with trial Crisis. Graphs and charts templates. Business infographics. Statistic and data, bankruptcy, financial crisis, money loss, down arrow, economy reduction. Financial chart. Vector illustration. Decrease charts vectors Crisis. Graphs and charts templates. Business infographics. Statistic and data, bankruptcy, financial crisis, money loss, down. Arrow, economy reduction. Crisis. Graphs and charts templates. Business infographics. Statistic and data, bankruptcy, financial crisis, money loss, down arrow, economy reduction. Financial chart. Vector illustration
Free with trial Coronavirus infographics vector diagrams, statistics and info charts. Covid-19 virus infection quarantine by years, disease recovery and death percent share charts, viral epidemic infographics. Decrease charts vectors Coronavirus infection infographic charts and info. Coronavirus infographics vector diagrams, statistics and info charts. Covid-19 virus infection quarantine by. Coronavirus infographics vector diagrams, statistics and info charts. Covid-19 virus infection quarantine by years, disease recovery and death percent share charts, viral epidemic infographics
Free with trial Graphic business ratings and charts collection. Infographic elements. Decrease charts vectors Graphic business ratings and charts collection. Infographic elements
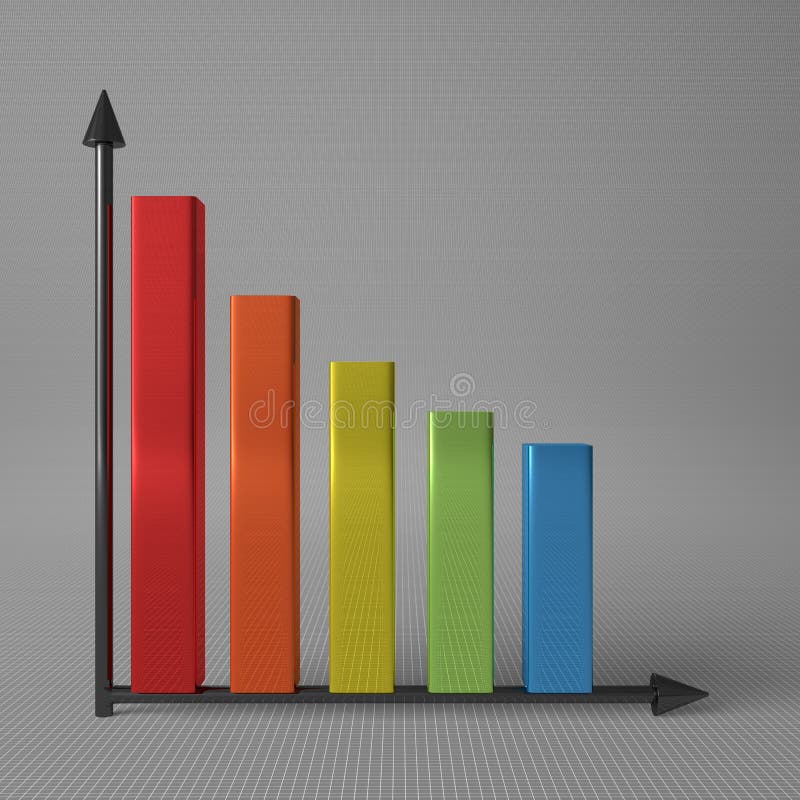
Free with trial Bar chart with axis. Multicolor glossy bar chart showing decrease, with two black axis, standing on gray background, front view. Decrease charts illustrations Bar chart with axis. Multicolor glossy bar chart showing decrease, with two black axis, standing on gray background, front view
Free with trial 3d red arrow crashing down with falling stock market bar charts, economic recession, financial crisis and market crash illustration. Generative AI. Decrease charts illustrations 3d red arrow crashing down with falling stock market bar charts economic recession financial crisis and market crash. 3d red arrow crashing down with falling. 3d red arrow crashing down with falling stock market bar charts, economic recession, financial crisis and market crash illustration. Generative AI
Free with trial This 3D rendering showcases a downward trending red arrow overlaid on a staircase, visually representing a declining market. The bar graph at the bottom further emphasizes the decrease. This image was generated by AI, ideal for illustrating financial news or presentations. Decrease charts illustrations Falling Market Trend. This 3D rendering showcases a downward trending red arrow overlaid on a staircase, visually representing a declining market. The bar graph. This 3D rendering showcases a downward trending red arrow overlaid on a staircase, visually representing a declining market. The bar graph at the bottom further emphasizes the decrease. This image was generated by AI, ideal for illustrating financial news or presentations.
Free with trial Businessman holding digital charts bars and red arrow. In his hand. Decrease charts illustrations Businessman holding digital charts bars and red arrow. In his hand
Free with trial Businessman using digital flying charts and bars interface. Businessman using digital tactile flying charts and bars screen over his hand. Decrease charts illustrations Businessman using digital flying charts and bars interface. Businessman using digital tactile flying charts and bars screen over his hand
Free with trial Charts and Diagrams icons. Report, 3D Chart, Block diagram and Dot Plot graph icons. Trend, Pyramid and Pie chart report symbols. Presentation infochart, process flow diagram. Quality set. Vector. Decrease charts vectors Charts and Diagrams icons. Set of 3D Chart, Block diagram and Dot Plot graph icons. Vector. Charts and Diagrams icons. Report, 3D Chart, Block diagram and Dot. Charts and Diagrams icons. Report, 3D Chart, Block diagram and Dot Plot graph icons. Trend, Pyramid and Pie chart report symbols. Presentation infochart, process flow diagram. Quality set. Vector
Free with trial Charts and graphs icons. Infochart, Block diagram and Algorithm. Presentation classic icon set Quality set. Vector. Decrease charts vectors Charts and graphs icons. Infochart, Block diagram and Algorithm. Classic icon set. Vector. Charts and graphs icons. Infochart, Block diagram and Algorithm. Charts and graphs icons. Infochart, Block diagram and Algorithm. Presentation classic icon set Quality set. Vector
Free with trial Carbon Dioxide CO2 Charts and Graphs colored vector icons. Carbon Dioxide CO2 Charts and Graphs colored concept vector icons set or design elements collection. Decrease charts vectors Carbon Dioxide CO2 Charts and Graphs colored vector icons. Carbon Dioxide CO2 Charts and Graphs colored concept vector icons set or design elements collection
Free with trial Businessman sleeping with charts, graphs and reports concept. Young businessman sleeping with charts, graphs and reports on the background. Decrease charts illustrations Businessman sleeping with charts, graphs and reports concept. Young businessman sleeping with charts, graphs and reports on the background
Free with trial An illustration featuring a laptop computer set against chart style background - one with green arrow pointing up and red arrow pointing down. Decrease charts illustrations Computer Chart Up and Down. An illustration featuring a laptop computer set against chart style background - one with green arrow pointing up and red arrow. An illustration featuring a laptop computer set against chart style background - one with green arrow pointing up and red arrow pointing down
Free with trial Graph. 3d rendering graph on business chart. Decrease charts vectors Graph. 3d rendering graph on business chart
Free with trial Diagram. An image showing a diagram which has a puzzle effect over the six main columns and a shadow behind with a red upward stroke over the top. Decrease charts illustrations Diagram. An image showing a diagram which has a puzzle effect over the six main columns and a shadow behind with a red upward stroke over the top
Free with trial Graph up and down. Note paper with graph up and down. Decrease charts illustrations Graph up and down. Note paper with graph up and down
Free with trial An illustration showing financial fluctuation on a board. Decrease charts vectors Vector statistics. An illustration showing financial fluctuation on a board. An illustration showing financial fluctuation on a board.
Free with trial Statistic. Data analysis. Business and financial concept. Decrease charts vectors Statistic. Data analysis. Business and financial concept
Free with trial Graph. 3d rendering graph on business chart. Decrease charts vectors Graph. 3d rendering graph on business chart
Free with trial A colourful illustration showing financial fluctuation on a board. Decrease charts vectors Vector Istatistik. A colourful illustration showing financial fluctuation on a board. A colourful illustration showing financial fluctuation on a board.
Free with trial Growth bar chart and red arrow. Moving down. Decrease charts illustrations Growth bar chart and red arrow. Moving down
Free with trial A colourful illustration showing financial fluctuation on a board. Decrease charts vectors Vector Istatistik. A colourful illustration showing financial fluctuation on a board. A colourful illustration showing financial fluctuation on a board.
Free with trial Analytical Reports Icon with Outline Style and Editable Stroke. Stack of Reports with Graphs and Charts. Decrease charts vectors Analytical Reports Icon with Outline Style and Editable Stroke. Stack of Reports with Graphs and Charts
Free with trial Cool infographics business planner for your business or marketing presentation for a monthly task. These are vector infographs that help you to give a great data visualization examples to your clients or partners. Available in EPS when you download. Decrease charts vectors Infographics - Business Planner. Cool infographics business planner for your business or marketing presentation for a monthly task. These are vector infographs. Cool infographics business planner for your business or marketing presentation for a monthly task. These are vector infographs that help you to give a great data visualization examples to your clients or partners. Available in EPS when you download.
Free with trial Cool infographics demonstrating business opportunities. These are vector infographs that help you to give a great data visualization examples to your clients or partners. Available in EPS when you download. Decrease charts vectors Infographics - Business Opportunities. Cool infographics demonstrating business opportunities. These are vector infographs that help you to give a great data. Cool infographics demonstrating business opportunities. These are vector infographs that help you to give a great data visualization examples to your clients or partners. Available in EPS when you download.
Free with trial Business Analyst Set. With diagrams and charts isometric isolated vector illustration. Decrease charts vectors Business Analyst Set. With diagrams and charts isometric isolated vector illustration
Free with trial Isometric world financial crisis flowchart composition with icons of bar charts people losing money with arrows vector illustration. Decrease charts vectors Financial Crisis Isometric Flowchart. Isometric world financial crisis flowchart composition with icons of bar charts people losing money with arrows vector. Isometric world financial crisis flowchart composition with icons of bar charts people losing money with arrows vector illustration
Free with trial Vector collection of business elements. Graph and charts. Decrease charts illustrations Vector collection of business elements. Graph and charts
Free with trial Revenue Expenses. Financials charts pf Revenue, Growth and Expenses. Decrease charts vectors Revenue Expenses. Financials charts pf Revenue, Growth and Expenses
Free with trial Revenue Expenses. Financials charts pf Revenue, Growth and Expenses. Decrease charts vectors Revenue Expenses. Financials charts pf Revenue, Growth and Expenses
 Sign in