Free with trial Silhouette of a businessman facing a city skyline with a falling graph. Decrease crash illustrations Business recession economy decline downward trend. Silhouette of a businessman facing a city skyline with a falling graph
Free with trial A simple line drawing depicts a magnifying glass focusing on a declining bar chart with a downward arrow and zig-zag. Decrease crash illustrations Declining Market Analysis Magnifying Glass, Downward Trend Chart. A simple line drawing depicts a magnifying glass focusing on a declining bar chart with a downward arrow and zig-zag.
Free with trial Bar graph illustrating financial downturn, with a red arrow pointing down and a dollar sign. Economic recession concept. Decrease crash vectors Financial graph showing decline with dollar sign and red arrow. Bar graph illustrating financial downturn, with a red arrow pointing down and a dollar sign. Economic recession concept
Free with trial A 3D rendered image depicts a golden downward-sloping arrow positioned over a series of golden bars representing a declining bar chart. A golden coin with a dollar symbol and the inscription "ONE COONIT ES OF BERIC 1909" is shown above the chart, further emphasizing a financial downturn. The image is set against a white background. Decrease crash illustrations Golden Downward Trend Arrow Over Declining Bar Chart with Coin finance economy. A 3D rendered image depicts a golden downward-sloping arrow positioned over a series of golden bars representing a declining bar chart. A golden coin with a dollar symbol and the inscription "ONE COONIT ES OF BERIC 1909" is shown above the chart, further emphasizing a financial downturn. The image is set against a white background
Free with trial Business go bankruptcy icon, economic crisis and money loss, downturn symbol, features closed store, kiosk, or shop building. Isolated vector linear sign of financial distress, wrong niche selection. Decrease crash vectors Business go bankruptcy icon, crisis and money loss. Business go bankruptcy icon, economic crisis and money loss, downturn symbol, features closed store, kiosk, or shop building. Isolated vector linear sign of financial distress, wrong niche selection
Free with trial Bitcoin coin lying on a red chart showing decreasing value and market volatility. Decrease crash illustrations Bitcoin cryptocurrency falling market value graph down. Bitcoin coin lying on a red chart showing decreasing value and market volatility
Free with trial Reduce inflation by increase interest rate, Entrepreneur using a needle to pop a balloon representing inflation with a price tag attached. Decrease crash vectors Reduce inflation by increase interest rate, Entrepreneur using a needle to pop a balloon representing inflation with a price tag
Free with trial A minimalist line icon depicting strategic analysis. Decrease crash illustrations Strategic Analysis Knight, Graph, Magnifying Glass Icon. A minimalist line icon depicting strategic analysis.
Free with trial This minimalist vector illustration depicts a downward trending line graph alongside a bar chart that appears to be shattering or breaking apart. The color palette utilizes high-contrast red and dark gray tones to emphasize a sense of urgency and economic instability. The clean lines and geometric shapes create a professional yet dramatic visual representation of loss, failure, or market. Decrease crash vectors A red line graph shows a sharp decline in performance and financial market value. This minimalist vector illustration depicts a downward trending line graph alongside a bar chart that appears to be shattering or breaking apart. The color palette utilizes high-contrast red and dark gray tones to emphasize a sense of urgency and economic instability. The clean lines and geometric shapes create a professional yet dramatic visual representation of loss, failure, or market
Free with trial A simple icon showing a line graph with a zigzag pattern trending upwards to the right, indicating positive growth or increase. Below the graph, a straight-lined arrow points upward, reinforcing the sense of rising trend. The entire illustration is enclosed within a circle, suggesting focus on graphs or analytics. The design uses clean, black lines on a white background for a clear, minimalist appearance. Decrease crash vectors Market Loss Analysis and Negative Trend Graph Icon. A simple icon showing a line graph with a zigzag pattern trending upwards to the right, indicating positive growth or increase. Below the graph, a straight-lined arrow points upward, reinforcing the sense of rising trend. The entire illustration is enclosed within a circle, suggesting focus on graphs or analytics. The design uses clean, black lines on a white background for a clear, minimalist appearance.
Free with trial Night city, red graph decline, road, blurred lights, financial downturn. Decrease crash illustrations Night city, red graph decline, road, blurred lights, financial downturn
Free with trial Sharp downward trend line on graph red color rapid freefall business Ideal for websites and social media. Decrease crash illustrations Sharp downward trend line on graph, red color, rapid, freefall, business. Sharp downward trend line on graph red color rapid freefall business Ideal for websites and social media
Free with trial Economic crisis line icon of savings depreciation, economy downturn and bankruptcy, vector symbol. Banking business and money savings depreciation icon of piggy bank and arrow down of financial crisis. Decrease crash vectors Economic crisis line icon of savings depreciation
Free with trial Prepare for economic downfall, Considerate businessman with skateboard getting ready to race down a financial chart. Decrease crash vectors Prepare for economic downfall, Considerate businessman with skateboard getting ready to race down a financial chart
Free with trial Sharp downward sloping line graph red arrow pointing down background red Suitable for digital platforms. Decrease crash illustrations Sharp downward sloping line graph, red arrow pointing down, background, red. Sharp downward sloping line graph red arrow pointing down background red Suitable for digital platforms
Free with trial This 3D rendering shows a downward trending arrow, generated by AI, dramatically illustrating a market downturn or economic decline. The visual is clean and impactful, suitable for presentations or reports on financial trends. It represents a clear visual metaphor for negative growth and instabilit. Decrease crash illustrations AI-Generated Market Decline. This 3D rendering shows a downward trending arrow, generated by AI, dramatically illustrating a market downturn or economic decline. The visual is clean and impactful, suitable for presentations or reports on financial trends. It represents a clear visual metaphor for negative growth and instabilit
Free with trial An detailed line art illustration of a dog bone stylized as a diagonal downward arrow, representing negative trends or decline. Decrease crash vectors Dog bone shaped as a downward arrow indicating decline. An detailed line art illustration of a dog bone stylized as a diagonal downward arrow, representing negative trends or decline
Free with trial A red bar chart illustrates a significant decline with a bold red arrow pointing downwards, symbolizing financial loss, market downturn, or negative growth. Decrease crash illustrations Red bar chart showing downward trend and falling arrow. A red bar chart illustrates a significant decline with a bold red arrow pointing downwards, symbolizing financial loss, market downturn, or negative growth
Free with trial Visualize the bear market with this striking 3D cartoon bear illustration. A prominent red downward arrow emphasizes the bearish sentiment, representing a decline in financial trends. This powerful concept visualizes falling stock market values, showcasing the potential for loss and failure in investment. This image is ideal for illustrating articles on economy, finance, and trading, particularly. Decrease crash illustrations Bear market concept depicted by a brown cartoon bear with a red downward arrow representing declining financial trends. Visualize the bear market with this striking 3D cartoon bear illustration. A prominent red downward arrow emphasizes the bearish sentiment, representing a decline in financial trends. This powerful concept visualizes falling stock market values, showcasing the potential for loss and failure in investment. This image is ideal for illustrating articles on economy, finance, and trading, particularly
Free with trial Broken 3D bar chart highlighting severe financial losses and business downturn. Decrease crash illustrations Broken 3D Bar Chart Indicating Significant Business Financial Losses and Performance Decline. Broken 3D bar chart highlighting severe financial losses and business downturn
Free with trial Smartphone with Downward Arrow Financial Decline Concept, illustration. Decrease crash vectors Smartphone with Downward Arrow Financial Decline Concept
Free with trial Business finance chart illustrating decline. Red arrow points down, indicating loss or recession. Dollar symbol beside bars. Decrease crash vectors Financial graph showing downward trend with dollar sign. Business finance chart illustrating decline. Red arrow points down, indicating loss or recession. Dollar symbol beside bars
Free with trial A striking visual representation of economic decline or market volatility. A bold red line graph plunges downwards against a textured, abstract background, suggesting a financial crisis or loss. The image evokes a sense of urgency and concern, suitable for illustrating concepts related to finance, economics, business, and market trends. The abstract background adds a modern and dynamic feel. Decrease crash illustrations Economic Downturn: Red Line Graph on Abstract Background. A striking visual representation of economic decline or market volatility. A bold red line graph plunges downwards against a textured, abstract background, suggesting a financial crisis or loss. The image evokes a sense of urgency and concern, suitable for illustrating concepts related to finance, economics, business, and market trends. The abstract background adds a modern and dynamic feel.
Free with trial A hand holds a red pen and sketches a downwardpointing arrow on a white paper this represents financial decline, market downturns, or business losses illustrating a concept of economic recession or investment failure , dreamy and soft background gradient. Decrease crash illustrations Hand drawing downward red arrow on white paper using pen for business and finance concepts. a hand holds a red pen and sketches a downwardpointing arrow on a white paper this represents financial decline, market downturns, or business losses illustrating a concept of economic recession or investment failure , dreamy and soft background gradient
Free with trial Red financial graph with bars and lines depicting a market decline. Isolated on a white background. Concept of financial crisis and recession. 3D Rendering. Decrease crash illustrations Red financial graph showing market decline on white background. 3D Rendering. Red financial graph with bars and lines depicting a market decline. Isolated on a white background. Concept of financial crisis and recession. 3D Rendering
Free with trial Close up of euro coins stack diminishing in size currency uncertainty AI-generated for unique and creative designs. Decrease crash illustrations Close up of euro coins, stack diminishing in size, currency, uncertainty. Close up of euro coins stack diminishing in size currency uncertainty AI-generated for unique and creative designs
Free with trial This 3D rendering illustrates the dynamic journey of financial markets. It depicts a series of bar graphs on a dark, reflective surface, showcasing different stages of economic activity. From steady growth and fluctuating upward trends, the visualization culminates in a dramatic market collapse, where a tall bar graph shatters into pieces. This powerful image represents concepts of business success, market volatility, economic downturns, and financial crises, making it ideal for reports, presentations, and articles on investment risks and market analysis. Decrease crash illustrations Financial Market Dynamics: Growth, Volatility, and Collapse. This 3D rendering illustrates the dynamic journey of financial markets. It depicts a series of bar graphs on a dark, reflective surface, showcasing different stages of economic activity. From steady growth and fluctuating upward trends, the visualization culminates in a dramatic market collapse, where a tall bar graph shatters into pieces. This powerful image represents concepts of business success, market volatility, economic downturns, and financial crises, making it ideal for reports, presentations, and articles on investment risks and market analysis.
Free with trial Against a red backdrop a blue coin with a dollar sign is penetrated by a green arrow pointing downward symbolizing financial loss economic downturn and stock market decline This image was generated with AI. Decrease crash illustrations Dollar Decline Illustrating Economic Downturn and Financial Crisis with a Green Arrow Pointing Downward on a Dollar Coin. Against a red backdrop a blue coin with a dollar sign is penetrated by a green arrow pointing downward symbolizing financial loss economic downturn and stock market decline This image was generated with AI.
Free with trial A light blue umbrella shelters from a downpour of red downward-pointing arrows, symbolizing protection against market decline. A large red arrow also falls, emphasizing the overall negative trend. The scene is set against a cloudy sky on a gray ground. Decrease crash illustrations Blue Umbrella Sheltering from Falling Red Arrows. A light blue umbrella shelters from a downpour of red downward-pointing arrows, symbolizing protection against market decline. A large red arrow also falls, emphasizing the overall negative trend. The scene is set against a cloudy sky on a gray ground
Free with trial Steeply falling graph dark background dramatic drop illustration trend drop Vector illustration for high-quality printing. Decrease crash illustrations Steeply falling graph, dark background, dramatic drop, illustration, trend, drop. Steeply falling graph dark background dramatic drop illustration trend drop Vector illustration for high-quality printing
Free with trial Growth financial business on white background. Isolated 3D illustration. Decrease crash illustrations Growth financial business on white background. Isolated 3D illustration
Free with trial A conceptual 3D illustration shows several black oil barrels. One barrel is tipped over, with black oil spilling out onto a white surface. A large red arrow points downwards towards the spilled oil, symbolizing a decline or crisis related to oil prices or production. The scene is set against a plain white background. Decrease crash illustrations Black Oil Barrels With One Tipped Over Spilling Oil And A Red Downward Arrow image photo. A conceptual 3D illustration shows several black oil barrels. One barrel is tipped over, with black oil spilling out onto a white surface. A large red arrow points downwards towards the spilled oil, symbolizing a decline or crisis related to oil prices or production. The scene is set against a plain white background
Free with trial A red arrow drop-down with table on a white background. Businese concept. Decrease crash vectors A red arrow drop-down with table on white background. Businese concept
Free with trial A clean, minimal studio scene featuring a rustic barrel beside a wooden house model, showcasing simplicity and elegance in design, perfect for artistic projects. Decrease crash illustrations Minimalist Studio Scene with Wooden House and Rusty Barrel. A clean, minimal studio scene featuring a rustic barrel beside a wooden house model, showcasing simplicity and elegance in design, perfect for artistic projects
Free with trial A 3d bar graph showing a downward trend with a red arrow indicating decline, representing business loss. Decrease crash vectors Bar chart with red arrow pointing down on white background. A 3d bar graph showing a downward trend with a red arrow indicating decline, representing business loss
Free with trial A blue umbrella shelters a descending red graph line, represented by numerous small red arrows hanging from the umbrella. The scene is set against a dark, rainy backdrop. Decrease crash illustrations Blue Umbrella and Descending Red Graph with Arrows. A blue umbrella shelters a descending red graph line, represented by numerous small red arrows hanging from the umbrella. The scene is set against a dark, rainy backdrop
Free with trial Illustration of bear and arrow up. Ai illustration. Decrease crash illustrations Illustration of bear and arrow up Ai illustration
Free with trial A sharp, reflective red arrow points downward on a neutral background. Decrease crash illustrations A glossy red arrow curves downwards indicating a significant decline or negative trend. A sharp, reflective red arrow points downward on a neutral background
Free with trial A sharp red zigzag arrow points downwards, symbolizing a significant decline or negative trend in a graph or chart, isolated on a clean white background. Decrease crash illustrations Red zigzag arrow pointing down isolated on white background. A sharp red zigzag arrow points downwards, symbolizing a significant decline or negative trend in a graph or chart, isolated on a clean white background
Free with trial An detailed line art illustration of a dog on a chart showing a decline or loss. Decrease crash vectors Dachshund standing on a downward financial arrow trend line. An detailed line art illustration of a dog on a chart showing a decline or loss
Free with trial Red falling bar chart with arrow, business decline concept, loss and failure symbol. Economic recession illustration. Decrease crash illustrations Red bar graph with declining arrow on white background grid. Red falling bar chart with arrow, business decline concept, loss and failure symbol. Economic recession illustration
Free with trial 3D rendering of various financial charts and graphs in red and pink tones on a white background. Concept of business analytics. Decrease crash illustrations 3D Rendering of financial charts and graphs on a white background. 3D Rendering. 3D rendering of various financial charts and graphs in red and pink tones on a white background. Concept of business analytics
Free with trial This modern art piece features a rusty barrel beside a miniature house, highlighting contrasts in texture and form, ideal for artistic and architectural themes. Decrease crash illustrations Modern Conceptual Art with Rusty Barrel and Miniature House. This modern art piece features a rusty barrel beside a miniature house, highlighting contrasts in texture and form, ideal for artistic and architectural themes
Free with trial This minimalist vector illustration depicts a downward-trending line graph representing economic decline. Two distinct lines in red and green descend sharply, accompanied by floating currency symbols and percentage indicators. The clean, flat design uses a simple color palette against a white background to communicate concepts of financial loss, market volatility and economic instability. Decrease crash vectors A line graph showing a downward trend in financial market performance and currency value. This minimalist vector illustration depicts a downward-trending line. This minimalist vector illustration depicts a downward-trending line graph representing economic decline. Two distinct lines in red and green descend sharply, accompanied by floating currency symbols and percentage indicators. The clean, flat design uses a simple color palette against a white background to communicate concepts of financial loss, market volatility and economic instability
Free with trial Black zigzag arrow pointing down with text DEVALUATION SHOCK on white background. Clear details and vibrant co. Decrease crash illustrations Devaluation shock zigzag arrow pointing down icon image photo. Black zigzag arrow pointing down with text DEVALUATION SHOCK on white background. Clear details and vibrant co
Free with trial Bar chart and red arrow indicate a negative trend and economic recession. Represents financial crisis and business loss. Decrease crash vectors Financial graph showing declining sales and economic downturn. Bar chart and red arrow indicate a negative trend and economic recession. Represents financial crisis and business loss
Free with trial Bar graph showing decreasing values, financial downturn, negative trend, data analysis, loss, economic decline, risk. Decrease crash illustrations Blue bar chart indicates decline and negative trend over time. Bar graph showing decreasing values, financial downturn, negative trend, data analysis, loss, economic decline, risk
Free with trial Explore the economic implications of supply chain disruptions on the housing market, highlighting the relationship between oil prices and real estate challenges. Decrease crash illustrations Economic Impact of Supply Chain Disruptions on Housing Market. Explore the economic implications of supply chain disruptions on the housing market, highlighting the relationship between oil prices and real estate challenges
Free with trial A bear market depression, brown bear in market. stock going down graph background. Decrease crash illustrations Bear market depression, brown bear in market. stock going down graph background
Free with trial Hand Pointing at Bearish Candlestick Chart, stock market concept, illustration. Decrease crash vectors Hand Pointing at Bearish Candlestick Chart, stock market concept
Free with trial Visual representation of decline or negative trend. Downward arrow over a multi-colored bar chart, signifying reduction or decrease. Decrease crash vectors Red arrow pointing down at colorful decreasing bar chart graph. Visual representation of decline or negative trend. Downward arrow over a multi-colored bar chart, signifying reduction or decrease
Free with trial Three stacks of golden coins showing a downward trend, indicated by a sharp red arrow, suggesting financial decline or loss. Decrease crash illustrations Gold coin stacks with descending red arrow on white background. Three stacks of golden coins showing a downward trend, indicated by a sharp red arrow, suggesting financial decline or loss
Free with trial Sharp downward sloping line graph red arrow pointing down analytics plunge Suitable for digital platforms. Decrease crash illustrations Sharp downward sloping line graph, red arrow pointing down, analytics, plunge. Sharp downward sloping line graph red arrow pointing down analytics plunge Suitable for digital platforms
Free with trial Bitcoin Facing Market Downturn with Falling Crypto Graph, Cryptocurrency Volatility Concept, illustration. Decrease crash illustrations Bitcoin Facing Market Downturn with Falling Crypto Graph, Cryptocurrency Volatility Concept
Free with trial A 3D financial visualization showing a sharp economic decline. A red downward arrow crashes through green and red bar charts, representing market loss, recession, and the impact on workforce and societ. Decrease crash illustrations 3D Economic Crisis Graph with Falling Red Arrow and People Icons. A 3D financial visualization showing a sharp economic decline. A red downward arrow crashes through green and red bar charts, representing market loss, recession, and the impact on workforce and societ
Free with trial A 3D financial visualization showing a sharp economic decline. A red downward arrow crashes through green and red bar charts, representing market loss, recession, and the impact on workforce and societ. Decrease crash illustrations 3D Economic Crisis Graph with Falling Red Arrow and People Icons. A 3D financial visualization showing a sharp economic decline. A red downward arrow crashes through green and red bar charts, representing market loss, recession, and the impact on workforce and societ
Free with trial A 3D financial visualization showing a sharp economic decline. A red downward arrow crashes through green and red bar charts, representing market loss, recession, and the impact on workforce and societ. Decrease crash illustrations 3D Economic Crisis Graph with Falling Red Arrow and People Icons. A 3D financial visualization showing a sharp economic decline. A red downward arrow crashes through green and red bar charts, representing market loss, recession, and the impact on workforce and societ
Free with trial A 3D financial visualization showing a sharp economic decline. A red downward arrow crashes through green and red bar charts, representing market loss, recession, and the impact on workforce and societ. Decrease crash illustrations 3D Economic Crisis Graph with Falling Red Arrow and People Icons. A 3D financial visualization showing a sharp economic decline. A red downward arrow crashes through green and red bar charts, representing market loss, recession, and the impact on workforce and societ
Free with trial Online finance crisis. Man with briefcase near smartphone with falling graphs and diagrams. Economical crisis and recession, inflation. Sad trader and investor. Flat vector illustration. Decrease crash vectors Online finance crisis. Man with briefcase near smartphone with falling graphs and diagrams. Economical crisis and recession
Free with trial A dark blue umbrella shields from a downpour of red downward-pointing arrows, representing protection against falling values, set against a stormy sky and a declining red graph. Decrease crash illustrations Umbrella, Downward Arrows, and Declining Graph in Stormy Weather. A dark blue umbrella shields from a downpour of red downward-pointing arrows, representing protection against falling values, set against a stormy sky and a declining red graph
Free with trial Steep downward trending line graph red arrow concept stock market collapse AI-generated for unique and creative designs. Decrease crash illustrations Steep downward trending line graph, red arrow , concept, stock market, collapse. Steep downward trending line graph red arrow concept stock market collapse AI-generated for unique and creative designs
Free with trial A 3D illustration of a red arrow piercing a silver shield, set against a graph with a downward trend, symbolizing decline, risk, and vulnerability in a financial or business context. Decrease crash illustrations A red arrow piercing a silver shield on a graph with a downward trend. A 3D illustration of a red arrow piercing a silver shield, set against a graph with a downward trend, symbolizing decline, risk, and vulnerability in a financial or business context.
Free with trial A 3D illustration of a red arrow piercing a silver shield, set against a graph with a downward trend, symbolizing decline, risk, and vulnerability in a financial or business context. Decrease crash illustrations A red arrow piercing a silver shield on a graph with a downward trend. A 3D illustration of a red arrow piercing a silver shield, set against a graph with a downward trend, symbolizing decline, risk, and vulnerability in a financial or business context.
Free with trial A conceptual image featuring a miniature shopping trolley with a large red jagged arrow pointing downwards, symbolizing falling prices, economic recession, or retail discounts on a wooden surface. Decrease crash illustrations Red Downward Arrow in Shopping Cart Symbolizing Falling Prices. A conceptual image featuring a miniature shopping trolley with a large red jagged arrow pointing downwards, symbolizing falling prices, economic recession, or retail discounts on a wooden surface
Free with trial A 3D rendering depicts a golden dollar coin rolling down a downward-sloping arrow that is superimposed over a bar graph. The bar graph shows a clear decline in height from left to right, with the tallest bar on the far left and the shortest on the far right. The golden arrow points downwards, mirroring the trend of the graph. The dollar coin, with its prominent dollar sign, is positioned at the. Decrease crash illustrations Golden Dollar Coin Falling Downward Arrow Graph Showing Financial Decline finance economy. A 3D rendering depicts a golden dollar coin rolling down a downward-sloping arrow that is superimposed over a bar graph. The bar graph shows a clear decline in height from left to right, with the tallest bar on the far left and the shortest on the far right. The golden arrow points downwards, mirroring the trend of the graph. The dollar coin, with its prominent dollar sign, is positioned at the
Free with trial Bankruptcy, economic crisis and money loss line icon. Business money loss, company bankruptcy gander or economic recession risk outline vector icon. Financial problem symbol with broken piggybank. Decrease crash vectors Bankruptcy, economic crisis and money loss icon. Bankruptcy, economic crisis and money loss line icon. Business money loss, company bankruptcy gander or economic recession risk outline vector icon. Financial problem symbol with broken piggybank
Free with trial Vector illustration of a dollar coin with a downward arrow, symbolizing financial loss, market decline, economic crisis, or business downturn in modern isometric style. Decrease crash vectors Vector illustration of a dollar coin with a downward arrow, symbolizing financial loss, market decline, economic crisis, or
Free with trial SP 500 stock with red arrow point down 3d rendering. Decrease crash illustrations SP 500 stock with red arrow point down
Free with trial 3D illustration with a symbol of the Yen and golden particles. Decrease crash illustrations 3D illustration Golden Yen Market. 3D illustration with a symbol of the Yen and golden particles
Free with trial 3D illustration with a symbol of the Yen and golden particles. Decrease crash illustrations 3D illustration Golden Yen Market. 3D illustration with a symbol of the Yen and golden particles
Free with trial This image showcases a creative concept featuring a rusty oil barrel, a wooden house, and a block chart. It symbolizes economic fluctuations and market trends in housing and resources. Decrease crash illustrations Creative Concept of Oil Barrel and Wooden House with Block Chart. This image showcases a creative concept featuring a rusty oil barrel, a wooden house, and a block chart. It symbolizes economic fluctuations and market trends in housing and resources
Free with trial A line drawing depicts a money bag, a downward trending graph, and a magnifying glass, symbolizing financial loss. Decrease crash illustrations Financial Loss Analysis Money Bag, Downward Graph, Magnifying Glass. A line drawing depicts a money bag, a downward trending graph, and a magnifying glass, symbolizing financial loss.
Free with trial Robot Pushing Bitcoin Downward Arrow, Crypto Market Decline Concept, illustration. Decrease crash illustrations Robot Pushing Bitcoin Downward Arrow, Crypto Market Decline Concept
Free with trial This minimalist image illustrates the tension between industrial decline and home stability. A rusted barrel leans against a wooden house, symbolizing balance and fragility. Decrease crash illustrations Minimalist Concept of Balance Between Industry and Home Stability. This minimalist image illustrates the tension between industrial decline and home stability. A rusted barrel leans against a wooden house, symbolizing balance and fragility
Free with trial A striking image depicting a large red arrow pointing sharply downward against a background of a falling stock market graph The image represents the concept of a financial crisis and market downturn Ideal for illustrating economic instability. Decrease crash illustrations Falling Stock Market Graph Red Arrow Down Global Financial Crisis Business Loss. A striking image depicting a large red arrow pointing sharply downward against a background of a falling stock market graph The image represents the concept of a financial crisis and market downturn Ideal for illustrating economic instability
Free with trial Interest rate and inflation percent impact economy, Percentage drop triggers chain reaction leading to businessman investor downfall. Decrease crash vectors Interest rate and inflation percent impact economy, Percentage drop triggers chain reaction leading to businessman investor
Free with trial A sharp, red zigzag arrow points downwards, visually representing a significant decline or negative trend in financial markets, economic performance, or any data set showing a downward trajectory. Decrease crash vectors Red downward trending arrow graphic, isolated on transparent background. A sharp, red zigzag arrow points downwards, visually representing a significant decline or negative trend in financial markets, economic performance, or any data set showing a downward trajectory
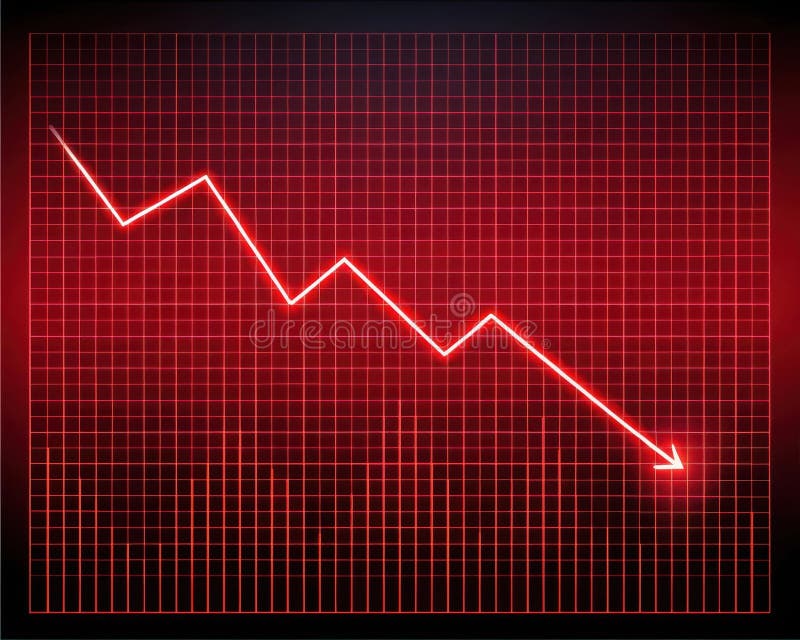
Free with trial A bright red line graph with a steep downward trend is displayed on a glowing red grid against a dark background. Decrease crash illustrations Bright Red Digital Line Graph Showing Steep Decline on Grid image. A bright red line graph with a steep downward trend is displayed on a glowing red grid against a dark background
Free with trial Declining bar graph with downward arrow icon hand drawn illustration. Decrease crash vectors Declining bar graph with downward arrow icon hand drawn illustration
Free with trial Unemployment line icon of unemployed man on labor market, vector symbol. Economic crisis, global financial downturn and bankruptcy icon of economy recession and unemployment problem. Decrease crash vectors Unemployment line icon, economic financial crisis. Unemployment line icon of unemployed man on labor market, vector symbol. Economic crisis, global financial downturn and bankruptcy icon of economy recession and unemployment problem