Free with trial Blue Global economic crisis icon isolated on blue background. World finance crisis. Minimalism concept. 3D render illustration. Decrease crash illustrations Blue Global economic crisis icon isolated on blue background. World finance crisis. Minimalism concept. 3D render
Free with trial A close-up shot of a Bitcoin coin against a background of a falling graph on a dark, moody background. Illustrates market downturn and financial loss. Image is generated using AI. Decrease crash illustrations Bitcoin Coin With Falling Chart. A close-up shot of a Bitcoin coin against a background of a falling graph on a dark, moody background. Illustrates market downturn and financial loss. Image is generated using AI
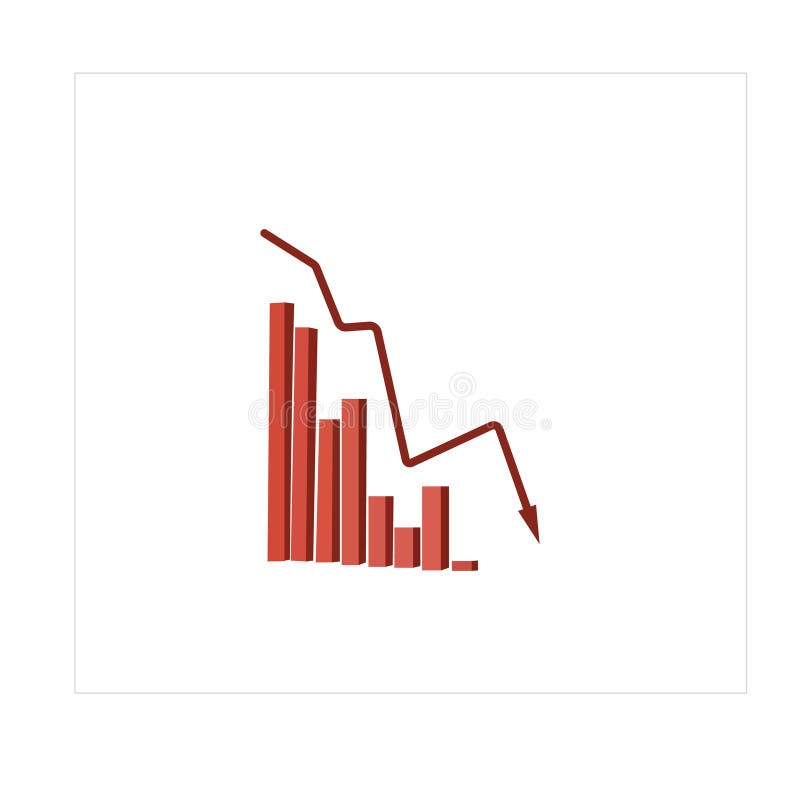
Free with trial Economic critical crisis concept. The bar garph with drop down arrow on red background. Recession financial, cryptocurrency, gold, and the stock market. Losing money and cash. Bearish. Decrease crash vectors Economic critical crisis concept. The bar garph with drop down arrow on red background. Recession financial, cryptocurrency, gold
Free with trial This comprehensive vector illustration features a set of 18 flat icons depicting various financial trends, market indicators, and warning signals. The collection includes rising and falling line graphs, bar charts, currency symbols (dollar and euro) indicating fluctuations, and alert symbols like sirens and exclamation marks. Ideal for illustrating concepts of economic growth, decline, market volatility, financial crisis, investment risks, and business performance. Perfect for presentations, reports, websites, and applications related to finance, economics, and stock markets. Decrease crash vectors Financial Trends, Market Indicators and Crisis Alert Icons Set. This comprehensive vector illustration features a set of 18 flat icons depicting various financial trends, market indicators, and warning signals. The collection includes rising and falling line graphs, bar charts, currency symbols (dollar and euro) indicating fluctuations, and alert symbols like sirens and exclamation marks. Ideal for illustrating concepts of economic growth, decline, market volatility, financial crisis, investment risks, and business performance. Perfect for presentations, reports, websites, and applications related to finance, economics, and stock markets.
Free with trial 3D Isometric Flat Vector Illustration of Real Estate Investment Risks, Fluctuations In Housing Prices. Decrease crash vectors 3D Isometric Flat Vector Illustration of Real Estate Investment Risks
Free with trial An abstract representation of a stock market decline is illustrated through a sharply descending red line graph against a dark, grid-like background. The red hues emphasize the severity of the drop, suggesting financial loss. Numerical data points faintly accompany the visual. This image was generat. Decrease crash illustrations Red Stock Decline. An abstract representation of a stock market decline is illustrated through a sharply descending red line graph against a dark, grid-like background. The red hues emphasize the severity of the drop, suggesting financial loss. Numerical data points faintly accompany the visual. This image was generat
Free with trial A conceptual image representing a downturn in the real estate market. A hand guides a red arrow pointing downwards towards a miniature house. The word "SALE" is formed by wooden blocks on top of a contract. A set of keys lies nearby. This visual symbolizes a decline in property values and sales, potentially due to economic factors or market trends. Suitable for articles, reports, and presentations on real estate, finance, and economics. Decrease crash illustrations Real Estate Market Downturn. A conceptual image representing a downturn in the real estate market. A hand guides a red arrow pointing downwards towards a miniature house. The word "SALE" is formed by wooden blocks on top of a contract. A set of keys lies nearby. This visual symbolizes a decline in property values and sales, potentially due to economic factors or market trends. Suitable for articles, reports, and presentations on real estate, finance, and economics.
Free with trial Purple Global economic crisis icon isolated on purple background. World finance crisis. Minimalism concept. 3D render illustration. Decrease crash illustrations Purple Global economic crisis icon isolated on purple background. World finance crisis. Minimalism concept. 3D render
Free with trial A flat design vector illustration depicting a financial market data board or stock ticker. The black-bordered display features various stock symbols, numerical values like '$ ,80K', '$ ,22,50', and indicators of market performance. Prominently highlighted in red is the word 'LOSING', accompanied by a red downward arrow signifying a price drop, and a red downward triangle. Conversely, a green upward arrow indicates a price increase. This icon effectively visualizes concepts of financial loss, gain, market volatility, and investment trends, suitable for business, finance, and economic content. Decrease crash illustrations Financial Market Data Board Icon with Loss and Gain Indicators. A flat design vector illustration depicting a financial market data board or stock ticker. The black-bordered display features various stock symbols, numerical values like '$ ,80K', '$ ,22,50', and indicators of market performance. Prominently highlighted in red is the word 'LOSING', accompanied by a red downward arrow signifying a price drop, and a red downward triangle. Conversely, a green upward arrow indicates a price increase. This icon effectively visualizes concepts of financial loss, gain, market volatility, and investment trends, suitable for business, finance, and economic content.
Free with trial Flat illustration of technical analysis with a magnifying glass on a yellow background. Stock market correction concept. Bankrupt financial information. Descending trading graph. Decrease crash vectors Flat illustration of technical analysis with a magnifying glass on a yellow background. Stock market correction concept. Bankrupt
Free with trial This Financial and Economic Crisis Solid Vector Glyph Icon Set featuring Market Drop, Profit Loss, Debt Load, World Recession, and Inflation for Business and Global Economy News is a critical visual resource for the finance and news sectors. The set features essential icons for market crashes, economic decline, and financial risk, making it an ideal choice for economic reports, banking apps, and business news platforms. The bold, solid design provides a serious and professional tone, ensuring that each symbol representing inflation, bankruptcy, and recession is clearly recognizable to a global audience. Use these high-quality vectors to illustrate the complexities of the modern economic landscape, financial stability, and global trade challenges in your next professional presentation or digital project, providing a clear and impactful visual language for economic analysis. Decrease crash vectors Financial Crisis Solid Icon Set with Market Drop, Profit Loss, Debt Load, World Recession, and Inflation. This Financial and Economic Crisis Solid Vector Glyph Icon Set featuring Market Drop, Profit Loss, Debt Load, World Recession, and Inflation for Business and Global Economy News is a critical visual resource for the finance and news sectors. The set features essential icons for market crashes, economic decline, and financial risk, making it an ideal choice for economic reports, banking apps, and business news platforms. The bold, solid design provides a serious and professional tone, ensuring that each symbol representing inflation, bankruptcy, and recession is clearly recognizable to a global audience. Use these high-quality vectors to illustrate the complexities of the modern economic landscape, financial stability, and global trade challenges in your next professional presentation or digital project, providing a clear and impactful visual language for economic analysis.
Free with trial A drawing of an Indian rupee coin falling through a spiral arrow and breaking into smaller blank coins over a black background showing economic recession alpha transparent. Decrease crash vectors Indian rupee falling into a downward spiral representing inflation and devaluation alpha transparent. A drawing of an Indian rupee coin falling through a spiral arrow and breaking into smaller blank coins over a black background showing economic recession alpha transparent.
Free with trial A comprehensive vector icon collection illustrating various aspects of financial crises, market downturns, and economic challenges. This set includes symbols like bull and bear market dynamics, broken shields representing risk and vulnerability, declining bar charts, candlestick patterns, and emergency indicators. Concepts such as bankruptcy, recession, financial loss, and market volatility are visually conveyed. Ideal for financial news, economic reports, business presentations, educational materials, and articles discussing market risks or economic forecasts. Decrease crash vectors Financial Crisis, Market Downturn, and Bankruptcy Vector Icons Set. A comprehensive vector icon collection illustrating various aspects of financial crises, market downturns, and economic challenges. This set includes symbols like bull and bear market dynamics, broken shields representing risk and vulnerability, declining bar charts, candlestick patterns, and emergency indicators. Concepts such as bankruptcy, recession, financial loss, and market volatility are visually conveyed. Ideal for financial news, economic reports, business presentations, educational materials, and articles discussing market risks or economic forecasts.
Free with trial Set line Mobile stock trading, Contract money and pen and Global economic crisis on seamless pattern. Vector. Decrease crash illustrations Set line Mobile stock trading, Contract money and pen and Global economic crisis on seamless pattern. Vector
Free with trial Set of Burning Money Set Collection, Burning Money Dollar Bill in Flame Illustration - Cash Fire Destruction, Financial Loss Concept, Wealth Waste or Protest, Isolated on White Background. Decrease crash vectors Set of Burning Money Set Collection, Burning Money Dollar Bill in Flame Illustration - Cash Fire Destruction, Financial Loss
Free with trial A collection of simple black glyph icons representing economic downturn, financial loss, bankruptcy, and recession. These icons are suitable for illustrating concepts related to investment risk, market crash, and personal finance issues. Decrease crash vectors Minimalist Black Glyph Economic Crisis and Financial Loss Icon Set. A collection of simple black glyph icons representing economic downturn, financial loss, bankruptcy, and recession. These icons are suitable for illustrating concepts related to investment risk, market crash, and personal finance issues.
Free with trial A 3D rendered red bar chart and line graph show a downward trend against a white grid background. The graph reflects a decline with a red arrow pointing down. Decrease crash illustrations Red downward trending bar chart and line graph on white grid image. A 3D rendered red bar chart and line graph show a downward trend against a white grid background. The graph reflects a decline with a red arrow pointing down
Free with trial This image visually represents a decreasing financial trend. Stacks of gold coins are arranged on a rustic wooden surface, decreasing in height from left to right. A prominent red downward-pointing arrow overlays the coins, clearly illustrating a negative economic trajectory or a decline in wealth, investments, or profits. The dark, textured wood background enhances the serious tone of financial downturn. The overall effect is a compelling visual metaphor for economic recession or loss. Decrease crash illustrations Declining Financial Growth Shown by Coins and Arrow. This image visually represents a decreasing financial trend. Stacks of gold coins are arranged on a rustic wooden surface, decreasing in height from left to right. A prominent red downward-pointing arrow overlays the coins, clearly illustrating a negative economic trajectory or a decline in wealth, investments, or profits. The dark, textured wood background enhances the serious tone of financial downturn. The overall effect is a compelling visual metaphor for economic recession or loss.
Free with trial Purple glassmorphism downward arrow chart icon, representing business loss, market drop, or negative metrics, 3d rendering. Decrease crash vectors Purple glassmorphism downward arrow chart icon, representing business loss, market drop, or negative metrics, 3d rendering
Free with trial Economy crisis flat composition with human hands holding calculator and economic recession financial symbols vector illustration. Decrease crash vectors Economy Crisis Composition. Economy crisis flat composition with human hands holding calculator and economic recession financial symbols vector illustration
Free with trial Financial crisis, business bankruptcy, money loss, and economy collapse concepts. Vector of crisis financial, bankruptcy and recession illustration. Decrease crash vectors Financial crisis, business bankruptcy, money loss, and economy collapse concepts
Free with trial A minimalist illustration of a downward pointing zigzag arrow, conveying decline, direction, and a sense of motion. Great for illustrating a negative trend or movement. Decrease crash vectors Simple Bold Zigzag Decline Arrow Direction Sign Symbol Icon Element. A minimalist illustration of a downward pointing zigzag arrow, conveying decline, direction, and a sense of motion. Great for illustrating a negative trend or movement.
Free with trial White Global economic crisis icon isolated with long shadow background. World finance crisis. Pink hexagon button. Vector. Decrease crash illustrations White Global economic crisis icon isolated with long shadow background. World finance crisis. Pink hexagon button
Free with trial Business go bankruptcy color line icon, economic crisis and money loss, downturn symbol. Closed store, kiosk, or shop building. Isolated vector linear sign of financial distress, fail and bankruptcy. Decrease crash illustrations Business go bankruptcy color icon, economic crisis. Business go bankruptcy color line icon, economic crisis and money loss, downturn symbol. Closed store, kiosk, or shop building. Isolated vector linear sign of financial distress, fail and bankruptcy
Free with trial Business go bankruptcy color line icon, economic crisis and money loss, downturn symbol. Closed store, kiosk, or shop building. Isolated vector linear sign of financial distress, fail and bankruptcy. Decrease crash vectors Business go bankruptcy color icon, economic crisis. Business go bankruptcy color line icon, economic crisis and money loss, downturn symbol. Closed store, kiosk, or shop building. Isolated vector linear sign of financial distress, fail and bankruptcy
Free with trial Business go bankruptcy color line icon, economic crisis and money loss, downturn symbol. Closed store, kiosk, or shop building. Isolated vector linear sign of financial distress, fail and bankruptcy. Decrease crash vectors Business go bankruptcy color icon, economic crisis. Business go bankruptcy color line icon, economic crisis and money loss, downturn symbol. Closed store, kiosk, or shop building. Isolated vector linear sign of financial distress, fail and bankruptcy
Free with trial Pink Searching for food in trash can on streets outdoors icon isolated on pink background. Homelessness and poverty concept. Minimalism concept. 3D render illustration. Decrease crash illustrations Pink Searching for food in trash can on streets outdoors icon isolated on pink background. Homelessness and poverty
Free with trial This graphic illustration depicts a stark representation of declining business performance. It features a bar chart with three colorful bars (yellow, orange, green) suggesting varying data points, overlaid with three distinct lines in yellow, blue, and orange, all sharply descending downwards. A prominent red arrow points downwards, emphasizing the negative trend. A small yellow plus sign is also visible, potentially signifying a point of reference or a contrasting element. The clean white background isolates the graphical elements, making them ideal for conveying concepts of loss, recession, or negative growth. Decrease crash illustrations Declining Business Graph with Downward Arrows. This graphic illustration depicts a stark representation of declining business performance. It features a bar chart with three colorful bars (yellow, orange, green) suggesting varying data points, overlaid with three distinct lines in yellow, blue, and orange, all sharply descending downwards. A prominent red arrow points downwards, emphasizing the negative trend. A small yellow plus sign is also visible, potentially signifying a point of reference or a contrasting element. The clean white background isolates the graphical elements, making them ideal for conveying concepts of loss, recession, or negative growth.
Free with trial Doodle drawing of a yellow indian rupee symbol with blue falling coins and descending arrows showing monetary loss and economic downturn alpha transparent. Keywords. Decrease crash vectors Decreasing indian currency value with falling coins and downward indicators comic doodle alpha transparent. doodle drawing of a yellow indian rupee symbol with blue falling coins and descending arrows showing monetary loss and economic downturn alpha transparent.Keywords
Free with trial A Bitcoin falling off a cliff against a cloudy horizon. Cryptocurrency fall concept. Decrease crash illustrations A Bitcoin falling off a cliff against a cloudy horizon
Free with trial 3d illustration of red decreasing graph on stand, financial presentation representing negative results or economic downturn. Decrease crash vectors 3d illustration of red decreasing graph on stand, financial presentation representing negative results
Free with trial A striking 3D rendered image featuring a bar chart with decreasing red bars and a prominent red downward-pointing arrow, set against a vibrant yellow background. This minimalist visual powerfully symbolizes financial decline, economic recession, business loss, or a negative trend in performance. The clean design effectively conveys concepts of decreasing profits, market downturns, or poor investment outcomes. Ideal for presentations, financial reports, economic analysis, infographics, and articles discussing challenges, risks, or market volatility in business and finance. Decrease crash illustrations Economic Downturn Bar Chart with Downward Arrow. A striking 3D rendered image featuring a bar chart with decreasing red bars and a prominent red downward-pointing arrow, set against a vibrant yellow background. This minimalist visual powerfully symbolizes financial decline, economic recession, business loss, or a negative trend in performance. The clean design effectively conveys concepts of decreasing profits, market downturns, or poor investment outcomes. Ideal for presentations, financial reports, economic analysis, infographics, and articles discussing challenges, risks, or market volatility in business and finance.
Free with trial A 3d rendering of stack of gold bars with a red arrow pointing downwards, suggesting a decrease in the price or value of gold. Decrease crash illustrations Stack of gold bars with a red arrow pointing downwards
Free with trial Crisis inflation causes increase in expenses for man walking along increasing negative schedule. Financial recession and inflation cause depression in bankrupt businessman in need of help. Decrease crash vectors Crisis inflation causes increase in expenses for man walking along increasing negative schedule
Free with trial A minimalist and clean line art illustration of a graph depicting a downward trend, symbolizing economic decline, failure, or a recession in business. Decrease crash vectors Simple Outline Falling Graph Line Chart Economic Recession Business Icon. A minimalist and clean line art illustration of a graph depicting a downward trend, symbolizing economic decline, failure, or a recession in business.
Free with trial Economic critical crisis concept. The bar garph with red drop down arrow on red background. Recession financial, cryptocurrency, gold, and the stock market. Losing money and cash. Bearish. Decrease crash vectors Economic critical crisis concept. The bar garph with red drop down arrow on red background. Recession financial, cryptocurrency
Free with trial Economic critical crisis concept. The bar garph on red background. Recession financial, cryptocurrency, gold, and the stock market. Losing money and cash. Bearish. Decrease crash vectors Economic critical crisis concept. The bar garph on red background. Recession financial, cryptocurrency, gold, and the stock market
Free with trial Black icon of a falling graph with a downward arrow on a white background. Clear details and vibrant colors en. Decrease crash illustrations Falling Graph with Downward Arrow Icon on White Background downward trend decline. Black icon of a falling graph with a downward arrow on a white background. Clear details and vibrant colors en
Free with trial Multiple stacks of gold coins are arranged in a line on a dark, reflective surface. The stacks vary in height, with the tallest on the far left and progressively shorter stacks to the right, creating a visual representation of a declining trend. The lighting is dramatic, casting reflections and highlighting the metallic sheen of the coins against the dark background. Decrease crash illustrations Stacks of coins arranged in a descending line on a dark reflective surface. Multiple stacks of gold coins are arranged in a line on a dark, reflective surface. The stacks vary in height, with the tallest on the far left and progressively shorter stacks to the right, creating a visual representation of a declining trend. The lighting is dramatic, casting reflections and highlighting the metallic sheen of the coins against the dark background
Free with trial Set line Falling property prices, Shutdown of factory, Drop crude oil and Global economic crisis news icon. Vector. Decrease crash illustrations Set line Falling property prices, Shutdown of factory, Drop crude oil and Global economic crisis news icon. Vector
Free with trial Illustration of a business activities. Decrease crash vectors Illustration of a business activities
Free with trial Illustration of a business activities. Decrease crash vectors Illustration of a business activities
Free with trial Illustration of a business activities. Decrease crash vectors Illustration of a business activities
Free with trial Illustration of a business activities. Decrease crash vectors Illustration of a business activities
Free with trial Illustration of a business activities. Decrease crash vectors Illustration of a business activities
Free with trial Illustration of a business activities. Decrease crash vectors Illustration of a business activities
Free with trial Illustration of a business activities. Decrease crash vectors Illustration of a business activities
Free with trial A visual representation of declining performance, with red bars and a descending line graph on a white background. Decrease crash illustrations Red bar chart showing downward trend and line graph. A visual representation of declining performance, with red bars and a descending line graph on a white background.
Free with trial Falling Vector arrow. Downward curve set. Motion flow symbol. Dynamic line illustration. Manual vector only. No autotrace used. EPS 10. Decrease crash vectors Falling Vector arrow. Downward curve set. Motion flow symbol. Dynamic line illustration. Manual vector only. No autotrace used.
Free with trial Set line Shutdown of factory, Bank building, Global economic crisis news and Stop delivery cargo truck icon. Vector. Decrease crash illustrations Set line Shutdown of factory, Bank building, Global economic crisis news and Stop delivery cargo truck icon. Vector
Free with trial Economic crisis and fall down stock market concept with digital downward yellow and red financial graph on dark background with dots. 3D rendering. Decrease crash illustrations Economic crisis and fall down stock market concept
Free with trial This image presents a compelling visual representation of a global economic downturn. A prominent, three-dimensional white arrow dramatically plunges downward, superimposed on a world map rendered in dark, somber tones. The map serves as a backdrop to several red bar graphs, illustrating a decline in various economic indicators across different regions of the globe. The overall color scheme reinforces a sense of crisis and uncertainty. The arrow's sharp descent visually emphasizes the severity of the economic drop. Numerical data and graphical representations are included, further supporting the downward economic trend. Decrease crash illustrations Global Economic Downturn Visualized with 3D Arrow and Charts. This image presents a compelling visual representation of a global economic downturn. A prominent, three-dimensional white arrow dramatically plunges downward, superimposed on a world map rendered in dark, somber tones. The map serves as a backdrop to several red bar graphs, illustrating a decline in various economic indicators across different regions of the globe. The overall color scheme reinforces a sense of crisis and uncertainty. The arrow's sharp descent visually emphasizes the severity of the economic drop. Numerical data and graphical representations are included, further supporting the downward economic trend.
Free with trial Generative ai, Stacks of golden coins descend mimicking a financial decline, accentuated by a bold red arrow angled downwards, with a businessman standing beside them. Decrease crash illustrations Financial downturn illustrated by stacks of gold coins decreasing under a red. generative ai, Stacks of golden coins descend mimicking a financial decline, accentuated by a bold red arrow angled downwards, with a businessman standing beside them
Free with trial A macro shot of a negative stock chart in the background and the symbol of the company next to the chart. Concept of declining profits and failure. Image is generated using AI. Decrease crash illustrations Stock Price Drop Symbol on Chart. A macro shot of a negative stock chart in the background and the symbol of the company next to the chart. Concept of declining profits and failure. Image is generated using AI
Free with trial A stark red jagged arrow points downwards diagonally against a solid black background, symbolizing a significant decline or loss. Decrease crash illustrations Red jagged downward trend arrow on black background. A stark red jagged arrow points downwards diagonally against a solid black background, symbolizing a significant decline or loss
Free with trial Downward arrow formed by falling dollar bills, symbolizing economic downturn. Stock photo. Decrease crash illustrations Downward arrow formed by falling dollar bills, symbolizing economic downturn
Free with trial Downward Business Graph with Arrows Financial Loss and Market Decline Concept. Decrease crash vectors Downward Business Graph with Arrows Financial Loss and Market Decline Concept
Free with trial Stack of gold coins are arranged against a backdrop of a red descending graph line, signifying financial loss, economic downturn, and market challenges. Image is generated using AI. Decrease crash illustrations Stack Of Coins With Falling Graph. Stack of gold coins are arranged against a backdrop of a red descending graph line, signifying financial loss, economic downturn, and market challenges. Image is generated using AI
Free with trial A series of seven golden, metallic bars are arranged in a descending order, forming a bar chart that illustrates a significant decline. The bars are highly reflective, catching the light and emphasizing their three-dimensional form. The chart is presented in isolation against a pure white background, making the visual representation of a downward trend clear and impactful. Decrease crash illustrations Golden Bar Chart Showing a Steep Decline on White Background graph statistics. A series of seven golden, metallic bars are arranged in a descending order, forming a bar chart that illustrates a significant decline. The bars are highly reflective, catching the light and emphasizing their three-dimensional form. The chart is presented in isolation against a pure white background, making the visual representation of a downward trend clear and impactful
Free with trial A silver laptop sits on a light brown wooden surface. Its screen displays a dark background with a grid pattern and a prominent red line graph sharply declining from left to right. The red line is brightly lit, creating a strong visual contrast against the dark background. The overall mood is one of concern or warning, suggesting a negative trend or decline. The image is clean and simple, focusing, generated by AI. Decrease crash illustrations Laptop Screen Showing Red Downward Trend Graph computer. A silver laptop sits on a light brown wooden surface. Its screen displays a dark background with a grid pattern and a prominent red line graph sharply declining from left to right. The red line is brightly lit, creating a strong visual contrast against the dark background. The overall mood is one of concern or warning, suggesting a negative trend or decline. The image is clean and simple, focusing, generated by AI.
Free with trial Hand Drawn Downward Trend Arrow On white Background. Decrease crash illustrations Hand-drawn black zigzag line ending with a downward arrow On white Background, symbolizing decline or negative trend. Hand Drawn Downward Trend Arrow On white. Hand Drawn Downward Trend Arrow On white Background
Free with trial A 3D rendering depicting a stone dollar sign symbol being broken apart by a downward trending red graph. The scene suggests economic downturn, financial crisis, or market instability. The image is ideal for illustrating articles, reports, or presentations related to finance, economics, and investment. The neutral color palette provides versatility for various design applications. Decrease crash illustrations Stone Dollar Sign Crumbling with Falling Stock Market Graph. A 3D rendering depicting a stone dollar sign symbol being broken apart by a downward trending red graph. The scene suggests economic downturn, financial crisis, or market instability. The image is ideal for illustrating articles, reports, or presentations related to finance, economics, and investment. The neutral color palette provides versatility for various design applications.
Free with trial A dynamic red jagged arrow plunges downward, visually representing a sharp decline, economic downturn, or negative trend in business and finance. Ideal for charting losses or market drops. Decrease crash illustrations Red jagged arrow pointing down symbolizing financial decline or negative trend. A dynamic red jagged arrow plunges downward, visually representing a sharp decline, economic downturn, or negative trend in business and finance. Ideal for charting losses or market drops
Free with trial A stark red arrow zigzags downwards, powerfully representing economic downturns, market crashes, and negative financial trends. This visual signifies a crisis or significant drop. Decrease crash illustrations Red downward arrow symbolizing financial decline and economic recession trends. A stark red arrow zigzags downwards, powerfully representing economic downturns, market crashes, and negative financial trends. This visual signifies a crisis or significant drop
Free with trial Flat 3d Isometric Businessman with Hammer Smashing Bitcoin. Bitcoin or Cryptocurrency Market Manipulation and Investment Concept. Decrease crash vectors Isometric Businessman with Hammer Smashing Bitcoin
Free with trial An troubled stock market investor holds the downward pointing arrow from a market chart in this 3-d illustration about investing. Decrease crash illustrations An troubled stock market investor holds the downward pointing arrow from a market chart
Free with trial 3D bar chart with red arrows pointing upwards, reflecting off a shiny, blue surface. The clean, minimalist design symbolizes financial growth, business success, and positive market trends. Ideal for use in presentations, financial reports, and marketing materials related to investment, stock market, and economic progress. Decrease crash illustrations Financial Growth 3D Bar Chart with Red Arrows. 3D bar chart with red arrows pointing upwards, reflecting off a shiny, blue surface. The clean, minimalist design symbolizes financial growth, business success, and positive market trends. Ideal for use in presentations, financial reports, and marketing materials related to investment, stock market, and economic progress
Free with trial 3D bar chart with red arrows pointing upwards, reflecting off a shiny, blue surface. The clean, minimalist design symbolizes financial growth, business success, and positive market trends. Ideal for use in presentations, financial reports, and marketing materials related to investment, stock market, and economic progress. Decrease crash illustrations Financial Growth 3D Bar Chart with Red Arrows. 3D bar chart with red arrows pointing upwards, reflecting off a shiny, blue surface. The clean, minimalist design symbolizes financial growth, business success, and positive market trends. Ideal for use in presentations, financial reports, and marketing materials related to investment, stock market, and economic progress
Free with trial 3D bar chart with red arrows pointing upwards, reflecting off a shiny, blue surface. The clean, minimalist design symbolizes financial growth, business success, and positive market trends. Ideal for use in presentations, financial reports, and marketing materials related to investment, stock market, and economic progress. Decrease crash illustrations Financial Growth 3D Bar Chart with Red Arrows. 3D bar chart with red arrows pointing upwards, reflecting off a shiny, blue surface. The clean, minimalist design symbolizes financial growth, business success, and positive market trends. Ideal for use in presentations, financial reports, and marketing materials related to investment, stock market, and economic progress
Free with trial A vibrant red arrow graph dramatically depicts a downward trend, ideal for illustrating concepts of decline, loss, recession, or negative growth. The transparent background allows for seamless integration into various designs, presentations, and reports. This vector graphic is perfect for financial reports, presentations, websites, and social media posts. Decrease crash illustrations Red Downward Trending Arrow Graph on Transparent Background. A vibrant red arrow graph dramatically depicts a downward trend, ideal for illustrating concepts of decline, loss, recession, or negative growth. The transparent background allows for seamless integration into various designs, presentations, and reports. This vector graphic is perfect for financial reports, presentations, websites, and social media posts.
Free with trial Businessman showing graph falling down, geometric pattern. Decrease crash illustrations Falling down of economic activity, geometric pattern. Businessman showing graph falling down, geometric pattern
Free with trial A simple graphic illustrating a housing market downturn. Decrease crash illustrations Real Estate Market Decline Vector Icon. A simple graphic illustrating a housing market downturn
Free with trial A striking visual depicting a golden coin with intricate patterns standing upright against a dark, reflective background. A vibrant, glowing red arrow dramatically points downwards towards the coin, symbolizing financial decline, market downturn, or a significant loss in value. This powerful image effectively conveys concepts like investment risk, economic crisis, depreciation of assets, and falling prices. Ideal for illustrating articles, reports, or presentations on financial challenges, stock market crashes, investment warnings, and economic trends. Decrease crash illustrations Golden Coin and Red Downward Arrow: Financial Decline Concept. A striking visual depicting a golden coin with intricate patterns standing upright against a dark, reflective background. A vibrant, glowing red arrow dramatically points downwards towards the coin, symbolizing financial decline, market downturn, or a significant loss in value. This powerful image effectively conveys concepts like investment risk, economic crisis, depreciation of assets, and falling prices. Ideal for illustrating articles, reports, or presentations on financial challenges, stock market crashes, investment warnings, and economic trends.
Free with trial Green arrow pointing downward on financial graph. Business chart with falling trend line. Digital stock market data visualization for investment analysis. Decrease crash illustrations Green arrow pointing downward on financial graph. Business chart with falling trend line
Free with trial A stack of black oil barrels is visually represented with a sharp red downward-trending arrow, symbolizing a significant economic decline or price drop in the oil industry. Decrease crash illustrations Oil barrel decline indicated by red arrow on white background. A stack of black oil barrels is visually represented with a sharp red downward-trending arrow, symbolizing a significant economic decline or price drop in the oil industry
Free with trial Financial crisis concept, losses, falling stock prices. Red Japanese candlestick chart and down arrow, and piggy bank losing money due to falling quotes. Flat vector cartoon illustration. Decrease crash vectors Financial crisis concept, losses, falling stock prices. Red Japanese candlestick chart and down arrow, and piggy bank
Free with trial Drop down red arrow business market crisis on world map red dark background. Crisis economy and investment loss graph. vector illustration fantastic design. Decrease crash vectors Drop down red arrow business market crisis on world map red dark background.
Free with trial Stock Market Loss 3D Icon, Isolated on White Background. Decrease crash illustrations Stock Market Loss 3D Icon