Free with trial A bar chart icon showing a downward trend with a line graph. Black shapes on a white background indicate decreasing values and financial loss in. Decrease diagram line icon vectors Bar chart decline icon showing decreasing financial data progress in a black silhouette. A bar chart icon showing a downward trend with a line graph. Black. A bar chart icon showing a downward trend with a line graph. Black shapes on a white background indicate decreasing values and financial loss in
Free with trial Dollar down arrow chart icon design vector flat on white background. Decrease diagram line icon vectors Dollar down arrow chart icon design vector flat on white background
Free with trial Business Chart and Graph Set with Line, Bar, and Pie Icons for Data Analysis or Statistics in Reports and Research. Vector. Editable stroke. Decrease diagram line icon vectors Business Chart and Graph Set with Line, Bar, and Pie Icons for Data Analysis or Statistics in Reports and Research. Vector. Editable stroke
Free with trial A set of black and white icons representing different types of business and financial charts including bar graphs line graphs and pie charts. Decrease diagram line icon vectors Collection of various business and financial chart icons including bar graphs line graphs and pie charts. A set of black and white icons representing different. A set of black and white icons representing different types of business and financial charts including bar graphs line graphs and pie charts
Free with trial Flat style illustration of going up red arrow icon isolated with background. Decrease diagram line icon illustrations Arrow indicated the direction symbol. Red arrow left icon symbol. Flat style illustration of going up red arrow icon isolated with background. Flat style illustration of going up red arrow icon isolated with background.
Free with trial Graph going Up and Down sign with green and red arrows. graph increase, decrease sign. Design. Decrease diagram line icon vectors Graph going Up and Down sign with green and red arrows. graph increase, decrease sign. Design
Free with trial Design dehydration silhouette water droplet with half water insisiting dehration concept medical illustration icon. Decrease diagram line icon illustrations Dehydration silhouette water droplet with half water insisiting dehration concept medical illustration icon. Design dehydration silhouette water droplet with. design dehydration silhouette water droplet with half water insisiting dehration concept medical illustration icon
Free with trial Data Trends And Analytics Hand Drawn Doodle Icon Set. Graphical Representation Of Data Changes Sketch Symbol Collection. Business Presentations And Data Analysis. Isolated Vector Illustration. Decrease diagram line icon vectors Data Trends And Analytics Hand Drawn Doodle Icon Set. Graphical Representation Of Data Changes Sketch Symbol Collection. Business Presentations And Data
Free with trial Euro Coin Stack with Green Arrow Downward Vector Icon for Financial Loss Price Drop and Cost Reduction Concept. Decrease diagram line icon illustrations Euro Coin Stack with Green Arrow Downward Vector Icon for Financial Loss Price Drop and Cost Reduction Concept.
Free with trial A decline in business income is illustrated through a continuous line drawing of an arrow pointing down, paired with a. A decline in business income is. Decrease diagram line icon illustrations A decline in business income is illustrated through a continuous line drawing of an arrow pointing down, paired with a. A decline in business income is
Free with trial The modern illustration includes a continuous line drawing of an arrow down, indicating a decline in business income. The modern illustration includes a. Decrease diagram line icon illustrations The modern illustration includes a continuous line drawing of an arrow down, indicating a decline in business income. The modern illustration includes a
Free with trial Red arrow going down stock icon on white background. Bankruptcy, financial market crash icon for your web site design, logo, app, UI. graph chart down trend symbol. chart going down sign. Decrease diagram line icon vectors Red arrow going down stock icon on white background. Bankruptcy, financial market crash icon for your web site. Red arrow going down stock icon on white. Red arrow going down stock icon on white background. Bankruptcy, financial market crash icon for your web site design, logo, app, UI. graph chart down trend symbol.chart going down sign.
Free with trial Smartphone showing decreasing bar graph icon vector outline. Smartphone is displaying a simple line graph that is decreasing, suggesting negative performance. Decrease diagram line icon vectors Smartphone showing decreasing bar graph icon vector outline. Smartphone is displaying a simple line graph that is decreasing, suggesting negative performance
Free with trial Outline of ups and downs chart vector icon. Simple line graph illustration showing trend fluctuations, ideal for financial concepts. Decrease diagram line icon illustrations Outline of ups and downs chart vector icon. Simple line graph illustration showing trend fluctuations, ideal for financial concepts
Free with trial An up and down arrow icon represents fluctuation, comparison, or changes in value, such as market trends or performance. It can also indicate options to increase or decrease. Decrease diagram line icon illustrations Up down arrows symbol. An up and down arrow icon represents fluctuation, comparison, or changes in value, such as market trends or performance. It can also. An up and down arrow icon represents fluctuation, comparison, or changes in value, such as market trends or performance. It can also indicate options to increase or decrease.
Free with trial Cost Reduction Concept Icon with Scissors Cutting Cost Word Above Coin Stack inside Teal Circle Badge Vector Illustration. Decrease diagram line icon illustrations Cost Reduction Concept Icon with Scissors Cutting Cost Word Above Coin Stack inside Teal Circle Badge Vector Illustration.
Free with trial Minimalist Green Coin Stack with Downward Arrow and Circular Refresh Loop Vector Icon for Cashback Refund and Cost Reduction Concept. Decrease diagram line icon illustrations Minimalist Green Coin Stack with Downward Arrow and Circular Refresh Loop Vector Icon for Cashback Refund and Cost Reduction. Concept
Free with trial Bankrupt and diagram icon concept. Black and Blue Line Diagram and Report Icon. Decrease diagram line icon illustrations Bankrupt and diagram icon concept. Black and Blue Line Diagram and Report Icon
Free with trial Decreasing bar chart icon on black circle. Market crash concept. Market crash illustration concept. Decrease diagram line icon vectors Decreasing bar chart icon on black circle. Market crash concept. Decreasing bar chart icon on black circle. Market crash illustration concept
Free with trial Sine waves analysis outline icon in white and black colors. sine waves analysis flat vector icon from business and analytics collection for web, mobile apps and ui. Decrease diagram line icon vectors Sine waves analysis outline icon in white and black colors. sine waves analysis flat vector icon from business and analytics. Collection for web, mobile apps
Free with trial Minimalist Green Hand Receiving Coin Stack with Downward Arrow Vector Icon for Income Cashback Salary and Cost Reduction Concept. Decrease diagram line icon illustrations Minimalist Green Hand Receiving Coin Stack with Downward Arrow Vector Icon for Income Cashback Salary and Cost Reduction Concept.
Free with trial Arrows going Up and Down, green and red arrows. Concept of sales bar chart symbol icon with arrow moving down and sales. Decrease diagram line icon illustrations Arrows going Up and Down, green and red arrows. Concept of sales bar chart symbol icon with arrow moving down and sales. Arrows going Up and Down, green and red
Free with trial An outline style displays a bar chart with a descending trend line, signifying a negative decline or loss. Great for business and financial related projects. Decrease diagram line icon vectors Declining bar chart icon with arrow showing negative trend in simple outline style. An outline style displays a bar chart with a descending trend line. An outline style displays a bar chart with a descending trend line, signifying a negative decline or loss. Great for business and financial related projects
Free with trial Arrow trend-down vector icon set in black and white outlines. Arrow trend-down icon. Decrease diagram line icon vectors Arrow trend-down vector icon set in black and white outlines. Arrow trend-down icon
Free with trial Set line Drop in crude oil price, Tearing money banknote, Global economic crisis and Money bag. Business infographic template. Vector. Decrease diagram line icon vectors Set line Drop in crude oil price, Tearing money banknote, Global economic crisis and Money bag. Business infographic. Template. Vector
Free with trial Sine waves analysis outline icon in white and black colors. sine waves analysis flat vector icon from analytics collection for web, mobile apps and ui. Decrease diagram line icon vectors Sine waves analysis outline icon in white and black colors. sine waves analysis flat vector icon from analytics collection for web. Mobile apps and ui
Free with trial Reduction chart icon set depicting data reduction symbols, ideal for business analytics and performance visuals. Decrease diagram line icon vectors Reduction chart icon set depicting data reduction symbols.Vector illustration. Reduction chart icon set depicting data reduction symbols, ideal for business. Reduction chart icon set depicting data reduction symbols, ideal for business analytics and performance visuals
Free with trial Finances statistics descending bars graphic outline icon in white and black colors. finances statistics descending bars graphic flat vector icon from business collection for web, mobile apps and ui. Decrease diagram line icon vectors Finances statistics descending bars graphic outline icon in white and black colors. finances statistics descending bars graphic. Flat vector icon from business. finances statistics descending bars graphic outline icon in white and black colors. finances statistics descending bars graphic flat vector icon from business collection for web, mobile apps and ui.
Free with trial Minimalist graph icon showing growth and fluctuation. Perfect for finance, business reports, market analysis, and data presentation projects. Decrease diagram line icon vectors Minimalist graph icon showing growth and fluctuation. Perfect for finance, business reports, market analysis, and data. Presentation projects
Free with trial Decreasing stocks bars graphic outline icon in white and black colors. decreasing stocks bars graphic flat vector icon from business collection for web, mobile apps and ui. Decrease diagram line icon vectors Decreasing stocks bars graphic outline icon in white and black colors. decreasing stocks bars graphic flat vector icon from. Business collection for web, mobile
Free with trial Graph going Up and Down sign with blue arrows vector. Flat design vector illustration concept of sales bar chart symbol icon with arrow moving down and sales bar chart with arrow moving up. Decrease diagram line icon vectors Graph going Up and Down sign with blue arrows vector. Flat design vector illustration concept of sales bar chart symbol icon. Graph going Up and Down sign with. Graph going Up and Down sign with blue arrows vector. Flat design vector illustration concept of sales bar chart symbol icon with arrow moving down and sales bar chart with arrow moving up.
Free with trial Red arrow going down stock icon on white background. Bankruptcy, financial market crash icon for your web site design, logo, app, UI. graph chart down trend symbol. chart going down sign. Decrease diagram line icon vectors Red arrow going down stock icon on white background. Bankruptcy, financial market crash icon for your web site design. Logo, app, UI. graph chart down trend. Red arrow going down stock icon on white background. Bankruptcy, financial market crash icon for your web site design, logo, app, UI. graph chart down trend symbol.chart going down sign.
Free with trial Red arrow going down stock icon on white background. Bankruptcy, financial market crash icon for your web site design, logo, app, UI. graph chart down trend symbol. chart going down sign. Decrease diagram line icon vectors Red arrow going down stock icon on white background. Bankruptcy, financial market crash icon for your web site design. Logo, app, UI. graph chart down trend. Red arrow going down stock icon on white background. Bankruptcy, financial market crash icon for your web site design, logo, app, UI. graph chart down trend symbol.chart going down sign.
Free with trial Symbols on a light blue background: a green upward-pointing percentage sign on the left with an arrow replacing the upper line, and a red downward-pointing percentage sign on the right with an arrow replacing the lower diagonal. The circles forming the bottom of both figures have a reflective, glass-like appearance. The colors and arrow orientations suggest concepts of increase and decrease. Decrease diagram line icon vectors Up and down percent icon. Symbols on a light blue background: a green upward-pointing percentage sign on the left with an arrow replacing the upper line, and a. Symbols on a light blue background: a green upward-pointing percentage sign on the left with an arrow replacing the upper line, and a red downward-pointing percentage sign on the right with an arrow replacing the lower diagonal. The circles forming the bottom of both figures have a reflective, glass-like appearance. The colors and arrow orientations suggest concepts of increase and decrease.
Free with trial Concentric black circles form a targeting symbol with a central red dot on a white background. The design includes four black radial lines extending outward, enhancing the bullseye appearance. The circles decrease in thickness towards the red dot, representing accuracy and precision in aiming contexts. Decrease diagram line icon illustrations Target icon. Concentric black circles form a targeting symbol with a central red dot on a white background. The design includes four black radial lines extending. Concentric black circles form a targeting symbol with a central red dot on a white background. The design includes four black radial lines extending outward, enhancing the bullseye appearance. The circles decrease in thickness towards the red dot, representing accuracy and precision in aiming contexts.
Free with trial Video player icon set. Containing play or start button, pause or stop, media, camera, live, cinema, multimedia, film, handycam, clapperboard, movie, streaming or online video. Vector illustration. Decrease diagram line icon illustrations Video player icon set. Containing play or start button, pause or stop, media, camera, live, cinema, multimedia, film, handycam, clapperboard, movie, streaming
Free with trial White Searching for food in trash can on streets outdoors icon isolated on colorful background. Homelessness and poverty concept. Set icons in square buttons. Vector. Decrease diagram line icon vectors White Searching for food in trash can on streets outdoors icon isolated on colorful background. Homelessness and poverty. Concept. Set icons in square buttons
Free with trial Trend and Candlestick Chart vector Crypto Investment icon or symbol. Decrease diagram line icon vectors Trend and Candlestick Chart vector Crypto Investment icon or symbol. Trend and Candlestick Chart vector Crypto Investment concept icon or symbol
Free with trial A simple, flat design icon depicting a downward trend. The image features a red graph line descending from the top left to the bottom right, with an arrow indicating the direction. The graph is set against a clean white background, emphasizing the visual impact of the trend. This graphic is suitable for illustrating concepts such as financial decline, decreasing sales, or negative performance in business, economics, or data analysis. Decrease diagram line icon vectors Downward Trend Graph Icon. A simple, flat design icon depicting a downward trend. The image features a red graph line descending from the top left to the bottom. A simple, flat design icon depicting a downward trend. The image features a red graph line descending from the top left to the bottom right, with an arrow indicating the direction. The graph is set against a clean white background, emphasizing the visual impact of the trend. This graphic is suitable for illustrating concepts such as financial decline, decreasing sales, or negative performance in business, economics, or data analysis.
Free with trial A clean, minimalist 3D render of a blue bar chart with a blue trend line connecting circular data points. The bars vary in height, illustrating growth and fluctuations. The background is a bright, clean white, emphasizing the chart's elements. This graphic is ideal for representing financial data, business growth, market trends, statistics, and performance analysis in a modern and professional style. Decrease diagram line icon illustrations 3D Blue Bar Chart with Trend Line. A clean, minimalist 3D render of a blue bar chart with a blue trend line connecting circular data points. The bars vary in. A clean, minimalist 3D render of a blue bar chart with a blue trend line connecting circular data points. The bars vary in height, illustrating growth and fluctuations. The background is a bright, clean white, emphasizing the chart's elements. This graphic is ideal for representing financial data, business growth, market trends, statistics, and performance analysis in a modern and professional style.
Free with trial Money loss and economic crisis, money market crash and global financial downturn, vector line icons. Economic crisis icons of bankruptcy, price decrease with money inflation and unemployment growth. Decrease diagram line icon vectors Money loss and economic crisis, money market crash. And global financial downturn, vector line icons. Economic crisis icons of bankruptcy, price decrease with. Money loss and economic crisis, money market crash and global financial downturn, vector line icons. Economic crisis icons of bankruptcy, price decrease with money inflation and unemployment growth
Free with trial Candlestick Chart on PC Screen vector Crypto Investment concept colored icon or symbol. Decrease diagram line icon vectors Candlestick Chart on PC Screen vector Crypto Investment colored icon or symbol. Candlestick Chart on PC Screen vector Crypto Investment concept colored icon or. Candlestick Chart on PC Screen vector Crypto Investment concept colored icon or symbol
Free with trial Chemical line icons. Pixel perfect. Ecology and Environment Line Icons. Decrease diagram line icon vectors Chemical line icons. Pixel perfect. Ecology and Environment Line Icons
Free with trial Cartoon Gesture Icon Mockup. Flat 3d isometric businessman hand turn cost dial to low position. Cost reduction management concept. 3D rendering on white background. Decrease diagram line icon vectors Cartoon Gesture Icon Mockup.Flat 3d isometric businessman hand turn cost dial to low position. Cost reduction management concept.3D rendering on white
Free with trial Decrease icon vector, filled. High-Quality Vector Icons. Decrease diagram line icon illustrations Decrease icon vector, filled. High-Quality Vector Icons
Free with trial Economic crisis line icons of global financial downturn and business bankruptcy, vector banner. Money loss and banking crisis icons of depreciation, unemployment and price decrease of pandemic crisis. Decrease diagram line icon vectors Economic crisis icons of global financial downturn. Economic crisis line icons of global financial downturn and business bankruptcy, vector banner. Money loss. Economic crisis line icons of global financial downturn and business bankruptcy, vector banner. Money loss and banking crisis icons of depreciation, unemployment and price decrease of pandemic crisis
Free with trial Reduction chart icon Thin line illustration set. Reduction chart icon vector logo set collection for web app ui. Decrease diagram line icon vectors Reduction chart icon Thin line illustration set. Reduction chart icon vector logo set collection for web app ui
Free with trial Statistic Up icon Line Art Logo set. Statistic Up icon outline collection or set in black and white. Decrease diagram line icon vectors Statistic Up icon Line Art Logo set. Statistic Up icon outline collection or set in black and white
Free with trial Flip chart showing decreasing statistics on whiteboard. Line art icon of a flip chart showing a graph with decreasing statistics, concept for business failure. Decrease diagram line icon vectors Flip chart showing decreasing statistics on whiteboard. Line art icon of a flip chart showing a graph with decreasing statistics, concept for business failure
Free with trial Online Candlestick Chart vector Professional Financial Trading concept colored icon or design element. Decrease diagram line icon vectors Online Candlestick Chart vector Professional Financial Trading colored icon or design element. Online Candlestick Chart vector Professional Financial Trading. Online Candlestick Chart vector Professional Financial Trading concept colored icon or design element
Free with trial A bold text vector illustration of the word MINUS, symbolizing subtraction, negative values, or a decrease. This icon is perfect for mathematical operations, financial reports, and data analysis. High-resolution and clear for precise communication in various contexts, vector design Generative AI. Decrease diagram line icon vectors Minus Text Symbol, Subtraction and Negative Value, vector design Generative AI. A bold text vector illustration of the word MINUS, symbolizing subtraction. A bold text vector illustration of the word MINUS, symbolizing subtraction, negative values, or a decrease. This icon is perfect for mathematical operations, financial reports, and data analysis. High-resolution and clear for precise communication in various contexts, vector design Generative AI
Free with trial Investment Loss and diagram icon concept. Black and Blue Line Diagram and Report Icon. Decrease diagram line icon illustrations Investment Loss and diagram icon concept. Black and Blue Line Diagram and Report Icon
Free with trial A vibrant, modern icon depicting a financial growth chart, representing investment and market analysis. The design features ascending lines and bars, suggesting positive trends. This graphic was generated by AI for illustrative purposes. A representation of financial success. Decrease diagram line icon illustrations Financial Growth Chart Icon - Business Investment Concept. A vibrant, modern icon depicting a financial growth chart, representing investment and market analysis. A vibrant, modern icon depicting a financial growth chart, representing investment and market analysis. The design features ascending lines and bars, suggesting positive trends. This graphic was generated by AI for illustrative purposes. A representation of financial success.
Free with trial Decreasing line graph showing a negative trend, perfect for illustrating economic downturn or market decline. Decrease diagram line icon vectors Downward Trend Graph, Financial Crisis Icon Illustration. Decreasing line graph showing a negative trend, perfect for illustrating economic downturn or market. Decreasing line graph showing a negative trend, perfect for illustrating economic downturn or market decline.
Free with trial A vibrant graphic illustrating alphabetical order from Z to A, featuring the letters 'Z' and 'A' in blue with a dashed line connecting them, alongside a long green arrow pointing downwards, transitioning from light to dark green rectangles. This content was created using AI technology, symbolizing sorting or a reverse progression. Decrease diagram line icon vectors Alphabetical Order Z to A with Descending Green Arrow Icon. A vibrant graphic illustrating alphabetical order from Z to A, featuring the letters 'Z' and 'A' in. A vibrant graphic illustrating alphabetical order from Z to A, featuring the letters 'Z' and 'A' in blue with a dashed line connecting them, alongside a long green arrow pointing downwards, transitioning from light to dark green rectangles. This content was created using AI technology, symbolizing sorting or a reverse progression.
Free with trial Decreasing bar chart icon in generic design. Market crash sign symbol. Illustration. Decrease diagram line icon vectors Decreasing bar chart icon in generic design. Market crash sign symbol. Illustration
Free with trial Down graphic of business stats outline icon in white and black colors. down graphic of business stats flat vector icon from business collection for web, mobile apps and ui. Decrease diagram line icon vectors Down graphic of business stats outline icon in white and black colors. down graphic of business stats flat vector icon from. Business collection for web, mobile
Free with trial Chevron Down Vector Icon Design. Symbol. Decrease diagram line icon vectors Chevron Down Vector Icon Design. Symbol
Free with trial Data analysis graphs with up and down arrow line icons set. Increase and reduction of economy or trend charts, price boost, stock market research thin black and red outline symbols vector illustration. Decrease diagram line icon vectors Data analysis graphs with up and down arrow, economy or trend charts line icons set. Data analysis graphs with up and down arrow line icons set. Increase and. Data analysis graphs with up and down arrow line icons set. Increase and reduction of economy or trend charts, price boost, stock market research thin black and red outline symbols vector illustration
Free with trial Graph going Up and Down with red arrows vector. Blue chart bar vector illustration concept of sales bar chart symbol icon with arrow moving down and sales bar chart with arrow moving up. Decrease diagram line icon vectors Graph going Up and Down with red arrows vector. Blue chart bar vector illustration concept of sales bar chart symbol icon. Graph going Up and Down with red. Graph going Up and Down with red arrows vector. Blue chart bar vector illustration concept of sales bar chart symbol icon with arrow moving down and sales bar chart with arrow moving up.
Free with trial Loss chart outline icon in white and black colors. loss chart flat vector icon from business collection for web, mobile apps and ui. Decrease diagram line icon vectors Loss chart outline icon in white and black colors. loss chart flat vector icon from business collection for web, mobile apps and. Ui
Free with trial Outline bar chart icon vector with upward and downward trend arrow. Uptrend and downtrend business graph symbol in black circle. Decrease diagram line icon vectors Outline bar chart icon with upward and downward trend arrow. Uptrend and downtrend business graph symbol in black circle. Outline bar chart icon vector with. Outline bar chart icon vector with upward and downward trend arrow. Uptrend and downtrend business graph symbol in black circle
Free with trial Set line Worker, Credit card, Global economic crisis and. Business infographic template. Vector. Decrease diagram line icon vectors Set line Worker, Credit card, Global economic crisis and . Business infographic template. Vector.
Free with trial Reduction chart icon vector logo set collection for web app ui. Decrease diagram line icon vectors Reduction chart icon set depicting data reduction symbols, ideal for business analytics and performance visuals. Reduction chart icon vector logo set collection. Reduction chart icon vector logo set collection for web app ui
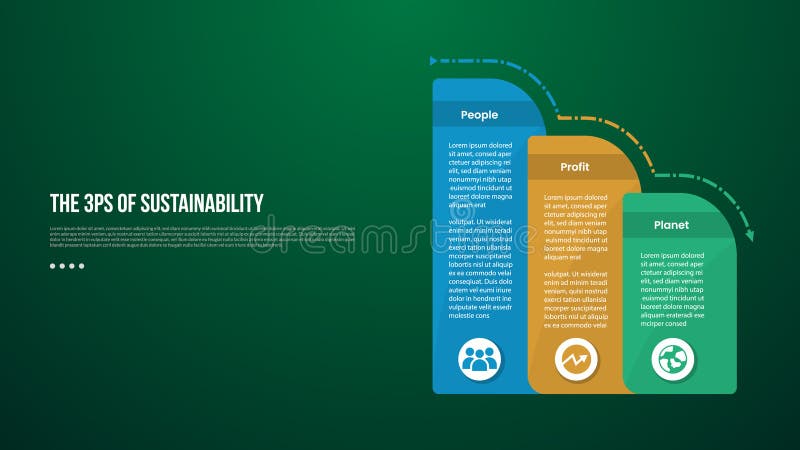
Free with trial The 3 Ps of Sustainability infographic template with round box container decrease gradually with dark background style with 3 point for slide presentation vector. Decrease diagram line icon illustrations The 3 Ps of Sustainability infographic template with round box container decrease gradually with dark background style with 3. Point for slide presentation
Free with trial Set line Server with shield, Mobile and password, Cost reduction and Sales funnel gear on seamless pattern. Vector. Decrease diagram line icon illustrations Set line Server with shield, Mobile and password, Cost reduction and Sales funnel gear on seamless pattern. Vector.
Free with trial Red arrow going down stock icon on white background. Bankruptcy, financial market crash icon for your web site design, logo, app, UI. graph chart down trend symbol. chart going down sign. Decrease diagram line icon vectors Red arrow going down stock icon on white background. Bankruptcy, financial market crash icon for your web site design. Logo, app, UI. graph chart down trend. Red arrow going down stock icon on white background. Bankruptcy, financial market crash icon for your web site design, logo, app, UI. graph chart down trend symbol.chart going down sign.
Free with trial Red 3d arrow going down stock icon on white background. Bankruptcy, financial market crash icon for your web site design, logo, app, UI. graph chart downtrend symbol. chart going down sign. Decrease diagram line icon vectors Red 3d arrow going down stock icon on white background. Bankruptcy, financial market crash icon for your web site design. Red 3d arrow going down stock icon on. Red 3d arrow going down stock icon on white background. Bankruptcy, financial market crash icon for your web site design, logo, app, UI. graph chart downtrend symbol.chart going down sign.
Free with trial Icons depicting different speaker and volume settings. The top row includes a speaker with a diagonal line indicating mute, followed by increasing sound waves to suggest volume levels. The bottom row has variations including a speaker with a prohibition sign for no sound, and additional icons indicating volume adjustments or settings with symbols like an 'x' for off, '+' for increase, and '-' for decrease. These icons are simple, black, and designed for user interface purposes. Decrease diagram line icon vectors Minimal Sound and Volume Control Icons – Line Style. Icons depicting different speaker and volume settings. The top row includes a speaker with a diagonal line. Icons depicting different speaker and volume settings. The top row includes a speaker with a diagonal line indicating mute, followed by increasing sound waves to suggest volume levels. The bottom row has variations including a speaker with a prohibition sign for no sound, and additional icons indicating volume adjustments or settings with symbols like an 'x' for off, '+' for increase, and '-' for decrease. These icons are simple, black, and designed for user interface purposes.
Free with trial Outline down chart icon isolated. Flat style design vector illustration on white background. Decrease diagram line icon vectors Outline down chart icon isolated. Flat style design vector illustration on white background
Free with trial Cost reduction icons set. Dollar rate decrease signs set. Decrease diagram line icon vectors Cost reduction icons set. Dollar rate decrease signs set
Free with trial Trend Down line icon. Trend Down represents falling stock prices, declining market performance, and decreasing investment value through a downward direction. Decrease diagram line icon vectors Trend Down line icon. Trend Down represents falling stock prices, declining market performance, and decreasing investment value through a downward direction
Free with trial Arrow Down symbolizes falling stock prices, declining financial value, and downward movement in market performance. Decrease diagram line icon vectors Arrow Down line icon. Arrow Down symbolizes falling stock prices, declining financial value, and downward movement in market performance. Arrow Down symbolizes falling stock prices, declining financial value, and downward movement in market performance.
Free with trial A glossy purple minus sign encased in a circular border, rendered in a clean 3D style. This minimalist symbol represents subtraction, reduction, or negative values in digital interfaces and modern graphic designs. Decrease diagram line icon illustrations 3D Purple Minus Sign Icon. A glossy purple minus sign encased in a circular border, rendered in a clean 3D style. This minimalist symbol represents subtraction. A glossy purple minus sign encased in a circular border, rendered in a clean 3D style. This minimalist symbol represents subtraction, reduction, or negative values in digital interfaces and modern graphic designs.
Free with trial Market Decline represents falling stock values, decreasing investment performance, and downward movement across financial markets. Decrease diagram line icon vectors Market Decline line icon. Market Decline represents falling stock values, decreasing investment performance, and downward movement across financial markets. Market Decline represents falling stock values, decreasing investment performance, and downward movement across financial markets.
Free with trial A vibrant green 3D rendered minus symbol centered within a circular frame. This minimalist graphic element is ideal for user interfaces, navigation buttons, or mathematical representations. Decrease diagram line icon illustrations Green circular minus sign icon. A vibrant green 3D rendered minus symbol centered within a circular frame. This minimalist graphic element is ideal for user. A vibrant green 3D rendered minus symbol centered within a circular frame. This minimalist graphic element is ideal for user interfaces, navigation buttons, or mathematical representations.
Free with trial A smooth, rounded purple minus symbol rendered in a high-gloss 3D style. This vibrant mathematical operator stands out against a clean white backdrop, perfect for digital interfaces and educational materials. Decrease diagram line icon illustrations 3D glossy purple minus sign icon. A smooth, rounded purple minus symbol rendered in a high-gloss 3D style. This vibrant mathematical operator stands out against. A smooth, rounded purple minus symbol rendered in a high-gloss 3D style. This vibrant mathematical operator stands out against a clean white backdrop, perfect for digital interfaces and educational materials.
Free with trial Green three-dimensional arrow pointing downwards in a zigzag motion. This symbol represents financial decline, loss, or a negative trend in data analysis. Decrease diagram line icon illustrations 3D Green Zigzag Downward Arrow Icon. Green three-dimensional arrow pointing downwards in a zigzag motion. This symbol represents financial decline, loss, or a. Green three-dimensional arrow pointing downwards in a zigzag motion. This symbol represents financial decline, loss, or a negative trend in data analysis.
Free with trial Glossy blue and white circular icon featuring a horizontal minus bar. This minimalist graphic represents subtraction, restriction, or a negative state in digital interfaces. Decrease diagram line icon illustrations 3D Blue Minus Sign Prohibition Symbol. Glossy blue and white circular icon featuring a horizontal minus bar. This minimalist graphic represents subtraction. Glossy blue and white circular icon featuring a horizontal minus bar. This minimalist graphic represents subtraction, restriction, or a negative state in digital interfaces.
 Sign in