Free with trial A graphic vector illustration featuring two rectangular stamp-style banners labeled "TOP" and "FLOP". The upper banner has a green frame with bright green "TOP" typography and an up arrow indicating success or high rating. The lower banner features a red border with bold red "FLOP" text and a down arrow representing failure or low performance. Both stamps display a subtle grunge, distressed texture. Perfect for reviews, comparisons, rating systems, voting buttons, financial trends, and evaluation graphics. Decrease diagram line icon vectors Top and Flop Stamp Vector Banners with Arrows. A graphic vector illustration featuring two rectangular stamp-style banners labeled 'TOP' and 'FLOP'. The upper. A graphic vector illustration featuring two rectangular stamp-style banners labeled "TOP" and "FLOP". The upper banner has a green frame with bright green "TOP" typography and an up arrow indicating success or high rating. The lower banner features a red border with bold red "FLOP" text and a down arrow representing failure or low performance. Both stamps display a subtle grunge, distressed texture. Perfect for reviews, comparisons, rating systems, voting buttons, financial trends, and evaluation graphics.
Free with trial Downward arrow stairs decline fall chart with black outline. Eps 10. Decrease diagram line icon vectors Downward arrow stairs decline fall chart with black outline. Eps 10
Free with trial A clean and simple illustration featuring a variety of common crochet stitch symbols. The chart includes symbols for chain, slip stitch, single crochet, double crochet, and more. This visual guide is perfect for crochet patterns, instructional materials, and educational resources for both beginners and experienced crocheters. The minimalist design ensures clarity and easy understanding. Decrease diagram line icon illustrations Crochet Stitch Symbols Chart. A clean and simple illustration featuring a variety of common crochet stitch symbols. The chart includes symbols for chain, slip. A clean and simple illustration featuring a variety of common crochet stitch symbols. The chart includes symbols for chain, slip stitch, single crochet, double crochet, and more. This visual guide is perfect for crochet patterns, instructional materials, and educational resources for both beginners and experienced crocheters. The minimalist design ensures clarity and easy understanding.
Free with trial Sustainability, healthcare, cost reduction, carbon emissions, eco-friendly, global warming. Blue heart and line pulse, carbon footprint, CO2 text downward temperature arrow and dollar coin. Decrease diagram line icon vectors Blue Heartbeat Monitor with Carbon Footprint, CO2 Emissions, and Cost Savings Concept. Sustainability, healthcare, cost reduction, carbon emissions, eco-friendly. Sustainability, healthcare, cost reduction, carbon emissions, eco-friendly, global warming. Blue heart and line pulse, carbon footprint, CO2 text downward temperature arrow and dollar coin
Free with trial Bold red arrow pointing downwards rendered in a clean isometric style. This vibrant graphic element is ideal for highlighting financial decline, navigation, or call-to-action buttons in digital interfaces. Decrease diagram line icon illustrations 3D Red Downward Arrow Symbol. Bold red arrow pointing downwards rendered in a clean isometric style. This vibrant graphic element is ideal for highlighting. Bold red arrow pointing downwards rendered in a clean isometric style. This vibrant graphic element is ideal for highlighting financial decline, navigation, or call-to-action buttons in digital interfaces.
Free with trial A simple black vector illustration of a simple checkmark inside a circle, set against a white background, composed of basic geometric shapes, large circle, two perpendicular lines --chaos 30 --ar 16:9 --v 7 Job ID: e5716674-c7ae-40bc-b54b-07f4d0cf3160. Decrease diagram line icon illustrations Black Circle with Inner V Symbol. A simple black vector illustration of a simple checkmark inside a circle, set against a white background, composed of basic. a simple black vector illustration of a simple checkmark inside a circle, set against a white background, composed of basic geometric shapes, large circle, two perpendicular lines --chaos 30 --ar 16:9 --v 7 Job ID: e5716674-c7ae-40bc-b54b-07f4d0cf3160
Free with trial Bold three-dimensional percentage sign rendered in a vibrant blue color with a smooth, reflective surface. This isolated graphic element is perfect for highlighting discounts, special offers, or financial statistics in marketing materials. Decrease diagram line icon illustrations Glossy Blue Percentage Symbol. Bold three-dimensional percentage sign rendered in a vibrant blue color with a smooth, reflective surface. This isolated graphic. Bold three-dimensional percentage sign rendered in a vibrant blue color with a smooth, reflective surface. This isolated graphic element is perfect for highlighting discounts, special offers, or financial statistics in marketing materials.
Free with trial A simple flat icon vector illustration of two hands adjusting a simple chart with a downturn arrow, symbolizing risk mitigation in a business setting. The simple chart with a downturn arrow is orange with dark gray elements, indicating loss control. White background. Minimalist style with sharp edges and no shadows. Orange and Gray color palette. Vector graphics with rounded corners. High. Decrease diagram line icon illustrations Business Downturn Graph Two Hands Hold Downward Trend Chart. A simple flat icon vector illustration of two hands adjusting a simple chart with a downturn arrow. A simple flat icon vector illustration of two hands adjusting a simple chart with a downturn arrow, symbolizing risk mitigation in a business setting. The simple chart with a downturn arrow is orange with dark gray elements, indicating loss control. White background. Minimalist style with sharp edges and no shadows. Orange and Gray color palette. Vector graphics with rounded corners. High
Free with trial Bright red three-dimensional arrow pointing downwards against a clean white surface. This minimalist graphic element is ideal for highlighting important information, indicating navigation, or emphasizing a downward trend. Decrease diagram line icon illustrations 3D Red Downward Pointing Arrow. Bright red three-dimensional arrow pointing downwards against a clean white surface. This minimalist graphic element is ideal for. Bright red three-dimensional arrow pointing downwards against a clean white surface. This minimalist graphic element is ideal for highlighting important information, indicating navigation, or emphasizing a downward trend.
Free with trial A drawn graphic illustration showing the Indian currency INR symbol dropping alongside a downward arrow, indicating financial loss, economic decline, and recession, isolated on an Alpha transparent background. Decrease diagram line icon vectors Indian Rupee depreciation downward arrow stylized sketch Alpha transparent. A drawn graphic illustration showing the Indian currency INR symbol dropping. A drawn graphic illustration showing the Indian currency INR symbol dropping alongside a downward arrow, indicating financial loss, economic decline, and recession, isolated on an Alpha transparent background.
Free with trial A drawn graphic showing the Indian currency INR symbol dropping alongside a downward red arrow, indicating recession and financial loss, isolated on an Alpha transparent background. Decrease diagram line icon vectors Indian Rupee depreciation red arrow down stylized sketch Alpha transparent. A drawn graphic showing the Indian currency INR symbol dropping alongside a downward. A drawn graphic showing the Indian currency INR symbol dropping alongside a downward red arrow, indicating recession and financial loss, isolated on an Alpha transparent background.
Free with trial Black and white vector logo of a simple house outline with stylized upward arrow and a small dollar sign icon, simple design, on a solid background, simple shapes, flat illustration style, simple lines, no shadows or gradients, symmetrical composition, centered, no text, high contrast, no color, high resolution, very detailed, high definition --chaos 30 --ar 16:9 --v 7 Job ID: cfd6ce0d-9e1a-412b-. Decrease diagram line icon illustrations Dollar Sign with Arrows Showing Income and Expenses Under a Roof. Black and white vector logo of a simple house outline with stylized upward arrow and a small. black and white vector logo of a simple house outline with stylized upward arrow and a small dollar sign icon, simple design, on a solid background, simple shapes, flat illustration style, simple lines, no shadows or gradients, symmetrical composition, centered, no text, high contrast, no color, high resolution, very detailed, high definition --chaos 30 --ar 16:9 --v 7 Job ID: cfd6ce0d-9e1a-412b-
Free with trial Bold red arrow pointing downwards, rendered in a clean three-dimensional style. This versatile graphic element is perfect for highlighting trends, indicating navigation, or emphasizing important information in digital interfaces. Decrease diagram line icon illustrations 3D Red Downward Pointing Arrow Icon. Bold red arrow pointing downwards, rendered in a clean three-dimensional style. This versatile graphic element is perfect. Bold red arrow pointing downwards, rendered in a clean three-dimensional style. This versatile graphic element is perfect for highlighting trends, indicating navigation, or emphasizing important information in digital interfaces.
Free with trial A clean and modern vector illustration featuring graphic symbols for business growth and decline. This EPS file shows an upward-trending green arrow for success and a downward-trending red arrow for loss, both depicted on a stylized financial chart. Ideal for corporate presentations, financial reports, economic analysis, and stock market metaphors. Decrease diagram line icon vectors Growth And Decline Chart Graphic Symbol. A clean and modern vector illustration featuring graphic symbols for business growth and decline. This EPS file shows an. A clean and modern vector illustration featuring graphic symbols for business growth and decline. This EPS file shows an upward-trending green arrow for success and a downward-trending red arrow for loss, both depicted on a stylized financial chart. Ideal for corporate presentations, financial reports, economic analysis, and stock market metaphors.
Free with trial Net zero solid icons collection. Containing customer ecology, sustainable, environmental etc icons. Containing customer ecology. Decrease diagram line icon vectors Net zero solid icons collection. Containing customer ecology, sustainable, environmental etc icons. Net zero solid icons collection. Containing customer ecology
Free with trial A detailed black and white illustration of a knitting pattern stitch chart. This graphical guide features a grid with various symbols, icons, and abbreviations like 'k2tog' and 'ssk', representing different knitting stitches and techniques. The chart is organized by rows and columns, providing a visual map for creating intricate designs, particularly in lace knitting. This image is ideal for crafting websites, DIY tutorials, knitting books, hobby blogs, and instructional materials related to needlework, textiles, and handmade crafts. Decrease diagram line icon illustrations Knitting Pattern Stitch Chart. A detailed black and white illustration of a knitting pattern stitch chart. This graphical guide features a grid with various. A detailed black and white illustration of a knitting pattern stitch chart. This graphical guide features a grid with various symbols, icons, and abbreviations like 'k2tog' and 'ssk', representing different knitting stitches and techniques. The chart is organized by rows and columns, providing a visual map for creating intricate designs, particularly in lace knitting. This image is ideal for crafting websites, DIY tutorials, knitting books, hobby blogs, and instructional materials related to needlework, textiles, and handmade crafts.
Free with trial Abstract illustration of business growth, featuring bar graphs and line graphs in shades of blue and grey. The image conveys concepts of data analysis, progress, and financial performance. Suitable for presentations, reports, and marketing materials related to business, finance, and technology. Decrease diagram line icon illustrations Abstract Business Growth Chart. Abstract illustration of business growth, featuring bar graphs and line graphs in shades of blue and grey. The image conveys. Abstract illustration of business growth, featuring bar graphs and line graphs in shades of blue and grey. The image conveys concepts of data analysis, progress, and financial performance. Suitable for presentations, reports, and marketing materials related to business, finance, and technology.
Free with trial A simple flat icon vector illustration of two hands adjusting a simple chart with a downturn arrow, symbolizing risk mitigation in a business setting. The simple chart with a downturn arrow is orange with dark gray elements, indicating loss control. White background. Minimalist style with sharp edges and no shadows. Orange and Gray color palette. Vector graphics with rounded corners. High. Decrease diagram line icon illustrations Hands Protect Financial Growth Chart Decline, Business Crisis Management. A simple flat icon vector illustration of two hands adjusting a simple chart with a. A simple flat icon vector illustration of two hands adjusting a simple chart with a downturn arrow, symbolizing risk mitigation in a business setting. The simple chart with a downturn arrow is orange with dark gray elements, indicating loss control. White background. Minimalist style with sharp edges and no shadows. Orange and Gray color palette. Vector graphics with rounded corners. High
Free with trial Arrow Trending Down : Arrow trending down represents decline, decrease, or negative trend. Decrease diagram line icon vectors Arrow Trending Down. Represents decline, decrease, or negative trend. Arrow Trending Down : Arrow trending down represents decline, decrease, or negative trend.
Free with trial Illustration of a growing budget efficiency with a simple money bag closing tightly, a stylized downward-pointing cost arrow, and a stream of saved coins. Vector flat icon design on a white background for a cost control illustration --chaos 30 --ar 16:9 --v 7 Job ID: 35adf769-e45b-43cf-a8e7-0b2af69479b3. Decrease diagram line icon illustrations Money Bag Downward Arrow, Financial Crisis, Economic Downturn, Falling Value. Illustration of a growing budget efficiency with a simple money bag closing tightly. Illustration of a growing budget efficiency with a simple money bag closing tightly, a stylized downward-pointing cost arrow, and a stream of saved coins. Vector flat icon design on a white background for a cost control illustration --chaos 30 --ar 16:9 --v 7 Job ID: 35adf769-e45b-43cf-a8e7-0b2af69479b3
Free with trial Abstract checkered pattern downward and u turn arrows set isolated on white background. Decrease diagram line icon vectors Abstract checkered pattern downward and u turn arrows set isolated on white background.
Free with trial BRAIN SLEEPY FEELING TIRED SLEEPING ON PILLOW element. Decrease diagram line icon illustrations BRAIN SLEEPY FEELING TIRED SLEEPING ON PILLOW element. Design BRAIN SLEEPY FEELING TIRED SLEEPING ON PILLOW element
Free with trial Euro Currency Icons. In Circles. Decrease diagram line icon vectors Euro Currency Icons. In Circles
Free with trial A flat illustration of business graphs and charts showing analysis results. Featuring clean design and vibrant color scheme. Decrease diagram line icon vectors Colorful business graph and chart flat style design. A flat illustration of business graphs and charts showing analysis results. Featuring clean design and. A flat illustration of business graphs and charts showing analysis results. Featuring clean design and vibrant color scheme.
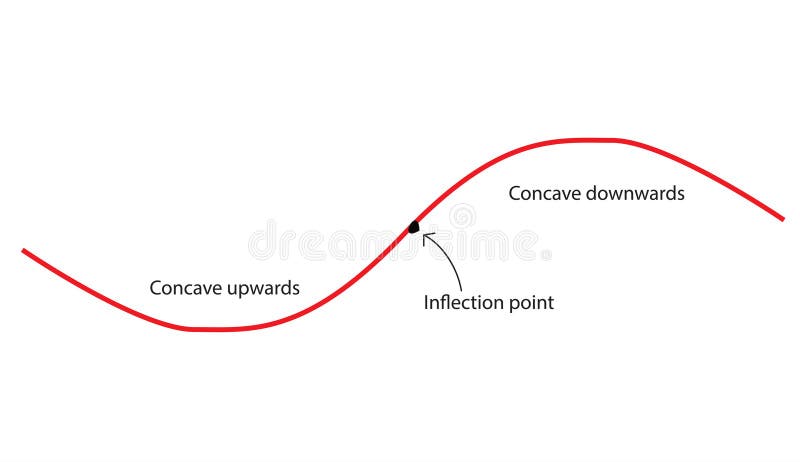
Free with trial Concavity of curve. Inflection point, concave down and concave up. Second derivative tangent lines of function. Decrease diagram line icon vectors Concavity of curve. Inflection point, concave down and concave up. Second derivative tangent lines of function
Free with trial A clear, black and white vector illustration of a lace knitting chart with a corresponding legend. The grid pattern contains various symbols representing different knitting stitches, such as knit, yarn over, and decreases. The legend on the right provides a key to decipher the symbols, making it a complete instructional guide. This graphic is perfect for craft blogs, knitting pattern books, DIY tutorials, hobby magazines, and any content related to needlework, textiles, and handmade crafts. The clean design is easy to read and understand. Decrease diagram line icon illustrations Lace Knitting Chart and Stitch Legend. A clear, black and white vector illustration of a lace knitting chart with a corresponding legend. The grid pattern. A clear, black and white vector illustration of a lace knitting chart with a corresponding legend. The grid pattern contains various symbols representing different knitting stitches, such as knit, yarn over, and decreases. The legend on the right provides a key to decipher the symbols, making it a complete instructional guide. This graphic is perfect for craft blogs, knitting pattern books, DIY tutorials, hobby magazines, and any content related to needlework, textiles, and handmade crafts. The clean design is easy to read and understand.
Free with trial A conceptual vector illustration depicting business analysis and market research. A hand holds a magnifying glass, focusing on a colorful financial chart with bar and line graphs labeled 'Market Trends'. Surrounding icons represent key business metrics like growth, decline, market share, and innovation. This flat design graphic is ideal for presentations, reports, and web content related to data analytics, strategic planning, and financial performance evaluation, symbolizing the scrutiny of data to identify opportunities and understand market dynamics. Decrease diagram line icon illustrations Business Analysis and Market Trends Concept with Magnifying Glass. A conceptual vector illustration depicting business analysis and market research. A hand holds. A conceptual vector illustration depicting business analysis and market research. A hand holds a magnifying glass, focusing on a colorful financial chart with bar and line graphs labeled 'Market Trends'. Surrounding icons represent key business metrics like growth, decline, market share, and innovation. This flat design graphic is ideal for presentations, reports, and web content related to data analytics, strategic planning, and financial performance evaluation, symbolizing the scrutiny of data to identify opportunities and understand market dynamics.
Free with trial Illustration of a growing sales funnel depth with a deep funnel filling with gold coins, a stream of downward arrows, and a simple payment terminal. Vector flat icon design on a white background for a prospect conversion illustration --chaos 30 --ar 16:9 --v 7 Job ID: 03afdd75-fca3-49f5-98d4-f73b21faf025. Decrease diagram line icon illustrations Money Loss Concept Coins Falling Through Funnel into Pile, Money Decreasing Near Payment Terminal. Illustration of a growing sales funnel depth with a deep. Illustration of a growing sales funnel depth with a deep funnel filling with gold coins, a stream of downward arrows, and a simple payment terminal. Vector flat icon design on a white background for a prospect conversion illustration --chaos 30 --ar 16:9 --v 7 Job ID: 03afdd75-fca3-49f5-98d4-f73b21faf025
Free with trial Arrow Direction and Percentage Icons for Business Growth Concept. Decrease diagram line icon illustrations Arrow Direction and Percentage Icons for Business Growth Concept
Free with trial Illustration of a growing energy independence with a simple oil barrel with a decreasing sign, a solar panel receiving sun, and a stylized wind turbine. Vector flat icon design on a white background for a resource transition illustration --chaos 30 --ar 16:9 --v 7 Job ID: 592d63c7-ea9f-4b58-8aae-19f2fa4830a1. Decrease diagram line icon illustrations Energy Transition Solar, Wind, Oil Barrel, and Falling Market Graph. Illustration of a growing energy independence with a simple oil barrel with a decreasing. Illustration of a growing energy independence with a simple oil barrel with a decreasing sign, a solar panel receiving sun, and a stylized wind turbine. Vector flat icon design on a white background for a resource transition illustration --chaos 30 --ar 16:9 --v 7 Job ID: 592d63c7-ea9f-4b58-8aae-19f2fa4830a1
Free with trial Pair of black scissors cutting a blue sticky note on a bright yellow background. Concept of budget cuts, reducing costs, price reduction, tax cuts, and creative editing or craft projects. Decrease diagram line icon illustrations Pair of black scissors cutting a blue sticky note on a bright yellow background. Concept of budget cuts, reducing costs, price reduction, tax cuts, and
Free with trial A collection of nine flat black icons representing security insurance risk assessment and business compliance. Decrease diagram line icon vectors Collection Of Simple Black Silhouette Elements Representing Security Law Insurance Document Assessment And Crisis. A collection of nine flat black icons. A collection of nine flat black icons representing security insurance risk assessment and business compliance.
Free with trial This vector illustration shows a financial chart with green bar graphs, arrows indicating downfalls, a dollar coin and money bag. It conveys a financial concept. Decrease diagram line icon vectors Financial Chart Showing Market Trends with Dollar Signs and Green Arrows. This vector illustration shows a financial chart with green bar graphs, arrows. This vector illustration shows a financial chart with green bar graphs, arrows indicating downfalls, a dollar coin and money bag. It conveys a financial concept.
Free with trial Three abstract designs featuring circular dot patterns against a transparent background. The designs include a red, a purple, and an orange pattern, each with a central empty space and outwardly expanding dots that form circular and wavy shapes. The dots decrease in size as they extend from the center, creating a dynamic, radiating effect. Decrease diagram line icon vectors Three abstract designs featuring circular dot patterns against a transparent background. The designs include a red, a purple, and an orange pattern, each with
Free with trial Collection of simple black vector icons representing financial charts, data analysis graphs, and business statistics. Includes trend arrows, magnifier, and settings symbols. Decrease diagram line icon illustrations Set of black business graph and chart icons for data analysis. Collection of simple black vector icons representing financial charts, data analysis graphs, and. Collection of simple black vector icons representing financial charts, data analysis graphs, and business statistics. Includes trend arrows, magnifier, and settings symbols
Free with trial Wavy green arrows visualizing market movement, trend fluctuation, and economic volatility, depicting both growth and decline, ideal for financial data and business analytics concepts. Decrease diagram line icon illustrations Wavy arrows showing up and down fluctuation trend. Wavy green arrows visualizing market movement, trend fluctuation, and economic volatility, depicting both. Wavy green arrows visualizing market movement, trend fluctuation, and economic volatility, depicting both growth and decline, ideal for financial data and business analytics concepts
Free with trial Staircase ladder concept infographic outline style with 3 point template with rectangle box with round rectangle outline inside on stacked shape for slide presentation vector. Decrease diagram line icon illustrations Staircase ladder concept infographic outline style with 3 point template with rectangle box with round rectangle outline inside on. Stacked shape for slide
Free with trial This vector graphic depicts a magnifying glass focused on a female figure and a declining bar graph, symbolizing the. Decrease diagram line icon illustrations Women\'s Job Loss Magnifying Glass on Female Employment Decline. This vector graphic depicts a magnifying glass focused on a female figure and a declining bar. This vector graphic depicts a magnifying glass focused on a female figure and a declining bar graph, symbolizing the.
Free with trial A graphic illustration featuring two distinct charts on a white background. The upper chart displays three descending lines in black, red, and green, each ending with a downward-pointing arrow. Below this, a bar chart shows three black bars of increasing height, with arrows pointing upwards from the tallest bars. A stylized black graphic element resembling diverging paths or a funnel is positioned. Decrease diagram line icon vectors Downward and upward trending graphs with arrows chart. A graphic illustration featuring two distinct charts on a white background. The upper chart displays three. A graphic illustration featuring two distinct charts on a white background. The upper chart displays three descending lines in black, red, and green, each ending with a downward-pointing arrow. Below this, a bar chart shows three black bars of increasing height, with arrows pointing upwards from the tallest bars. A stylized black graphic element resembling diverging paths or a funnel is positioned
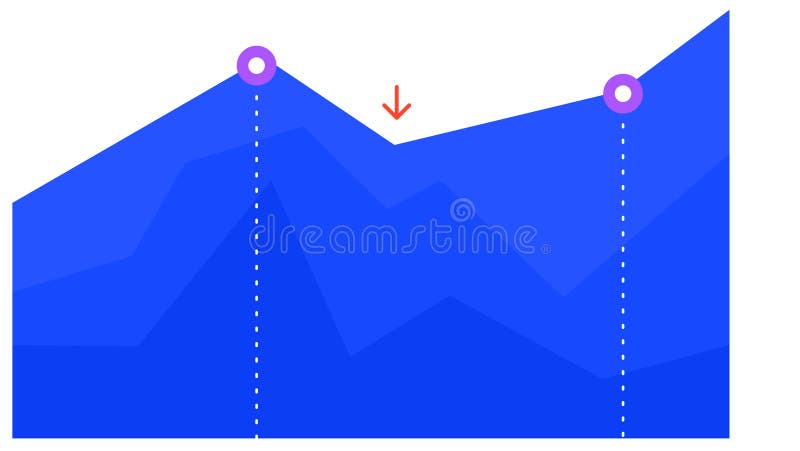
Free with trial Blue graph chart is visually representing growth, decline, and subsequent recovery, with two key points highlighted by purple circles and a red arrow indicating a temporary dip. Decrease diagram line icon vectors Blue graph chart is visually representing growth, decline, and subsequent recovery, with two key points highlighted by. Purple circles and a red arrow. Blue graph chart is visually representing growth, decline, and subsequent recovery, with two key points highlighted by purple circles and a red arrow indicating a temporary dip
Free with trial Blue graph chart is visually representing growth, decline, and subsequent recovery, with two key points highlighted by purple circles and a red arrow indicating a temporary dip. Decrease diagram line icon illustrations Blue graph chart is visually representing growth, decline, and subsequent recovery, with two key points highlighted by. Purple circles and a red arrow. Blue graph chart is visually representing growth, decline, and subsequent recovery, with two key points highlighted by purple circles and a red arrow indicating a temporary dip
Free with trial A logo for a data visualization service, a simple chart bar forming a sharp, singular peak, vector graphic design on a white background, simple minimalistic style, flat color, sunflower yellow color palette, vector graphics, vector illustration, logo, professional logo, logo design, high-quality graphic designer work, logo icon --chaos 30 --ar 16:9 --v 7 Job ID: a54fbe77-4416-47fc-b767-. Decrease diagram line icon illustrations Yellow Waveform Graph on White Background, Representing Data, Analytics, or Sound. A logo for a data visualization service, a simple chart bar forming a sharp. a logo for a data visualization service, a simple chart bar forming a sharp, singular peak, vector graphic design on a white background, simple minimalistic style, flat color, sunflower yellow color palette, vector graphics, vector illustration, logo, professional logo, logo design, high-quality graphic designer work, logo icon --chaos 30 --ar 16:9 --v 7 Job ID: a54fbe77-4416-47fc-b767-
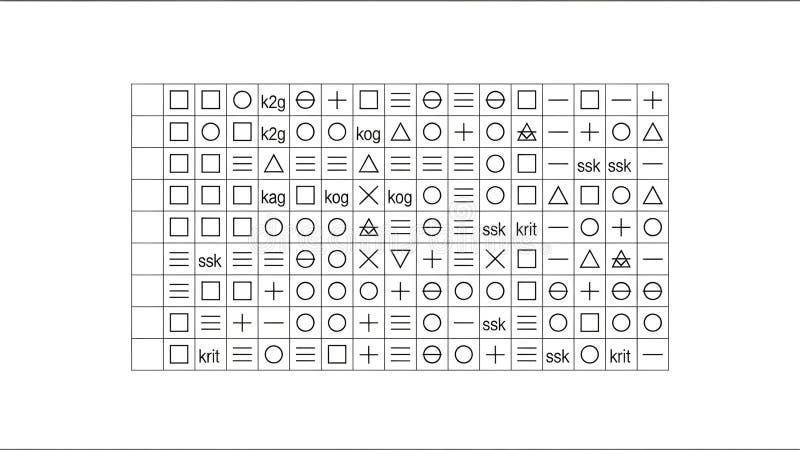
Free with trial A detailed black and white illustration of a complex knitting pattern chart on a clean white background. The grid is filled with various symbols, including geometric shapes like circles, squares, and triangles, alongside standard knitting abbreviations such as 'k2g', 'ssk', and 'kog'. This graphic represents a stitch legend or a visual guide for creating intricate lace or colorwork designs. It's perfect for craft-related websites, publications, tutorials, and projects that require a visual representation of handmade instructions, patterns, or complex codes. Decrease diagram line icon illustrations Knitting Pattern Chart with Symbols and Abbreviations. A detailed black and white illustration of a complex knitting pattern chart on a clean white background. A detailed black and white illustration of a complex knitting pattern chart on a clean white background. The grid is filled with various symbols, including geometric shapes like circles, squares, and triangles, alongside standard knitting abbreviations such as 'k2g', 'ssk', and 'kog'. This graphic represents a stitch legend or a visual guide for creating intricate lace or colorwork designs. It's perfect for craft-related websites, publications, tutorials, and projects that require a visual representation of handmade instructions, patterns, or complex codes.
Free with trial A stylized image depicts a magnifying glass focusing on a declining bar graph being passed from one hand to another. Decrease diagram line icon illustrations Declining Market Analysis Magnifying Glass, Graph, Hands. A stylized image depicts a magnifying glass focusing on a declining bar graph being passed from one. A stylized image depicts a magnifying glass focusing on a declining bar graph being passed from one hand to another.
Free with trial Abstract illustration showing a downward trend arrow, suitable for depicting loss, decline, or reduction. Decrease diagram line icon vectors Downward Trend Arrow Illustration: Financial Loss, Market Decline, or Data Reduction. Abstract illustration showing a downward trend arrow, suitable for. Abstract illustration showing a downward trend arrow, suitable for depicting loss, decline, or reduction.
Free with trial A comprehensive set of financial and data visualization icons, perfect for illustrating business and economic concepts. This collection includes a growing bar chart with an upward trend, a declining bar chart with a downward trend, and a mixed bar chart. Also featured are stacks of global currencies (USD, Euro, INR), a segmented pie chart, and a world map colored green and red to signify global market conditions or data distribution. Ideal for presentations, reports, websites, and educational materials related to economics, finance, and market analysis. Decrease diagram line icon vectors Global Financial and Business Data Visualization Icons Set. A comprehensive set of financial and data visualization icons, perfect for illustrating business and. A comprehensive set of financial and data visualization icons, perfect for illustrating business and economic concepts. This collection includes a growing bar chart with an upward trend, a declining bar chart with a downward trend, and a mixed bar chart. Also featured are stacks of global currencies (USD, Euro, INR), a segmented pie chart, and a world map colored green and red to signify global market conditions or data distribution. Ideal for presentations, reports, websites, and educational materials related to economics, finance, and market analysis.
Free with trial Conceptual image showing a magnifying glass focusing on a business presentation with a declining graph. Decrease diagram line icon illustrations Decline Analysis Magnifying Glass on Business Loss Graph. Conceptual image showing a magnifying glass focusing on a business presentation with a declining graph. Conceptual image showing a magnifying glass focusing on a business presentation with a declining graph.
Free with trial Conceptual image depicting declining sales and the need for analysis. Decrease diagram line icon illustrations Declining Sales Analysis Magnifying Glass, Chart, Calendar. Conceptual image depicting declining sales and the need for analysis. Conceptual image depicting declining sales and the need for analysis.
Free with trial A magnifying glass focuses on a declining bar graph and an exclamation point, symbolizing a potential problem or risk. Decrease diagram line icon illustrations Declining Sales Alert Magnifying Glass on Downward Graph. A magnifying glass focuses on a declining bar graph and an exclamation point, symbolizing a potential. A magnifying glass focuses on a declining bar graph and an exclamation point, symbolizing a potential problem or risk.
Free with trial Business data analysis and statistics icons. Collection of business data analysis and statistics icons on white background. Decrease diagram line icon illustrations Business data analysis and statistics icons. Collection of business data analysis and statistics icons on white background
Free with trial A downward trending bar graph with a question mark is examined under a magnifying glass, symbolizing uncertainty and. Decrease diagram line icon illustrations Decreasing Chart Under Magnifying Glass with Question Mark. A downward trending bar graph with a question mark is examined under a magnifying glass, symbolizing. A downward trending bar graph with a question mark is examined under a magnifying glass, symbolizing uncertainty and.
Free with trial A magnifying glass focuses on a bar graph showing a downward trend, combined with a puzzle piece element, symbolizing a. Decrease diagram line icon illustrations Decline Analysis Magnifying Glass, Puzzle, and Downward Trend. A magnifying glass focuses on a bar graph showing a downward trend, combined with a puzzle piece. A magnifying glass focuses on a bar graph showing a downward trend, combined with a puzzle piece element, symbolizing a.
Free with trial A clean, minimalist vector illustration of a bar chart featuring three distinct columns. The columns are colored in vibrant orange, teal, and yellow, representing different data points or categories. The chart is set against a white background with a dark blue axis line, making it ideal for presentations, reports, and infographics focused on data visualization, business growth, or financial analysis. Decrease diagram line icon vectors Simple Bar Chart with Three Columns. A clean, minimalist vector illustration of a bar chart featuring three distinct columns. The columns are colored in vibrant. A clean, minimalist vector illustration of a bar chart featuring three distinct columns. The columns are colored in vibrant orange, teal, and yellow, representing different data points or categories. The chart is set against a white background with a dark blue axis line, making it ideal for presentations, reports, and infographics focused on data visualization, business growth, or financial analysis.
Free with trial Stylized flat vector graph displaying a downward trend with percentage symbols; composed against a stark black background for emphasis. Decrease diagram line icon vectors Downward Trend Graph Illustration Showing Declining Percentage Values on Black Backdrop. Stylized flat vector graph displaying a downward trend with percentage. Stylized flat vector graph displaying a downward trend with percentage symbols; composed against a stark black background for emphasis.
Free with trial A magnifying glass focuses on a downward trend graph and briefcase, symbolizing economic downturn analysis and market. Decrease diagram line icon illustrations Economic Downturn Analysis Magnifying Glass on Market Decline. A magnifying glass focuses on a downward trend graph and briefcase, symbolizing economic downturn. A magnifying glass focuses on a downward trend graph and briefcase, symbolizing economic downturn analysis and market.
Free with trial Collection of Business and Technology Icons Set. A grid of various icons related to business technology and data analysis. Generative AI. Decrease diagram line icon illustrations Collection of Business and Technology Icons Set. A grid of various icons related to business technology and data analysis. Generative AI
Free with trial A flat style illustration of market trend with upward and downward arrows and wavy lines against black background. Decrease diagram line icon vectors Stock market trend illustration showing upward and downward direction in financial trading. A flat style illustration of market trend with upward and downward. A flat style illustration of market trend with upward and downward arrows and wavy lines against black background.
Free with trial A graphic element featuring three solid black, block-style arrows pointing towards the right. The arrows are arranged diagonally from top-left to bottom-right, and each subsequent arrow is visibly smaller, illustrating concepts of decrease, progression, or movement in scale. The element is isolated on a white background. Decrease diagram line icon illustrations Three Decreasing Black Arrows Pointing Right. A graphic element featuring three solid black, block-style arrows pointing towards the right. The arrows are. A graphic element featuring three solid black, block-style arrows pointing towards the right. The arrows are arranged diagonally from top-left to bottom-right, and each subsequent arrow is visibly smaller, illustrating concepts of decrease, progression, or movement in scale. The element is isolated on a white background.
Free with trial Candlestick chart icons on a digital trading screen showing market movements, price trends and investment data for finance, stock analysis, trading strategy and economic growth. Decrease diagram line icon illustrations Candlestick chart displaying financial market data analysis. Candlestick chart icons on a digital trading screen showing market movements, price trends and. Candlestick chart icons on a digital trading screen showing market movements, price trends and investment data for finance, stock analysis, trading strategy and economic growth
Free with trial Collection of simple black vector icons representing financial charts, data analysis graphs, and business statistics. Includes trend arrows, magnifier, and settings symbols. Decrease diagram line icon vectors Set of black business graph and chart icons for data analysis. Collection of simple black vector icons representing financial charts, data analysis graphs, and. Collection of simple black vector icons representing financial charts, data analysis graphs, and business statistics. Includes trend arrows, magnifier, and settings symbols
Free with trial A downward trend is shown on a graph. The graph is black and white. Decrease diagram line icon illustrations A downward trend is shown on a graph. The graph is black and white
Free with trial A vibrant and modern illustration of a bar graph, featuring four bars of varying heights and colors: blue, green, orange, and red. The bars are positioned on a gray horizontal line, creating a sense of data comparison and visual hierarchy. This image is ideal for representing data, statistics, business reports, financial analysis, or any concept requiring visual data representation. The clean design and bright colors make it suitable for presentations, websites, and marketing materials. Decrease diagram line icon illustrations Colorful Bar Graph Illustration. A vibrant and modern illustration of a bar graph, featuring four bars of varying heights and colors: blue, green, orange, and. A vibrant and modern illustration of a bar graph, featuring four bars of varying heights and colors: blue, green, orange, and red. The bars are positioned on a gray horizontal line, creating a sense of data comparison and visual hierarchy. This image is ideal for representing data, statistics, business reports, financial analysis, or any concept requiring visual data representation. The clean design and bright colors make it suitable for presentations, websites, and marketing materials.
Free with trial A simple black and white illustration of a downward trend graph, showing a decline. The graph is hand-drawn. Decrease diagram line icon illustrations Hand-drawn Black Downward Trend Graph on White Background. A simple black and white illustration of a downward trend graph, showing a decline. The graph is hand. A simple black and white illustration of a downward trend graph, showing a decline. The graph is hand-drawn
Free with trial Hand-drawn graph showing a market downturn and decline, minimalist representation. AI generated. Decrease diagram line icon vectors Hand-drawn graph showing a market downturn and decline, minimalist representation. AI generated
Free with trial Magnifying glass with reduce CO2 emissions carbon symbol on green background. Decrease diagram line icon vectors Magnifying glass with reduce CO2 emissions carbon symbol. On green background
Free with trial Business data is visually represented in black and white through various charts and graphs illustrating growth analysis and strategic planning for financial reporting showing a clear picture of market. Decrease diagram line icon vectors Black and white business data visualization with charts and graphs showing growth and analysis for financial reporting and. Business data is visually represented. Business data is visually represented in black and white through various charts and graphs illustrating growth analysis and strategic planning for financial reporting showing a clear picture of market
Free with trial A collection of minimalist, gray 3D icons representing various data points and processes, including charts, graphs, documents, cloud computing, location markers, and alerts. The design suggests data analysis, project management, or business intelligence concepts. Decrease diagram line icon illustrations Data Visualization Icons. A collection of minimalist, gray 3D icons representing various data points and processes, including charts, graphs, documents, cloud. A collection of minimalist, gray 3D icons representing various data points and processes, including charts, graphs, documents, cloud computing, location markers, and alerts. The design suggests data analysis, project management, or business intelligence concepts.
Free with trial A conceptual vector illustration depicting the duality of business performance. On a modern teal background, two reports are shown side-by-side. One features a rising red graph symbolizing growth, profit, and success, while the other displays a descending graph representing decline, loss, and failure. This flat design graphic is ideal for financial analysis, market trend comparisons, business presentations, and infographics illustrating opposite outcomes or strategic choices. The long shadow effect adds a contemporary feel to the design. Decrease diagram line icon vectors Growth and Decline Business Charts Comparison. A conceptual vector illustration depicting the duality of business performance. On a modern teal background, two. A conceptual vector illustration depicting the duality of business performance. On a modern teal background, two reports are shown side-by-side. One features a rising red graph symbolizing growth, profit, and success, while the other displays a descending graph representing decline, loss, and failure. This flat design graphic is ideal for financial analysis, market trend comparisons, business presentations, and infographics illustrating opposite outcomes or strategic choices. The long shadow effect adds a contemporary feel to the design.
Free with trial A 3D png of a red jagged arrow pointing downwards. This graphic represents a decline in stock markets, financial loss, economic recession, or a negative business trend, isolated on a white background. Decrease diagram line icon vectors Red downward trend arrow financial crisis concept isolated on transparent background. A 3D png of a red jagged arrow pointing downwards. This graphic represents. A 3D png of a red jagged arrow pointing downwards. This graphic represents a decline in stock markets, financial loss, economic recession, or a negative business trend, isolated on a white background.
Free with trial Flat design business icons depict various charts, percentage signs, targets, hierarchical diagrams, and coin stacks representing financial growth and data analysis in monochrome. Generative AI. Decrease diagram line icon vectors Black and white flat design business icons including charts percentage target and money stacks illustrating financial growth and. Flat design business icons. Flat design business icons depict various charts, percentage signs, targets, hierarchical diagrams, and coin stacks representing financial growth and data analysis in monochrome. Generative AI
Free with trial A magnifying glass focuses on a dollar sign with a downward arrow, symbolizing cost reduction, economic downturn, or. Decrease diagram line icon illustrations Cost Reduction Analysis Magnifying Glass on Downward Dollar. A magnifying glass focuses on a dollar sign with a downward arrow, symbolizing cost reduction. A magnifying glass focuses on a dollar sign with a downward arrow, symbolizing cost reduction, economic downturn, or.
Free with trial Outline vector graphic depicting a decline in business performance. Decrease diagram line icon illustrations Declining Performance Gear, Man, Graph, Arrow. Business Downturn. Outline vector graphic depicting a decline in business performance. Outline vector graphic depicting a decline in business performance.
Free with trial Conceptual image depicting job loss and economic downturn. Decrease diagram line icon illustrations Job Loss Analysis Magnifying Glass on Downward Trend, Layoffs. Conceptual image depicting job loss and economic downturn. Conceptual image depicting job loss and economic downturn.
Free with trial Conceptual image representing cost cutting and financial analysis. Decrease diagram line icon illustrations Cost Cutting Analysis Scissors Cutting Downward Graph Under Magnifier. Conceptual image representing cost cutting and financial analysis. Conceptual image representing cost cutting and financial analysis.
Free with trial Abstract Arrow Design Featuring Geometric Shapes, Illustrating a Downward Trend or. Decline in a Conceptual Graphic. Decrease diagram line icon vectors Abstract Arrow Design Featuring Geometric Shapes, Illustrating a Downward Trend or. Decline in a Conceptual Graphic
Free with trial Two circular icons representing plus and minus signs, a basic mathematical concept. Decrease diagram line icon vectors A simple illustration showing two black circles one with a plus and one. Two circular icons representing plus and minus signs, a basic mathematical concept. Two circular icons representing plus and minus signs, a basic mathematical concept.
Free with trial Black Wi-Fi symbol composed of four semicircular arcs and a pointed bottom segment, set against a pale pink background. The arcs decrease in size from top to bottom, forming a cohesive and symmetrical design. This icon typically represents wireless internet connectivity. Decrease diagram line icon vectors Semicircular Wi-Fi symbol with pointed bottom on pale pink. Black Wi-Fi symbol composed of four semicircular arcs and a pointed bottom segment, set against a. Black Wi-Fi symbol composed of four semicircular arcs and a pointed bottom segment, set against a pale pink background. The arcs decrease in size from top to bottom, forming a cohesive and symmetrical design. This icon typically represents wireless internet connectivity.
Free with trial A black industrial pipeline is entwined with green vines, symbolizing nature reclaiming technology. In the background, solar panels and white wind turbines populate the green field under a bright sun, contrasting with the fossil fuel infrastructure. Leaves swirl through the air, reflecting movement toward renewable energy sources. The scene depicts the transition from traditional energy to sustainable alternatives, underlining the harmonious blend of technology and nature for a greener future. Decrease diagram line icon illustrations From Fossil Fuels to a Greener Future. A black industrial pipeline is entwined with green vines, symbolizing nature reclaiming technology. In the background. A black industrial pipeline is entwined with green vines, symbolizing nature reclaiming technology. In the background, solar panels and white wind turbines populate the green field under a bright sun, contrasting with the fossil fuel infrastructure. Leaves swirl through the air, reflecting movement toward renewable energy sources. The scene depicts the transition from traditional energy to sustainable alternatives, underlining the harmonious blend of technology and nature for a greener future.
Free with trial A black industrial pipeline is entwined with green vines, symbolizing nature reclaiming technology. In the background, solar panels and white wind turbines populate the green field under a bright sun, contrasting with the fossil fuel infrastructure. Leaves swirl through the air, reflecting movement toward renewable energy sources. The scene depicts the transition from traditional energy to sustainable alternatives, underlining the harmonious blend of technology and nature for a greener future. Decrease diagram line icon illustrations From Fossil Fuels to a Greener Future. A black industrial pipeline is entwined with green vines, symbolizing nature reclaiming technology. In the background. A black industrial pipeline is entwined with green vines, symbolizing nature reclaiming technology. In the background, solar panels and white wind turbines populate the green field under a bright sun, contrasting with the fossil fuel infrastructure. Leaves swirl through the air, reflecting movement toward renewable energy sources. The scene depicts the transition from traditional energy to sustainable alternatives, underlining the harmonious blend of technology and nature for a greener future.
Free with trial Sketchy bar graph illustration of financial decline and economic loss. AI generated. Decrease diagram line icon vectors Sketchy bar graph illustration of financial decline and economic loss. AI generated
 Sign in