Free with trial Presentation board line icon. Neumorphic, Flat shadow, 3d buttons. Column graph sign. Growth diagram symbol. Line presentation board icon. Social media icons. Vector. Decrease diagram vector vectors Presentation board line icon. Column graph sign. Neumorphic buttons. Vector. Presentation board line icon. Neumorphic, Flat shadow, 3d buttons. Column graph sign. Growth diagram symbol. Line presentation board icon. Social media icons. Vector
Free with trial This image is a simple vector graphic depicting a downward trending line graph. The graph is enclosed in a square with a bold black border and shows a blue line indicating a decrease in values over ti. Decrease diagram vector illustrations Downward Trend Graph, Data Decline Icon. This image is a simple vector graphic depicting a downward trending line graph. The graph is enclosed in a square with a bold black border and shows a blue line indicating a decrease in values over ti
Free with trial Set of six black business charts icons showing growth and decline trends with arrows and bars in vector style clear and simple design calm. Generative AI. Decrease diagram vector vectors Business growth and decline charts arrows statistics bar graph icons vector illustration. Set of six black business charts icons showing growth and decline trends with arrows and bars in vector style clear and simple design calm. Generative AI
Free with trial Economic crisis line icon of investment decline with arrow down, vector outline symbol. Global economy downturn and bankruptcy or world crisis in banking business and stock exchange decrease. Decrease diagram vector vectors Economic crisis line icon of investment decline
Free with trial Pie chart line icon. Halftone dotted pattern. Gradient icon with grain shadow. Presentation graph sign. Market analytics symbol. Line pie chart icon. Various designs. Vector. Decrease diagram vector vectors Pie chart line icon. Presentation graph sign. Halftone dotted pattern. Vector. Pie chart line icon. Halftone dotted pattern. Gradient icon with grain shadow. Presentation graph sign. Market analytics symbol. Line pie chart icon. Various designs. Vector
Free with trial Report line icon. Halftone dotted pattern. Gradient icon with grain shadow. Column graph, pie chart sign. Market analytics symbol. Line report icon. Various designs. Vector. Decrease diagram vector vectors Report line icon. Column graph, pie chart sign. Halftone dotted pattern. Vector. Report line icon. Halftone dotted pattern. Gradient icon with grain shadow. Column graph, pie chart sign. Market analytics symbol. Line report icon. Various designs. Vector
Free with trial Decreasing graph line icon. Halftone dotted pattern. Gradient icon with grain shadow. Column chart sign. Market analytics symbol. Line decreasing graph icon. Various designs. Vector. Decrease diagram vector vectors Decreasing graph line icon. Column chart sign. Halftone dotted pattern. Vector. Decreasing graph line icon. Halftone dotted pattern. Gradient icon with grain shadow. Column chart sign. Market analytics symbol. Line decreasing graph icon. Various designs. Vector
Free with trial Report line icon. Halftone dotted pattern. Gradient icon with grain shadow. Column graph, pie chart sign. Market analytics symbol. Line report icon. Various designs. Vector. Decrease diagram vector vectors Report line icon. Column graph, pie chart sign. Halftone dotted pattern. Vector. Report line icon. Halftone dotted pattern. Gradient icon with grain shadow. Column graph, pie chart sign. Market analytics symbol. Line report icon. Various designs. Vector
Free with trial Pie chart line icon. Halftone dotted pattern. Gradient icon with grain shadow. Presentation 3d graph sign. Market analytics symbol. Line pie chart icon. Various designs. Vector. Decrease diagram vector vectors Pie chart line icon. Presentation 3d graph sign. Halftone dotted pattern. Vector. Pie chart line icon. Halftone dotted pattern. Gradient icon with grain shadow. Presentation 3d graph sign. Market analytics symbol. Line pie chart icon. Various designs. Vector
Free with trial Weight Loss Line Icon, Fitness Health Waist Symbol Vector Illustration. Decrease diagram vector vectors Weight Loss Line Icon, Fitness Health Waist Symbol Vector Illustration
Free with trial Decrease and increase chart icon with arrow. Negative and positive trend symbol illustration. Decrease diagram vector vectors Decrease and increase chart icon with arrow. Negative and positive trend symbol
Free with trial A simple and clean line art icon of a graph, isolated on a white background. This vector illustration features a line chart with axes, showing a fluctuating trend with distinct data points. The minimalist design makes it perfect for various applications related to business, finance, and data analysis. Ideal for use in presentations, infographics, websites, mobile apps, and user interfaces to represent concepts like statistics, growth, market trends, performance reports, and financial analytics. A versatile symbol for progress and data visualization. Decrease diagram vector illustrations Analytics Line Graph Vector Icon. A simple and clean line art icon of a graph, isolated on a white background. This vector illustration features a line chart with axes, showing a fluctuating trend with distinct data points. The minimalist design makes it perfect for various applications related to business, finance, and data analysis. Ideal for use in presentations, infographics, websites, mobile apps, and user interfaces to represent concepts like statistics, growth, market trends, performance reports, and financial analytics. A versatile symbol for progress and data visualization.
Free with trial Economic crisis icon of price low down or stock market depreciation, vector line symbol. Global economy and business downturn with financial crisis and prices decrease or percent down low. Decrease diagram vector illustrations Economic crisis icon, price low down, stock market. Economic crisis icon of price low down or stock market depreciation, vector line symbol. Global economy and business downturn with financial crisis and prices decrease or percent down low
Free with trial Decline chart icon. Falling bars symbol. Downward trend illustration. Vector image. EPS 10. Decrease diagram vector vectors Decline chart icon. Falling bars symbol. Downward trend illustration. Vector image.
Free with trial A circular arrangement of colorful heart shapes creates a radial design against a white background. The hearts, in shades of green, blue, orange, red, and purple, decrease in size toward the center, forming concentric circles. This vector illustration is likely themed for Valentine's Day, emphasizing themes of love and romance through its vibrant and symmetrical heart pattern. Decrease diagram vector illustrations Colorful Hearts Circle Frame Valentine\'s Day Vector Card Background Romantic Love Design Stock Illustration. A circular arrangement of colorful heart shapes creates a radial design against a white background. The hearts, in shades of green, blue, orange, red, and purple, decrease in size toward the center, forming concentric circles. This vector illustration is likely themed for Valentine's Day, emphasizing themes of love and romance through its vibrant and symmetrical heart pattern.
Free with trial Economic crisis icon, analysis of global market economy downturn and bankruptcy, vector line symbol. Magnifier and arrow down icon of stock exchange and economical index decrease of financial crisis. Decrease diagram vector vectors Economic crisis icon, analysis of market downturn. Economic crisis icon, analysis of global market economy downturn and bankruptcy, vector line symbol. Magnifier and arrow down icon of stock exchange and economical index decrease of financial crisis
Free with trial Professional Vector Logo Design High-Resolution & Fully Editable This high-quality vector logo is designed with precision and creativity making it ideal for modern businesses, startups, and creative professionals The design is clean, scalable, and easy to customize�perfect for branding marketing materials, websites, and print applications. Key Features:100% Vector format (AI EPS SVG)Fully editable (colors, text, and shapes)High resolution � perfect for both web and print Modern, professional, and versatile design Ready for branding and promotional use Elevate your brand with this premium quality logo!. Decrease diagram vector vectors Dementia icon editable stock vector logo design. Professional Vector Logo Design High-Resolution & Fully Editable This high-quality vector logo is designed with precision and creativity making it ideal for modern businesses, startups, and creative professionals The design is clean, scalable, and easy to customize�perfect for branding marketing materials, websites, and print applications. Key Features:100% Vector format (AI EPS SVG)Fully editable (colors, text, and shapes)High resolution � perfect for both web and print Modern, professional, and versatile design Ready for branding and promotional use Elevate your brand with this premium quality logo!
Free with trial Carbon capture storage sequestration technology composition with isometric icons of capturing compression and injection of co2 vector illustration. Decrease diagram vector illustrations Carbon Capture Diagram Composition. Carbon capture storage sequestration technology composition with isometric icons of capturing compression and injection of co2 vector illustration
Free with trial Carbon capture storage sequestration technology composition with isometric icons of capturing compression and injection of co2 vector illustration. Decrease diagram vector vectors Carbon Capture Diagram Composition. Carbon capture storage sequestration technology composition with isometric icons of capturing compression and injection of co2 vector illustration
Free with trial Gold coins with arrows and graphs pointing up or down. Financial growth. Market decline. Crisis and recession. Statistics chart. Finance success. Increase or decrease cash infographic. Vector concept. Decrease diagram vector vectors Gold coins with arrows and graphs pointing up or down. Financial growth. Market decline. Crisis and recession. Statistics chart
Free with trial A gradient halftone pattern transitioning from black to white. The image features evenly spaced horizontal lines composed of small, elliptical dots. The dots gradually decrease in size and density from the left side of the image to the right, creating a smooth gradient effect. This design is commonly used in graphic design and printing to create shading and tonal effects using limited color palettes. Decrease diagram vector vectors Halftone graphic vector. A gradient halftone pattern transitioning from black to white. The image features evenly spaced horizontal lines composed of small, elliptical dots. The dots gradually decrease in size and density from the left side of the image to the right, creating a smooth gradient effect. This design is commonly used in graphic design and printing to create shading and tonal effects using limited color palettes.
Free with trial A simple and effective line graph illustrating the concept of debt reduction. The chart, on a clean white background, shows a green line trending downwards, representing a successful decrease in liabilities over time. A final red arrow emphasizes a significant or accelerated drop, symbolizing a successful financial strategy, cost-cutting, or achieving financial freedom. This vector illustration is perfect for presentations, articles, and infographics on personal or business finance, money management, and economic stability. Decrease diagram vector vectors Debt Reduction Concept Graph Showing Downward Trend. A simple and effective line graph illustrating the concept of debt reduction. The chart, on a clean white background, shows a green line trending downwards, representing a successful decrease in liabilities over time. A final red arrow emphasizes a significant or accelerated drop, symbolizing a successful financial strategy, cost-cutting, or achieving financial freedom. This vector illustration is perfect for presentations, articles, and infographics on personal or business finance, money management, and economic stability.
Free with trial Percentage arrow. rate increase and decrease concept. Decrease diagram vector vectors Percentage arrow. rate increase and decrease concept.
Free with trial Vector illustration of a downward arrow symbolizing economic decline, recession, and financial downturn. Decrease diagram vector vectors Vector illustration of a downward arrow symbolizing economic decline, recession
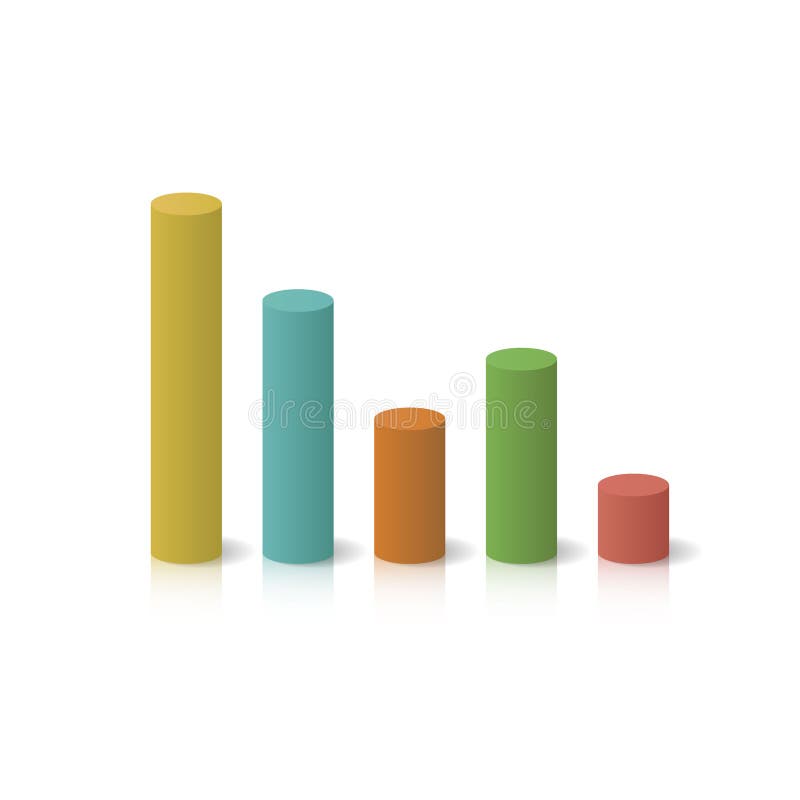
Free with trial Isometric colorful cylinder bar graph showing a financial decline. 3D chart representing loss, decrease, and business drop symbol. Decrease diagram vector vectors Isometric colorful cylinder bar graph showing a financial decline. 3D chart representing loss, decrease, and business drop
Free with trial Corn price going down decrease cheaper in commodity market international trading market vector. Decrease diagram vector vectors Corn price going down decrease cheaper in commodity market international trading market
Free with trial Declining bar chart. Wheat spikelets concept. Agricultural crisis symbol. Vector harvest illustration. EPS 10. Decrease diagram vector vectors Declining bar chart. Wheat spikelets concept. Agricultural crisis symbol. Vector harvest illustration.
Free with trial Rice grain price going down decrease cheaper in commodity market international trading market vector. Decrease diagram vector illustrations Rice grain price going down decrease cheaper in commodity market international trading market
Free with trial Silver price going down decrease cheaper in metal commodity market international trading market vector. Decrease diagram vector vectors Silver price going down decrease cheaper in metal commodity market international trading market
Free with trial Set line Mobile stock trading, Contract money and pen and Global economic crisis on seamless pattern. Vector. Decrease diagram vector illustrations Set line Mobile stock trading, Contract money and pen and Global economic crisis on seamless pattern. Vector
Free with trial Price drop icon. Cost reduction symbol. Oil value Vector. Cheap fuel. EPS 10. Decrease diagram vector vectors Price drop icon. Cost reduction symbol. Oil value Vector. Cheap fuel.
Free with trial Percent Arrow Icons Set: Growth, Increase, Decrease Filled Up and Down Arrows. Decrease diagram vector vectors Percent Arrow Icons Set: Growth, Increase, Decrease Filled Up and Down Arrows
Free with trial Set line Gold bars Glass money jar with coin Employee dismissal Drop crude oil price Bank building Pie chart infographic Briefcase and Dollar rate decrease icon. Vector. Decrease diagram vector illustrations Set line Gold bars, Glass money jar with coin, Employee dismissal, Drop crude oil price, Bank building, Pie chart. Set line Gold bars Glass money jar with coin. Set line Gold bars Glass money jar with coin Employee dismissal Drop crude oil price Bank building Pie chart infographic Briefcase and Dollar rate decrease icon. Vector.
Free with trial Set line Dollar rate decrease Mobile stock trading Shutdown of factory Falling property prices Global economic crisis Briefcase and Contract money and pen icon. Vector. Decrease diagram vector illustrations Set line Dollar rate decrease, Mobile stock trading, Shutdown of factory, Falling property prices, Global economic. Set line Dollar rate decrease Mobile stock trading Shutdown of factory Falling property prices Global economic crisis Briefcase and Contract money and pen icon. Vector.
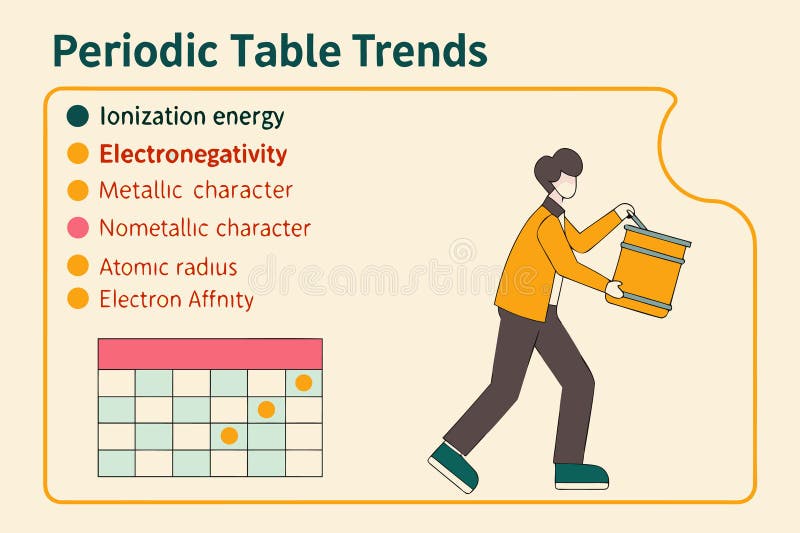
Free with trial Vector illustration depicting periodic table trends variety. Decrease diagram vector vectors Vector illustration depicting periodic table trends
Free with trial Set Drop in crude oil price Dollar rate decrease Global economic crisis Briefcase Stop delivery cargo truck and Hanging sign with Sale icon. Vector. Decrease diagram vector illustrations Set Drop in crude oil price, Dollar rate decrease, Global economic crisis, Briefcase, Stop delivery cargo truck and. Set Drop in crude oil price Dollar rate decrease Global economic crisis Briefcase Stop delivery cargo truck and Hanging sign with Sale icon. Vector.
Free with trial Set line Falling property prices, Shutdown of factory, Drop crude oil and Global economic crisis news icon. Vector. Decrease diagram vector illustrations Set line Falling property prices, Shutdown of factory, Drop crude oil and Global economic crisis news icon. Vector
Free with trial Wood lumber price going down decrease cheaper in timber log commodity market international trading market vector. Decrease diagram vector vectors Wood lumber price going down decrease cheaper in timber log commodity market international trading market
Free with trial Set line Shutdown of factory, Bank building, Global economic crisis news and Stop delivery cargo truck icon. Vector. Decrease diagram vector illustrations Set line Shutdown of factory, Bank building, Global economic crisis news and Stop delivery cargo truck icon. Vector
Free with trial Reduce animal products consumption. Eat less meat for wellbeing animal, environment. Changing eating habits to vegan diet. Flexitarian infographics, pyramid. Vector illustration on white background. Decrease diagram vector vectors The 5-step flexitarian diet. Healthy nutrition infographics. Vector illustration. Reduce animal products consumption. Eat less meat for wellbeing animal, environment. Changing eating habits to vegan diet. Flexitarian infographics, pyramid. Vector illustration on white background
Free with trial Electricity energy price going down decrease cheaper in electric commodity market international trading market vector. Decrease diagram vector vectors Electricity energy price going down decrease cheaper in electric commodity market international trading market
Free with trial This vector illustration shows a set of black graph icons with rising and falling charts indicated by arrows showing trends in data with clear simple design and sharp edges calm. Generative AI. Decrease diagram vector vectors Black graph icons set rising and falling charts with arrows vector illustration simple design. This vector illustration shows a set of black graph icons with rising and falling charts indicated by arrows showing trends in data with clear simple design and sharp edges calm. Generative AI
Free with trial Descending Bar Chart Illustration Depicting Decrease, Recession, Downturn with Arrow. Decrease diagram vector vectors Descending Bar Chart Illustration Depicting Decrease, Recession, Downturn with Arrow
Free with trial Uranium price going down decrease cheaper in metal mineral nuclear commodity market international trading market vector. Decrease diagram vector vectors Uranium price going down decrease cheaper in metal mineral nuclear commodity market international trading market
Free with trial Concentric heart shapes in flat vector design with a minimalist style. Black outlines progressively decrease in size, creating a layered effect. The illustration features five hearts centered on a plain white background, symbolizing love and romance. Decrease diagram vector illustrations Flat Design Love Vector Illustration Heart Icon Romantic Love Symbol Stock Art. Concentric heart shapes in flat vector design with a minimalist style. Black outlines progressively decrease in size, creating a layered effect. The illustration features five hearts centered on a plain white background, symbolizing love and romance.
Free with trial Pyramid chart line icon. Halftone dotted pattern. Gradient icon with grain shadow. Analytics graph sign. Market analytics symbol. Line pyramid chart icon. Various designs. Vector. Decrease diagram vector vectors Pyramid chart line icon. Analytics graph sign. Halftone dotted pattern. Vector. Pyramid chart line icon. Halftone dotted pattern. Gradient icon with grain shadow. Analytics graph sign. Market analytics symbol. Line pyramid chart icon. Various designs. Vector
Free with trial Graph line icon. Neumorphic, Flat shadow, 3d buttons. Column chart sign. Growth diagram symbol. Line graph chart icon. Social media icons. Vector. Decrease diagram vector vectors Graph line icon. Column chart sign. Neumorphic buttons. Vector. Graph line icon. Neumorphic, Flat shadow, 3d buttons. Column chart sign. Growth diagram symbol. Line graph chart icon. Social media icons. Vector
Free with trial Horizontal chart line icon. Halftone dotted pattern. Gradient icon with grain shadow. Column graph sign. Market analytics symbol. Line horizontal chart icon. Various designs. Vector. Decrease diagram vector vectors Horizontal chart line icon. Column graph sign. Halftone dotted pattern. Vector. Horizontal chart line icon. Halftone dotted pattern. Gradient icon with grain shadow. Column graph sign. Market analytics symbol. Line horizontal chart icon. Various designs. Vector
Free with trial Financial crisis concept. Decreasing graph with falling columns. Vector illustration showing recession, bankruptcy, and economic decline. Decrease diagram vector vectors Financial crisis concept. Decreasing graph with falling columns. Vector illustration showing recession, bankruptcy
Free with trial Coal price goes down drop decrease cheap in global commodity market trade export transaction energy stone mining vector. Decrease diagram vector vectors Coal price goes down drop decrease cheap in global commodity market trade export transaction energy stone mining
Free with trial Downward Trend Chart Illustration with Bars and Arrow Signifying Decrease Business and Finance Data. Decrease diagram vector vectors Downward Trend Chart Illustration with Bars and Arrow Signifying Decrease Business and Finance Data
Free with trial A graph with a reduction report. A dagram showing the recession and bankruptcy. Business and finance concept. Vector illustration. Decrease diagram vector vectors Graph with a reduction report. A dagram showing the recession and bankruptcy. Business and finance concept. Vector illustration
Free with trial This image is a simple vector graphic depicting a downward trending line graph. The graph is enclosed in a square with a bold black border and shows a blue line indicating a decrease in values over ti. Decrease diagram vector illustrations Downward Trend Graph, Data Decline Icon. This image is a simple vector graphic depicting a downward trending line graph. The graph is enclosed in a square with a bold black border and shows a blue line indicating a decrease in values over ti
Free with trial Report line icon. Continuous line with share plane. Column graph, pie chart sign. Market analytics symbol. 3d heart in speech bubble. Report single line ribbon. Loop curve pattern. Vector. Decrease diagram vector vectors Report line icon. Column graph, pie chart sign. Continuous line with plane. Vector. Report line icon. Continuous line with share plane. Column graph, pie chart sign. Market analytics symbol. 3d heart in speech bubble. Report single line ribbon. Loop curve pattern. Vector
Free with trial Analytics graph line icon. Neumorphic, Flat shadow, 3d buttons. Column chart sign. Growth diagram symbol. Line analytics graph icon. Social media icons. Vector. Decrease diagram vector vectors Analytics graph line icon. Column chart sign. Neumorphic buttons. Vector. Analytics graph line icon. Neumorphic, Flat shadow, 3d buttons. Column chart sign. Growth diagram symbol. Line analytics graph icon. Social media icons. Vector
Free with trial Pyramid chart line icon. Neumorphic, Flat shadow, 3d buttons. Analytics graph sign. Market analytics symbol. Line pyramid chart icon. Social media icons. Vector. Decrease diagram vector vectors Pyramid chart line icon. Analytics graph sign. Neumorphic buttons. Vector. Pyramid chart line icon. Neumorphic, Flat shadow, 3d buttons. Analytics graph sign. Market analytics symbol. Line pyramid chart icon. Social media icons. Vector
Free with trial Decreasing graph line icon. Continuous line big heart. Column chart sign. Market analytics symbol. 3d hearts in heart shaped loop. Decreasing graph single line ribbon. Loop curve pattern. Vector. Decrease diagram vector vectors Decreasing graph line icon. Column chart sign. Continuous line big heart. Vector. Decreasing graph line icon. Continuous line big heart. Column chart sign. Market analytics symbol. 3d hearts in heart shaped loop. Decreasing graph single line ribbon. Loop curve pattern. Vector
Free with trial Simple vector graph illustration showing increasing and decreasing trend with bars. Decrease diagram vector vectors Simple vector graph illustration showing increasing and decreasing trend with bars
Free with trial Graph line icon. Neumorphic, Flat shadow, 3d buttons. Column chart sign. Growth diagram symbol. Line graph chart icon. Social media icons. Vector. Decrease diagram vector vectors Graph line icon. Column chart sign. Neumorphic buttons. Vector. Graph line icon. Neumorphic, Flat shadow, 3d buttons. Column chart sign. Growth diagram symbol. Line graph chart icon. Social media icons. Vector
Free with trial Hand drawn style bar graph displaying a continuous downward trend and data decrease arrow. Decrease diagram vector vectors Hand drawn style bar graph displaying a continuous downward trend and data decrease arrow
Free with trial Set Safe Global economic crisis Stop delivery cargo truck Employee dismissal Pie chart infographic Dollar rate decrease and icon. Vector. Decrease diagram vector illustrations Set Safe, Global economic crisis, Stop delivery cargo truck, Employee dismissal, Pie chart infographic, Dollar rate. Set Safe Global economic crisis Stop delivery cargo truck Employee dismissal Pie chart infographic Dollar rate decrease and icon. Vector.
Free with trial Declining steps with downward arrow symbolizing business market decrease economic downturn. Decrease diagram vector vectors Declining steps with downward arrow symbolizing business market decrease economic downturn
Free with trial Bar chart with a declining arrow, representing decrease, business, finance, economic recession. Decrease diagram vector vectors Bar chart with a declining arrow, representing decrease, business, finance, economic recession
Free with trial Depreciation Icon Flat Vector. Clean and minimal graphic design. Decrease diagram vector vectors Depreciation Icon Flat Vector
Free with trial Graph phone line icon. Neumorphic, Flat shadow, 3d buttons. Column chart sign. Growth diagram symbol. Line graph phone icon. Social media icons. Vector. Decrease diagram vector vectors Graph phone line icon. Column chart sign. Neumorphic buttons. Vector. Graph phone line icon. Neumorphic, Flat shadow, 3d buttons. Column chart sign. Growth diagram symbol. Line graph phone icon. Social media icons. Vector
Free with trial A comprehensive visual guide displaying a collection of standard crochet stitch symbols. This chart features clear, vector icons for basic stitches like slip, chain, single, double, and treble crochet. It also includes symbols for essential techniques such as increase, decrease, skip stitch, turn, and fasten off. Isolated on a white background, this infographic is perfect as a legend or reference for crochet patterns, tutorials, books, and crafting blogs. An essential educational tool for anyone learning the art of crochet or needing a quick reminder of pattern notation. Decrease diagram vector illustrations Crochet Stitch Symbols Chart Guide. A comprehensive visual guide displaying a collection of standard crochet stitch symbols. This chart features clear, vector icons for basic stitches like slip, chain, single, double, and treble crochet. It also includes symbols for essential techniques such as increase, decrease, skip stitch, turn, and fasten off. Isolated on a white background, this infographic is perfect as a legend or reference for crochet patterns, tutorials, books, and crafting blogs. An essential educational tool for anyone learning the art of crochet or needing a quick reminder of pattern notation.
Free with trial A minimalist black line graph icon on a clean white background, clearly illustrating a downward trend. The zigzagging line culminates in a sharp arrow pointing downwards, symbolizing decline, decrease, or negative performance. This versatile vector illustration is ideal for representing financial losses, economic downturns, sales drops, market crashes, or any data indicating a negative trajectory. Perfect for business reports, presentations, websites, apps, and infographics requiring a clear visual indicator of reduction or poor results. Decrease diagram vector vectors Downward Trend Graph with Arrow Icon. A minimalist black line graph icon on a clean white background, clearly illustrating a downward trend. The zigzagging line culminates in a sharp arrow pointing downwards, symbolizing decline, decrease, or negative performance. This versatile vector illustration is ideal for representing financial losses, economic downturns, sales drops, market crashes, or any data indicating a negative trajectory. Perfect for business reports, presentations, websites, apps, and infographics requiring a clear visual indicator of reduction or poor results.
Free with trial Process reduction icon vector sign illustration. Decrease diagram vector vectors Process reduction icon vector
Free with trial A set of vector icons illustrating business process flow and funnel diagrams. The icons depict various stages of a process, including input, output, increase, decrease, equality, and filtration. These graphics can be used to represent sales funnels, customer journeys, or any other type of process flow in a business or marketing context. Decrease diagram vector illustrations Business process flow funnel diagram icons. A set of vector icons illustrating business process flow and funnel diagrams. The icons depict various stages of a process, including input, output, increase, decrease, equality, and filtration. These graphics can be used to represent sales funnels, customer journeys, or any other type of process flow in a business or marketing context.
Free with trial Recession concept. Falling market. The trading broker is horrified at the falling market. Financial graph down. Vector illustration isometric design. Decrease diagram vector vectors Recession concept. Falling market. Financial graph down. Vector illustration isometric design. Recession concept. Falling market. The trading broker is horrified at the falling market. Financial graph down. Vector illustration isometric design.