Free with trial Loan Related and Investment Line Vector Icon. Investment, Percentage, Interest Rate. Low total cost icon vector image. Thin Outline Vector illustration isolated on background. Decrease diagram vector vectors Loan Related and Investment Line Vector Icon. Investment, Percentage, Interest Rate. Low total cost icon vector image.
Free with trial Trend and Candlestick Chart vector Crypto Investment concept icon or symbol. Decrease diagram vector vectors Trend and Candlestick Chart vector Crypto Investment icon or symbol
Free with trial Real-Time Market Data Analysis with Candlestick Chart vector concept seamless pattern. Decrease diagram vector vectors Real-Time Market Data Analysis with Candlestick Chart vector seamless pattern
Free with trial Loan Related and Investment Line Vector Icon. Investment, Percentage, Interest Rate. Low total cost icon vector image. Thin Outline Vector illustration isolated on background. Decrease diagram vector vectors Loan Related and Investment Line Vector Icon. Investment, Percentage, Interest Rate. Low total cost icon vector image.
Free with trial Loan Related and Investment Line Vector Icon. Investment, Percentage, Interest Rate. Low total cost icon vector image. Thin Outline Vector illustration isolated on background. Decrease diagram vector illustrations Loan Related and Investment Line Vector Icon. Investment, Percentage, Interest Rate. Low total cost icon vector image.
Free with trial Loan Related and Investment Line Vector Icon. Investment, Percentage, Interest Rate. Low total cost icon vector image. Thin Outline Vector illustration isolated on background. Decrease diagram vector vectors Loan Related and Investment Line Vector Icon. Investment, Percentage, Interest Rate. Low total cost icon vector image.
Free with trial Loan Related and Investment Line Vector Icon. Investment, Percentage, Interest Rate. Low total cost icon vector image. Thin Outline Vector illustration isolated on background. Decrease diagram vector vectors Loan Related and Investment Line Vector Icon. Investment, Percentage, Interest Rate. Low total cost icon vector image.
Free with trial Loan Related and Investment Line Vector Icon. Investment, Percentage, Interest Rate. Low total cost icon vector image. Thin Outline Vector illustration isolated on background. Decrease diagram vector vectors Loan Related and Investment Line Vector Icon. Investment, Percentage, Interest Rate. Low total cost icon vector image.
Free with trial Loan Related and Investment Line Vector Icon. Investment, Percentage, Interest Rate. Low total cost icon vector image. Thin Outline Vector illustration isolated on background. Decrease diagram vector vectors Loan Related and Investment Line Vector Icon. Investment, Percentage, Interest Rate. Low total cost icon vector image.
Free with trial Loan Related and Investment Line Vector Icon. Investment, Percentage, Interest Rate. Low total cost icon vector image. Thin Outline Vector illustration isolated on background. Decrease diagram vector vectors Loan Related and Investment Line Vector Icon. Investment, Percentage, Interest Rate. Low total cost icon vector image.
Free with trial Loan Related and Investment Line Vector Icon. Investment, Percentage, Interest Rate. Low total cost icon vector image. Thin Outline Vector illustration isolated on background. Decrease diagram vector vectors Loan Related and Investment Line Vector Icon. Investment, Percentage, Interest Rate. Low total cost icon vector image.
Free with trial Loan Related and Investment Line Vector Icon. Investment, Percentage, Interest Rate. Low total cost icon vector image. Thin Outline Vector illustration isolated on background. Decrease diagram vector vectors Loan Related and Investment Line Vector Icon. Investment, Percentage, Interest Rate. Low total cost icon vector image.
Free with trial Loan Related and Investment Line Vector Icon. Investment, Percentage, Interest Rate. Low total cost icon vector image. Thin Outline Vector illustration isolated on background. Decrease diagram vector vectors Loan Related and Investment Line Vector Icon. Investment, Percentage, Interest Rate. Low total cost icon vector image.
Free with trial Candlestick chart line icon. Neumorphic, Orange gradient, 3d pin buttons. Analytics graph sign. Market analytics symbol. Line icons. Neumorphic buttons with outline signs. Vector. Decrease diagram vector vectors Candlestick chart line icon. Analytics graph sign. Line icons. Vector. Candlestick chart line icon. Neumorphic, Orange gradient, 3d pin buttons. Analytics graph sign. Market analytics symbol. Line icons. Neumorphic buttons with outline signs. Vector
Free with trial Set Global economic crisis Dollar rate decrease Drop in crude oil price Tearing money banknote Employee dismissal Mobile stock trading and Falling property prices icon. Vector. Decrease diagram vector vectors Set Global economic crisis, Dollar rate decrease, Drop in crude oil price, Tearing money banknote, Employee dismissal. Set Global economic crisis Dollar rate decrease Drop in crude oil price Tearing money banknote Employee dismissal Mobile stock trading and Falling property prices icon. Vector.
Free with trial Decrease icon or logo isolated sign symbol vector illustration - Collection of high quality black style vector icons, seles chart icon isolated sign symbol vector illustration - Collection of high quality. Decrease diagram vector vectors Decrease icon or logo isolated sign symbol vector illustration
Free with trial Stairway symbol to reach achievement. Staircase vector icon isolated on white background. The step up to be successful of business. Decrease diagram vector vectors Stairway symbol to reach achievement. Staircase vector icon
Free with trial Stairway symbol to reach achievement. Staircase vector icon isolated on white background. The step up to be successful of business. Decrease diagram vector vectors Stairway symbol to reach achievement. Staircase vector icon
Free with trial Stairway symbol to reach achievement. Staircase vector icon isolated on white background. The step up to be successful of business. Decrease diagram vector vectors Stairway symbol to reach achievement. Staircase vector icon
Free with trial Stairway symbol to reach achievement. Staircase vector icon isolated on white background. The step up to be successful of business. Decrease diagram vector vectors Stairway symbol to reach achievement. Staircase vector icon
Free with trial Stairway symbol to reach achievement. Staircase vector icon isolated on white background. The step up to be successful of business. Decrease diagram vector vectors Stairway symbol to reach achievement. Staircase vector icon
Free with trial Stairway symbol to reach achievement. Staircase vector icon isolated on white background. The step up to be successful of business. Decrease diagram vector vectors Stairway symbol to reach achievement. Staircase vector icon
Free with trial Stairway symbol to reach achievement. Staircase vector icon isolated on white background. The step up to be successful of business. Decrease diagram vector vectors Stairway symbol to reach achievement. Staircase vector icon
Free with trial Stairway symbol to reach achievement. Staircase vector icon isolated on white background. The step up to be successful of business. Decrease diagram vector vectors Stairway symbol to reach achievement. Staircase vector icon
Free with trial Stairway symbol to reach achievement. Staircase vector icon isolated on white background. The step up to be successful of business. Decrease diagram vector vectors Stairway symbol to reach achievement. Staircase vector icon
Free with trial Stairway symbol to reach achievement. Staircase vector icon isolated on white background. The step up to be successful of business. Decrease diagram vector vectors Stairway symbol to reach achievement. Staircase vector icon
Free with trial Stairway symbol to reach achievement. Staircase vector icon isolated on white background. The step up to be successful of business. Decrease diagram vector vectors Stairway symbol to reach achievement. Staircase vector icon
Free with trial Stairway symbol to reach achievement. Staircase vector icon isolated on white background. The step up to be successful of business. Decrease diagram vector vectors Stairway symbol to reach achievement. Staircase vector icon
Free with trial Stairway symbol to reach achievement. Staircase vector icon isolated on white background. The step up to be successful of business. Decrease diagram vector vectors Stairway symbol to reach achievement. Staircase vector icon
Free with trial Stairway symbol to reach achievement. Staircase vector icon isolated on white background. The step up to be successful of business. Decrease diagram vector vectors Stairway symbol to reach achievement. Staircase vector icon
Free with trial Stairway symbol to reach achievement. Staircase vector icon isolated on white background. The step up to be successful of business. Decrease diagram vector vectors Stairway symbol to reach achievement. Staircase vector icon
Free with trial Stairway symbol to reach achievement. Staircase vector icon isolated on white background. The step up to be successful of business. Decrease diagram vector vectors Stairway symbol to reach achievement. Staircase vector icon
Free with trial Stairway symbol to reach achievement. Staircase vector icon isolated on white background. The step up to be successful of business. Decrease diagram vector vectors Stairway symbol to reach achievement. Staircase vector icon
Free with trial Stairway symbol to reach achievement. Staircase vector icon isolated on white background. The step up to be successful of business. Decrease diagram vector vectors Stairway symbol to reach achievement. Staircase vector icon
Free with trial Stairway symbol to reach achievement. Staircase vector icon isolated on white background. The step up to be successful of business. Decrease diagram vector vectors Stairway symbol to reach achievement. Staircase vector icon
Free with trial Stairway symbol to reach achievement. Staircase vector icon isolated on white background. The step up to be successful of business. Decrease diagram vector vectors Stairway symbol to reach achievement. Staircase vector icon
Free with trial Stairway symbol to reach achievement. Staircase vector icon isolated on white background. The step up to be successful of business. Decrease diagram vector vectors Stairway symbol to reach achievement. Staircase vector icon
Free with trial Stairway symbol to reach achievement. Staircase vector icon isolated on white background. The step up to be successful of business. Decrease diagram vector vectors Stairway symbol to reach achievement. Staircase vector icon
Free with trial Stairway symbol to reach achievement. Staircase vector icon isolated on white background. The step up to be successful of business. Decrease diagram vector vectors Stairway symbol to reach achievement. Staircase vector icon
Free with trial Colored outline declining coin bar chart with stack coin icon logo vector illustration design. Decrease diagram vector vectors Colored outline declining coin bar chart with stack coin icon logo vector illustration design
Free with trial Glowing neon line Global economic crisis icon isolated on blue background. World finance crisis. Vector. Decrease diagram vector illustrations Glowing neon line Global economic crisis icon isolated on blue background. World finance crisis. Vector
Free with trial Reduction chart icon Vector symbol or sign set collection in black and white outline. Decrease diagram vector vectors Decline Chart Icon Illustrating Decrease in Performance, Economic Downturn, and Analytical Data. Reduction chart icon Vector symbol or sign set collection in black and white outline
Free with trial Financial Risk line icon. linear style sign for mobile concept and web design. Financial risk diagram outline vector icon. Symbol, logo illustration. Vector graphics. Decrease diagram vector vectors Financial Risk line icon
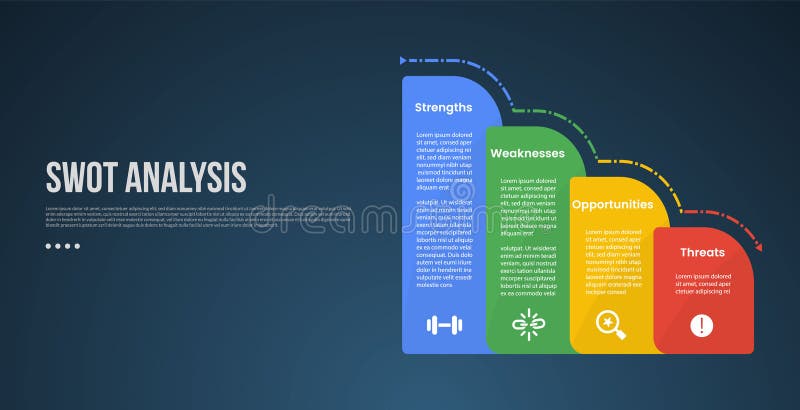
Free with trial SWOT business analysis infographic template with round vertical box container gradually decrease on right column with dark background style. Decrease diagram vector illustrations SWOT business analysis infographic template with round vertical box container gradually decrease on right column with dark
Free with trial Line Global economic crisis icon isolated on white background. World finance crisis. Colorful outline concept. Vector. Decrease diagram vector illustrations Line Global economic crisis icon isolated on white background. World finance crisis. Colorful outline concept. Vector
Free with trial Cash loss graph. Finance inflation schedule, money loss and decrease in income. Trader loss data, budget losses graph or investment bankruptcies isolated vector illustration. Decrease diagram vector vectors Money loss and decrease in income. Trader loss data, budget losses graph or
Free with trial Recession concept. Falling market. The trading broker is horrified at the falling market. Financial graph down. Vector illustration isometric design. Decrease diagram vector illustrations Recession concept. Falling market. Vector illustration isometric design. Recession concept. Falling market. The trading broker is horrified at the falling market. Financial graph down. Vector illustration isometric design.
Free with trial Recession concept. Falling market. The trading broker is horrified at the falling market. Financial graph down. Vector illustration isometric design. Decrease diagram vector vectors Recession concept. Falling market. Vector illustration isometric design. Recession concept. Falling market. The trading broker is horrified at the falling market. Financial graph down. Vector illustration isometric design.
Free with trial Recession concept. Falling market. The trading broker is horrified at the falling market. Financial graph down. Vector illustration isometric design. Decrease diagram vector vectors Recession concept. Falling market. Vector illustration isometric design. Recession concept. Falling market. The trading broker is horrified at the falling market. Financial graph down. Vector illustration isometric design.
Free with trial Woman with economic slowdown. Young girl with falling graphs and diagrams. Recession and depression, banruptcy and crysis. Landing webpage design. Cartoon flat vector illustration. Decrease diagram vector vectors Woman with economic slowdown vector. Woman with economic slowdown. Young girl with falling graphs and diagrams. Recession and depression, banruptcy and crysis. Landing webpage design. Cartoon flat vector illustration
Free with trial Graph chart going up and down sign arrows flat design vector illustration on white background. Decrease diagram vector vectors Graph chart going up and down sign arrows flat design vector illustration
Free with trial Unemployment Rate Vector Illustration featuring individuals actively searching for Jobs Amid Economic Downturns and Financial Crises in a Background. Decrease diagram vector vectors Unemployment Rate Vector Illustration featuring individuals actively searching for Jobs Amid Economic Downturns and Financial
Free with trial High-Quality Vector Icons. Decrease diagram vector vectors Rise icon vector, filled. High-Quality Vector Icons
Free with trial Range Breakout vector Candlestick Chart concept icon or symbol. Decrease diagram vector vectors Range Breakout vector Candlestick Chart icon or symbol
Free with trial Set line Dollar rate decrease Glass money jar with coin Global economic crisis Broken piggy bank Calculation of expenses Hanging sign Sale and Drop crude oil price icon. Vector. Decrease diagram vector vectors Set line Dollar rate decrease, Glass money jar with coin, Global economic crisis, Broken piggy bank, Calculation of. Set line Dollar rate decrease Glass money jar with coin Global economic crisis Broken piggy bank Calculation of expenses Hanging sign Sale and Drop crude oil price icon. Vector.
Free with trial Trend and Candlestick Chart vector Crypto Investment concept seamless pattern. Decrease diagram vector vectors Trend and Candlestick Chart vector Crypto Investment seamless pattern
Free with trial Candlestick Chart vector Professional Financial Trading concept icon or symbol. Decrease diagram vector vectors Candlestick Chart vector Professional Financial Trading icon or symbol
Free with trial Graph Down glyph vector icon isolated. Graph Down stock vector icon for web, mobile app and ui design. Decrease diagram vector vectors Graph Down glyph vector icon
Free with trial Real-Time Market Data Analysis with Candlestick Chart vector concept icon or symbol. Decrease diagram vector vectors Real-Time Market Data Analysis with Candlestick Chart vector icon or symbol
Free with trial Black vector star centered on a white background, surrounded by multiple dashed rays radiating outward. The star has five points with a solid fill, while the rays are evenly spaced and decrease in size as they extend outward. The design gives a sense of focus or emphasis, typical in graphic symbols and icons. Decrease diagram vector vectors Black Star with Dashed Rays Vector Icon. Black vector star centered on a white background, surrounded by multiple dashed rays radiating outward. The star has five points with a solid fill, while the rays are evenly spaced and decrease in size as they extend outward. The design gives a sense of focus or emphasis, typical in graphic symbols and icons.
Free with trial Range or Levels Breakout vector Candlestick Chart concept colored icon or design element. Decrease diagram vector vectors Range or Levels Breakout vector Candlestick Chart colored icon or design element
Free with trial Computer with Candlestick Chart vector Crypto Investment concept icon or design element. Decrease diagram vector vectors Computer with Candlestick Chart vector Crypto Investment icon or design element
Free with trial Money loss and economic crisis, money market crash and global financial downturn, vector line icons. Economic crisis icons of bankruptcy, price decrease with money inflation and unemployment growth. Decrease diagram vector vectors Money loss and economic crisis, money market crash
Free with trial Candlestick Chart on PC Screen vector Crypto Investment concept colored icon or symbol. Decrease diagram vector vectors Candlestick Chart on PC Screen vector Crypto Investment colored icon or symbol
Free with trial A simple and modern black silhouette icon of a business graph, isolated on a white background. This flat vector illustration combines a bar chart with an overlaid line graph, showing a fluctuating trend with a general decline. The graphic symbolizes concepts such as data analysis, financial reporting, market statistics, economic downturn, and business performance metrics. It's an ideal visual element for presentations, infographics, websites, and applications related to finance, economics, and analytics, representing concepts of decrease, loss, or market volatility. Decrease diagram vector vectors Business Data Analytics Chart Icon. A simple and modern black silhouette icon of a business graph, isolated on a white background. This flat vector illustration. A simple and modern black silhouette icon of a business graph, isolated on a white background. This flat vector illustration combines a bar chart with an overlaid line graph, showing a fluctuating trend with a general decline. The graphic symbolizes concepts such as data analysis, financial reporting, market statistics, economic downturn, and business performance metrics. It's an ideal visual element for presentations, infographics, websites, and applications related to finance, economics, and analytics, representing concepts of decrease, loss, or market volatility.
Free with trial Golden coins stack and up arrow. Flat vector icon isolated on white. Economy, finance, money symbol. Currency pictogram. Vector illustration. Decrease diagram vector vectors Golden coin sign dollar vector growth vector. golden coins stack and up arrow. Flat vector icon isolated on white. Economy, finance, money symbol. Currency pictogram. Vector illustration
Free with trial Market Data Analysis with Candlestick Chart vector concept colored icon or design element. Decrease diagram vector vectors Market Data Analysis with Candlestick Chart vector colored icon or design element
Free with trial Candlestick Chart on PC Screen vector Crypto Investment concept colored seamless pattern. Decrease diagram vector vectors Candlestick Chart on PC Screen vector Crypto Investment colored seamless pattern
Free with trial Economic crisis line icon of investment decline with arrow down, vector outline symbol. Global economy downturn and bankruptcy or world crisis in banking business and stock exchange decrease. Decrease diagram vector vectors Economic crisis line icon of investment decline
Free with trial Growth chart line icon. Neumorphic, Blue gradient, 3d pin buttons. Column graph sign. Market analytics symbol. Line icons. Neumorphic buttons with outline signs. Vector. Decrease diagram vector vectors Growth chart line icon. Column graph sign. Line icons. Vector. Growth chart line icon. Neumorphic, Blue gradient, 3d pin buttons. Column graph sign. Market analytics symbol. Line icons. Neumorphic buttons with outline signs. Vector
Free with trial Trend Line and Candlestick Chart vector Crypto Trading concept colored icon or design element. Decrease diagram vector vectors Trend Line and Candlestick Chart vector Crypto Trading colored icon or design element
Free with trial Economic crisis line icons of global financial downturn and business bankruptcy, vector banner. Money loss and banking crisis icons of depreciation, unemployment and price decrease of pandemic crisis. Decrease diagram vector vectors Economic crisis icons of global financial downturn. Economic crisis line icons of global financial downturn and business bankruptcy, vector banner. Money loss and banking crisis icons of depreciation, unemployment and price decrease of pandemic crisis
Free with trial Candlestick Chart vector Professional Financial Trading concept seamless pattern. Decrease diagram vector vectors Candlestick Chart vector Professional Financial Trading seamless pattern
Free with trial Dark blue briefcase vector icon with a prominent white downward arrow on the front. The briefcase features two gold-colored buckles and a sturdy handle. The design is simple and professional, evoking a business or financial theme. The arrow may symbolize reduction or decline, commonly used in economic contexts to indicate a decrease or downward trend. Decrease diagram vector vectors Briefcase with Downward Arrow Vector Icon. Dark blue briefcase vector icon with a prominent white downward arrow on the front. The briefcase features two gold-colored buckles and a sturdy handle. The design is simple and professional, evoking a business or financial theme. The arrow may symbolize reduction or decline, commonly used in economic contexts to indicate a decrease or downward trend.
Free with trial Financial loss icon design vector illustration. Decrease diagram vector vectors Financial loss icon design vector illustration
Free with trial Pyramid chart line icon. Neumorphic, Orange gradient, 3d pin buttons. Analytics graph sign. Market analytics symbol. Line icons. Neumorphic buttons with outline signs. Vector. Decrease diagram vector vectors Pyramid chart line icon. Analytics graph sign. Line icons. Vector. Pyramid chart line icon. Neumorphic, Orange gradient, 3d pin buttons. Analytics graph sign. Market analytics symbol. Line icons. Neumorphic buttons with outline signs. Vector
Free with trial Decreasing graph line icon. Neumorphic, Purple gradient, 3d pin buttons. Column chart sign. Market analytics symbol. Line icons. Neumorphic buttons with outline signs. Vector. Decrease diagram vector vectors Decreasing graph line icon. Column chart sign. Line icons. Vector. Decreasing graph line icon. Neumorphic, Purple gradient, 3d pin buttons. Column chart sign. Market analytics symbol. Line icons. Neumorphic buttons with outline signs. Vector
Free with trial Decrease graph icon in generic style. Statistic illustration concept. Decrease diagram vector vectors Decrease graph icon in generic style. Statistic concept. Decrease graph icon in generic style. Statistic illustration concept
Free with trial This minimalist vector illustration features two identical line graphs, presented in contrasting black and white themes. The left graph displays a black line on a white background, while the right shows a white line on a black background. Both graphs depict a clear downward trend with jagged fluctuations, symbolizing decline, loss, or negative growth over time. This versatile icon set is ideal for illustrating concepts such as economic downturns, financial losses, market crashes, business failures, or any data showing a significant decrease. Perfect for presentations, reports, infographics, and web design. Decrease diagram vector vectors Declining Line Graph Icon Set - Black and White. This minimalist vector illustration features two identical line graphs, presented in contrasting black and white themes. The left graph displays a black line on a white background, while the right shows a white line on a black background. Both graphs depict a clear downward trend with jagged fluctuations, symbolizing decline, loss, or negative growth over time. This versatile icon set is ideal for illustrating concepts such as economic downturns, financial losses, market crashes, business failures, or any data showing a significant decrease. Perfect for presentations, reports, infographics, and web design.
Free with trial Decrease bar graph icon on black square. Statistic illustration concept. Decrease diagram vector vectors Decrease bar graph icon on black square. Statistic concept. Decrease bar graph icon on black square. Statistic illustration concept