Free with trial A 3D rendering of a simple bar graph featuring two green and one orange cylinder. This image is perfect for illustrating business concepts, data representation, or as an infographic element. The clean design makes it versatile for various applications. This image was generated with the assistance of artificial intelligence. Decrease diagram vector illustrations 3D Bar Graph, Green and Orange Cylinders, Business Chart, Data Visualization, Infographic Element. A 3D rendering of a simple bar graph featuring two green and one orange cylinder. This image is perfect for illustrating business concepts, data representation, or as an infographic element. The clean design makes it versatile for various applications.This image was generated with the assistance of artificial intelligence.
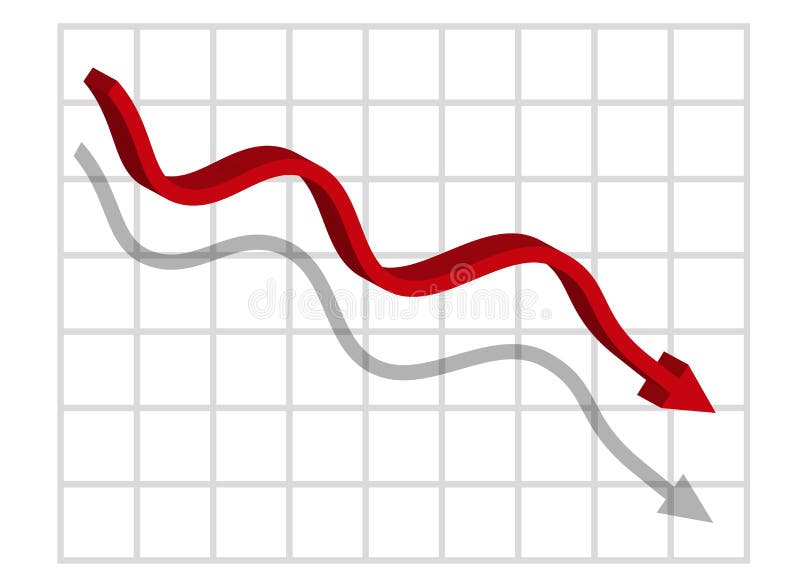
Free with trial Graph with decrease report. Diagram with recession and bankruptcy progress. Business and finance vector illustration. Decrease diagram vector vectors Graph with decrease report. Diagram with recession and bankruptcy progress. Business and finance vector
Free with trial Graph with decrease report. Diagram with recession and bankruptcy progress. Business and finance vector illustration. Decrease diagram vector vectors Graph with decrease report. Diagram with recession and bankruptcy progress. Business and finance vector
Free with trial Financial crisis. Economic collapse. Unfavorable conditions for a startup. The person tries to keep the falling histogram. Decrease diagram vector vectors Financial crisis. Economic collapse. Unfavorable conditions for a startup. The person tries to keep the falling histogram
Free with trial A man standing in front of a chart with an arrow pointing to it, analyzing sales growth data, Worker analyzes sales growth graph, Simple and minimalist flat Vector Illustration. Decrease diagram vector vectors A man standing in front of a chart with an arrow pointing to it, analyzing sales growth data, Worker analyzes sales growth graph
Free with trial Sad businessman with graphs. Young guy evaluates statistics and infographics. Economic depression and recession. Entrepreneur with bankruptcy. Cartoon vector illustration isolated on white background. Decrease diagram vector vectors Sad businessman with graphs. Young guy evaluates statistics and infographics. Economic depression and recession
Free with trial Candlestick chart graph for stock market, financial investment, forex trading and business report concept. Vector illustration. Decrease diagram vector vectors Candlestick chart graph for stock market, financial investment
Free with trial Stock market trading technical analysis bar chart fall. Business candlestick graph exchange down trend. Crisis economy and investment loss graph. Trader financial index crash concept. Money losing eps. Decrease diagram vector vectors Stock market trading technical analysis bar chart fall. Business candlestick graph exchange down trend. Crisis economy
Free with trial The image is a digital illustration of a stock market chart. The chart is blue in color and has a line graph in the center. The line graph shows a downward trend, indicating a decrease in the stock market. On the top left corner of the chart, there is a white text that reads "10. 03570". The background of the image is made up of small white dots, which are scattered across the chart. Decrease diagram vector illustrations The image is a digital illustration of a stock market chart. The chart is blue in color and has a line graph in the center.
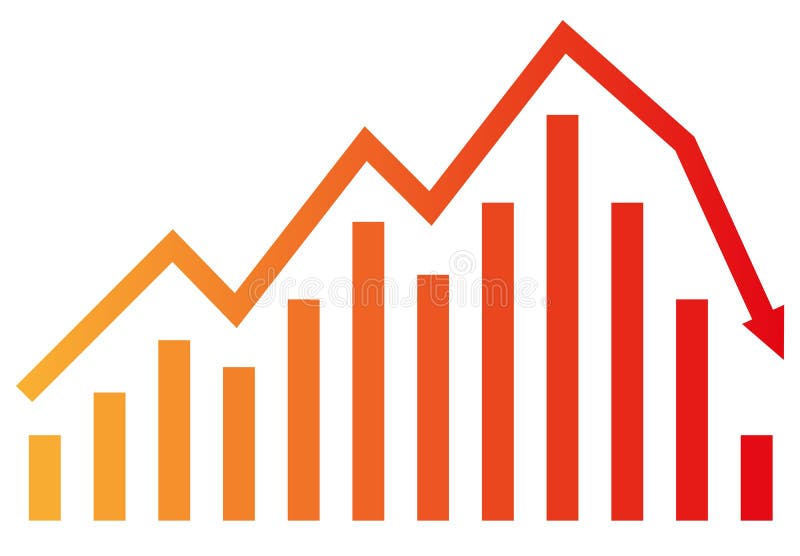
Free with trial Business bar graph with decreasing bars and a downward arrow representing economic loss and market fall. Decrease diagram vector vectors Business bar graph with decreasing bars and a downward arrow representing economic loss and market fall
Free with trial Bar chart with arrow pointing down, illustrating economic decline, business loss, or negative trend data. Decrease diagram vector vectors Bar chart with arrow pointing down, illustrating economic decline, business loss, or negative trend data
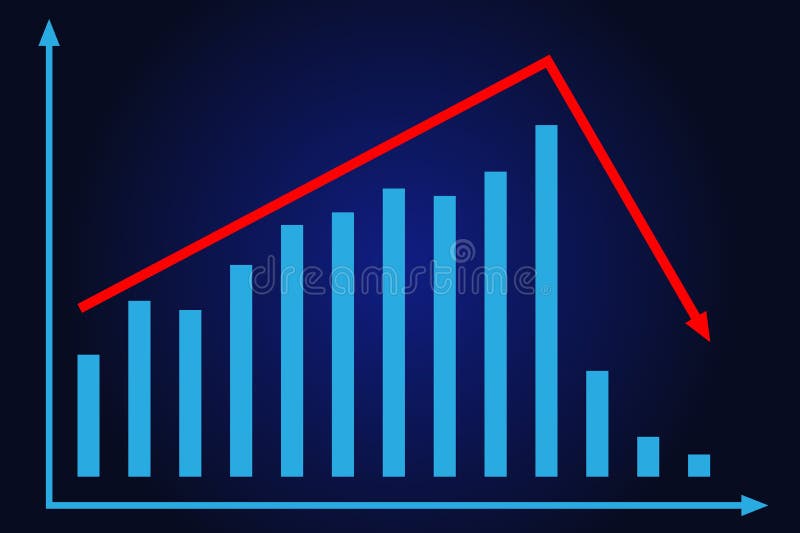
Free with trial Declining bar graph illustrating business recession trend or financial downturn with line chart overlay. Decrease diagram vector vectors Declining bar graph illustrating business recession trend or financial downturn with line chart overlay
Free with trial Illustration of a graph showing the growth of the indian rupee in the stock market. the image represents investment, financial analysis and currency exchange rates in the indian economy. the graph shows an upward trend. Decrease diagram vector illustrations Indian rupee stock market investment graph chart financial growth and currency exchange rate analysis. illustration of a graph showing the growth of the indian rupee in the stock market. the image represents investment, financial analysis and currency exchange rates in the indian economy. the graph shows an upward trend.
Free with trial Sketch of a decreasing bar graph showing negative business trend with a downward arrow, decline illustration. AI generated. Decrease diagram vector vectors Sketch of a decreasing bar graph showing negative business trend with a downward arrow, decline illustration. AI generated
Free with trial Minimalist graph icon showing growth and fluctuation. Perfect for finance, business reports, market analysis, and data presentation projects. Decrease diagram vector vectors Minimalist graph icon showing growth and fluctuation. Perfect for finance, business reports, market analysis, and data
Free with trial Market crash analysis, businessman analyst using magnifying glass to look at red arrow on crash chart. Decrease diagram vector vectors Market crash analysis, businessman analyst using magnifying glass to look at red arrow on crash chart
Free with trial Declining Bar Chart: Representing Loss, Reduction, and Negative Trends with a Downward-Pointing Arrow Graphic. Decrease diagram vector vectors Declining Bar Chart: Representing Loss, Reduction, and Negative Trends with a Downward-Pointing Arrow Graphic
Free with trial Hand drawn declining bar graph with a downward arrow illustrating a financial recession and business failure. Decrease diagram vector vectors Hand drawn declining bar graph with a downward arrow illustrating a financial recession and business failure
Free with trial Light bulb illustration regarding electricity bill increase decreaseImage of electricity bill. Decrease diagram vector vectors Light bulb illustration regarding electricity bill increase decrease
Free with trial Light bulb illustration regarding electricity bill increase decreaseImage of electricity bill. Decrease diagram vector vectors Light bulb illustration regarding electricity bill increase decrease
Free with trial Computer display showing a downward trending graph depicting loss or decline in business or finance hand drawn. Decrease diagram vector vectors Computer display showing a downward trending graph depicting loss or decline in business or finance hand drawn
Free with trial Businessman in a suit and a bar graph. Business and finance concept. Growth and investment idea. Copy space. Decrease diagram vector illustrations Businessman in a suit and a bar graph. Business and finance concept. Growth and investment idea.
Free with trial Businessman in a suit and a bar graph. Business and finance concept. Growth and investment idea. Copy space. Decrease diagram vector illustrations Businessman in a suit and a bar graph. Business and finance concept. Growth and investment idea.
Free with trial Businessman in a suit and a bar graph. Business and finance concept. Growth and investment idea. Copy space. Decrease diagram vector illustrations Businessman in a suit and a bar graph. Business and finance concept. Growth and investment idea.
Free with trial A visual representation of a financial downturn. The red graph and arrows symbolize market decline, economic recession, and potential business failure, highlighting investment risks and negative trends. Decrease diagram vector illustrations Red graph chart falling down financial crisis stock market crash economic recession business failure concept. A visual representation of a financial downturn. The red graph and arrows symbolize market decline, economic recession, and potential business failure, highlighting investment risks and negative trends.
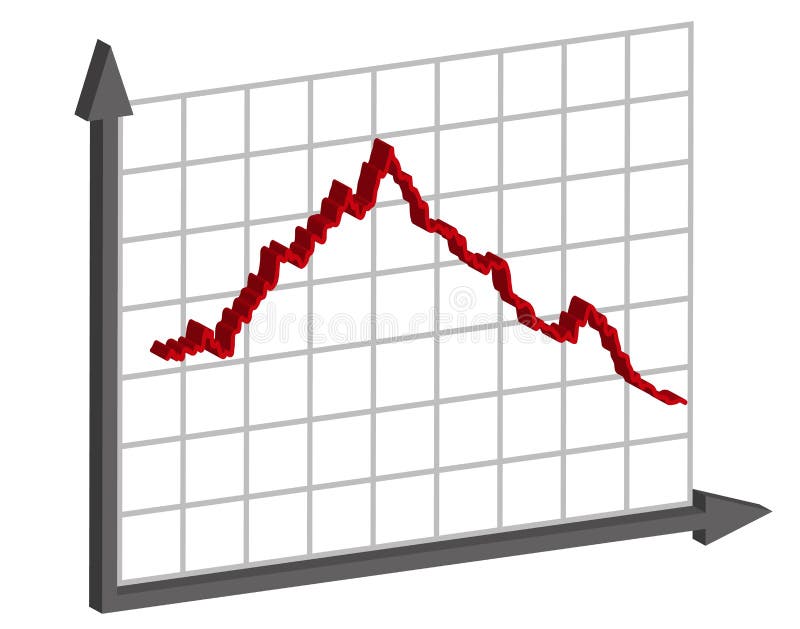
Free with trial Hand Drawn Graphic Chart Showing Initial Growth then Downward Trend to Final State Illustrating Business Cycle. Decrease diagram vector vectors Hand Drawn Graphic Chart Showing Initial Growth then Downward Trend to Final State Illustrating Business Cycle
Free with trial Decreasing bar graph illustration simple hand drawn financial decline, negative trend analysis chart with arrow axes, AI. Decrease diagram vector vectors Decreasing bar graph illustration simple hand drawn financial decline, negative trend analysis chart with arrow axes, AI
Free with trial Symbolic minimalist illustration. Thermometer icon with up and down arrows, suggesting temperature fluctuations. Useful for weather, healthcare, or datadriven design projects. Decrease diagram vector vectors Symbolic minimalist illustration. Thermometer icon with up and down arrows, suggesting temperature fluctuations. Useful for
Free with trial Data funnel filtering process showing percentage drop in prices or conversion rate on isolated black and white design. Decrease diagram vector vectors Data funnel filtering process showing percentage drop in prices or conversion rate on isolated black and white design
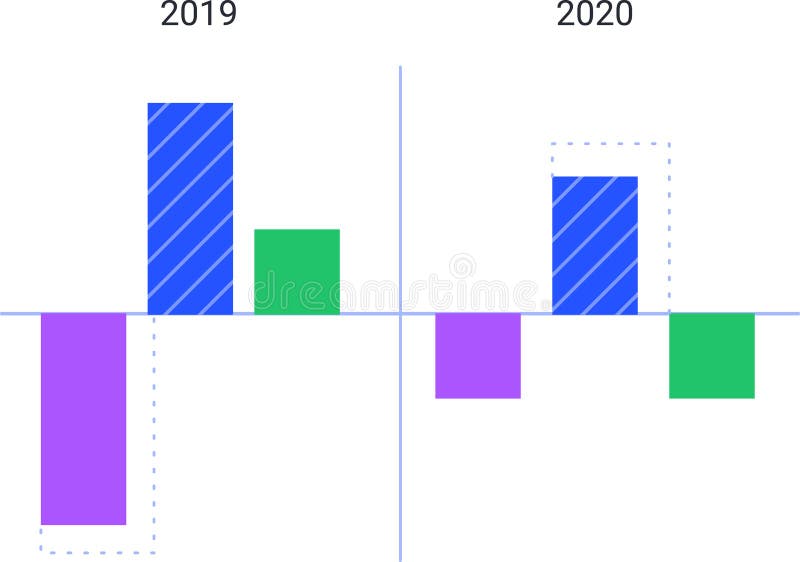
Free with trial Colorful bar charts are comparing data from 2019 and 2020, visualizing trends and statistics with positive and negative values represented by upward and downward bars. Decrease diagram vector vectors Colorful bar charts are comparing data from 2019 and 2020, visualizing trends and statistics with positive and negative
Free with trial Colorful bar charts are comparing data from 2019 and 2020, visualizing trends and statistics with positive and negative values represented by upward and downward bars. Decrease diagram vector illustrations Colorful bar charts are comparing data from 2019 and 2020, visualizing trends and statistics with positive and negative
Free with trial Graph with decrease report. Diagram with recession and bankruptcy progress. Business and finance vector illustration. Decrease diagram vector vectors Graph with decrease report. Diagram with recession and bankruptcy progress. Business and finance vector
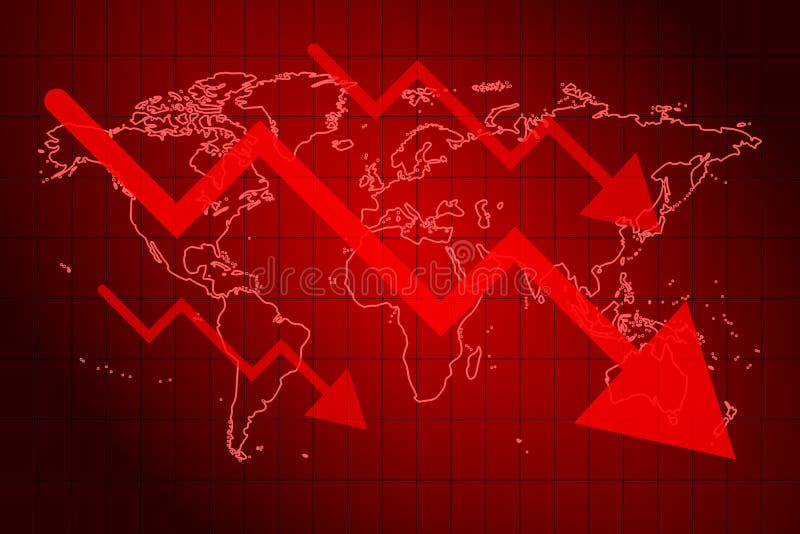
Free with trial Decrease diagram crisis business financial world vector illustration. Decrease diagram vector vectors Decrease diagram crisis business financial world vector illustration
Free with trial Graph and diagram from planes with decrease. Finance and business concept. Vector Illustration. Decrease diagram vector vectors Graph and diagram from planes with decrease. Finance and business concept. Vector
Free with trial Graph with decrease report. Diagram with recession and bankruptcy progress. Business and finance vector illustration. Decrease diagram vector vectors Graph with decrease report. Diagram with recession and bankruptcy progress. Business and finance vector
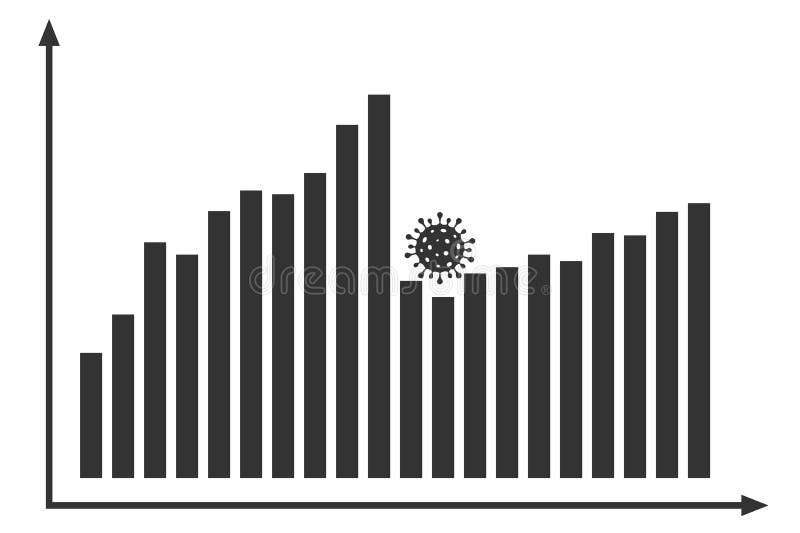
Free with trial Graph with covid decrease report. Diagram with coronavirus recession and bankruptcy progress. Vector illustration. Decrease diagram vector vectors Graph with covid decrease report. Diagram with coronavirus recession and bankruptcy progress. Vector
Free with trial Graph with covid decrease report. Diagram with coronavirus recession and bankruptcy progress. Vector illustration. Decrease diagram vector vectors Graph with covid decrease report. Diagram with coronavirus recession and bankruptcy progress. Vector
Free with trial Diagram with recession and bankruptcy progress. Graph with decrease report. Business and finance vector illustration. Decrease diagram vector vectors Diagram with recession and bankruptcy progress. Graph with decrease report. Business and finance vector
Free with trial Graph with decrease report. Diagram with recession and bankruptcy progress. Business and finance vector illustration. Decrease diagram vector vectors Graph with decrease report. Diagram with recession and bankruptcy progress. Business and finance vector
Free with trial Graph with decrease report. Diagram with recession and bankruptcy progress. Business and finance vector illustration. Decrease diagram vector vectors Graph with decrease report. Diagram with recession and bankruptcy progress. Business and finance vector
Free with trial Graph with decrease report. Diagram with recession and bankruptcy progress. Business and finance vector illustration. Decrease diagram vector vectors Graph with decrease report. Diagram with recession and bankruptcy progress. Business and finance vector
Free with trial Graph with decrease report. Diagram with recession and bankruptcy progress. Business and finance vector illustration. Decrease diagram vector vectors Graph with decrease report. Diagram with recession and bankruptcy progress. Business and finance vector
Free with trial Graph with decrease report. Diagram with recession and bankruptcy progress. Business and finance vector illustration. Decrease diagram vector vectors Graph with decrease report. Diagram with recession and bankruptcy progress. Business and finance vector
Free with trial Graph with decrease report. Diagram with recession and bankruptcy progress. Business and finance vector illustration. Decrease diagram vector vectors Graph with decrease report. Diagram with recession and bankruptcy progress. Business and finance vector
Free with trial Graph with decrease report. Diagram with recession and bankruptcy progress. Business and finance vector illustration. Decrease diagram vector vectors Graph with decrease report. Diagram with recession and bankruptcy progress. Business and finance vector
Free with trial Graph with decrease report. Diagram with recession and bankruptcy progress. Business and finance vector illustration. Decrease diagram vector vectors Graph with decrease report. Diagram with recession and bankruptcy progress. Business and finance vector
Free with trial Graph with decrease report. Diagram with recession and bankruptcy progress. Business and finance vector illustration. Decrease diagram vector vectors Graph with decrease report. Diagram with recession and bankruptcy progress. Business and finance vector
Free with trial Graph with decrease report. Diagram with recession and bankruptcy progress. Business and finance vector illustration. Decrease diagram vector vectors Graph with decrease report. Diagram with recession and bankruptcy progress. Business and finance vector
Free with trial Graph with decrease report. Diagram with recession and bankruptcy progress. Business and finance vector illustration. Decrease diagram vector vectors Graph with decrease report. Diagram with recession and bankruptcy progress. Business and finance vector
Free with trial Graph with decrease report. Diagram with recession and bankruptcy progress. Business and finance vector illustration. Decrease diagram vector vectors Graph with decrease report. Diagram with recession and bankruptcy progress. Business and finance vector
Free with trial Graph with decrease report. Diagram with recession and bankruptcy progress. Business and finance vector illustration. Decrease diagram vector vectors Graph with decrease report. Diagram with recession and bankruptcy progress. Business and finance vector
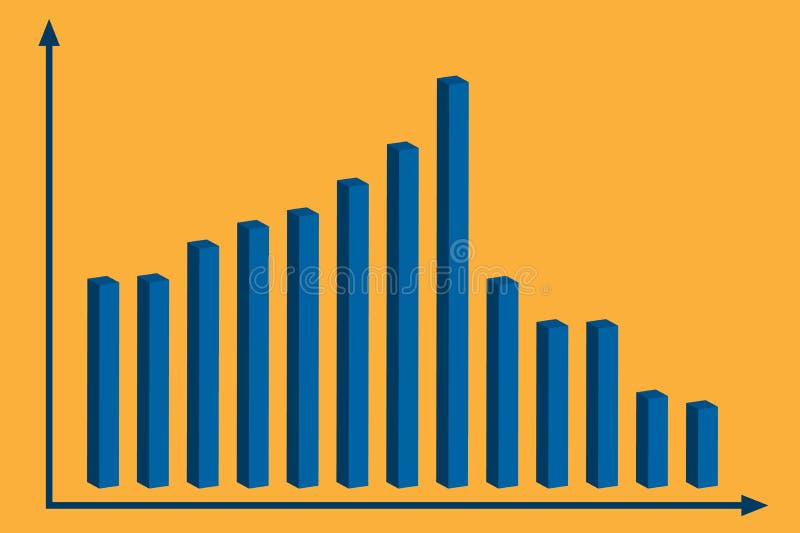
Free with trial 3d graph with decrease report. Diagram with recession and bankruptcy progress. Business and finance vector illustration. Decrease diagram vector vectors 3d graph with decrease report. Diagram with recession and bankruptcy progress. Business and finance vector
Free with trial 3d graph with decrease report. Diagram with recession and bankruptcy progress. Business and finance vector illustration. Decrease diagram vector vectors 3d graph with decrease report. Diagram with recession and bankruptcy progress. Business and finance vector
Free with trial Financial crisis. Dollar decrease. Infographic. Diagram vector icon. Declining chart. Decrease diagram vector vectors Financial crisis. Dollar decrease. Infographic. Diagram vector icon. Declining chart
Free with trial Vector decrease graph icon. Diagram icon. Stock vector illustration on white. Decrease diagram vector illustrations Vector decrease graph icon. Diagram icon. Stock vector illustration isolated on white background. Vector decrease graph icon. Diagram icon. Stock vector illustration on white
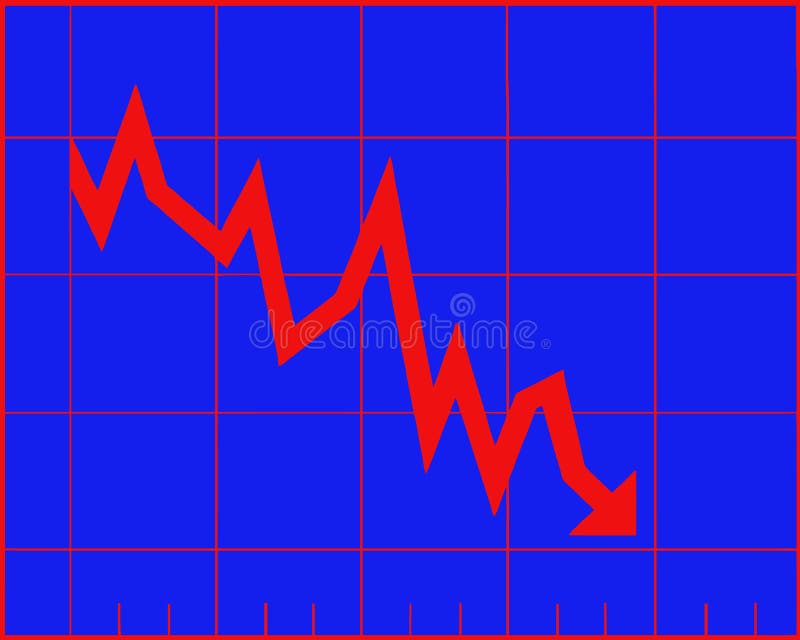
Free with trial Decrease graph. Stock financial trade market diagram. Vector illustration flat design. Isolated on blue background. Declining graph. Downward arrow. Decrease diagram vector vectors Decrease graph. Stock financial trade market diagram. Vector illustration flat design. Isolated on blue background.
Free with trial Vector decrease an growing graph icon. Diagram icon. Stock vector illustration isolated on background. Decrease diagram vector illustrations Vector decrease an growing graph icon. Diagram icon. Stock vector illustration isolated on background
Free with trial Decrease diagram vector icon. Falling graph arrow filled flat sign for mobile concept and web design. Decline graph glyph icon. Crisys symbol, logo illustration. Vector graphics. Decrease diagram vector vectors Decrease diagram vector icon
Free with trial Decrease diagram vector icon. Falling graph arrow filled flat sign for mobile concept and web design. Decline graph glyph icon. Crisys symbol, logo illustration. Vector graphics. Decrease diagram vector vectors Decrease diagram vector icon
Free with trial Decrease diagram vector icon. filled flat sign for mobile concept and web design. Falling graph glyph icon. Symbol, logo illustration. Vector graphics. Decrease diagram vector vectors Decrease diagram vector icon
Free with trial Simple decrease diagram vector design, statistical diagram that serves to provide information about a data or so on. Decrease diagram vector vectors Simple decrease diagram vector design
Free with trial Set line Pie chart infographic, Graph, chart, diagram, Project team base and Financial growth decrease icon. Vector. Decrease diagram vector vectors Set line Pie chart infographic, Graph, chart, diagram, Project team base and Financial growth decrease icon. Vector
Free with trial Set Arrow, Graph, chart, diagram, Percent up arrow, Location, Financial growth decrease, and icon. Vector. Decrease diagram vector illustrations Set Arrow, Graph, chart, diagram, Percent up arrow, Location, Financial growth decrease, and icon. Vector
Free with trial Set line Financial growth decrease, Graph, chart, diagram and Arrow icon. Vector. Decrease diagram vector illustrations Set line Financial growth decrease, Graph, chart, diagram and Arrow icon. Vector
Free with trial Set Isometric Chalkboard with diagram, Financial growth decrease and ATM and money icon. Vector. Decrease diagram vector vectors Set Isometric Chalkboard with diagram, Financial growth decrease and ATM and money icon. Vector
Free with trial Financial crisis. Dollar decrease. Infographic. Diagram vector icon. Declining chart. Decrease diagram vector vectors Financial crisis. Dollar decrease. Infographic. Diagram vector icon. Declining chart