Free with trial Collagen production in women based on age. Medical, healthcare infographics. Important information. Menopause problem. Editable vector illustration isolated on a white background. Horizontal banner. Decrease diagram vector vectors Collagen production in women based on age.
Free with trial Collagen production in women based on age. Medical, healthcare infographics. Important information. Menopause problem. Editable vector illustration isolated on a white background. Horizontal banner. Decrease diagram vector vectors Collagen production in women based on age. Medical, healthcare infographics.
Free with trial Coronavirus impact global economy stock markets financial crisis background. Cost reduction dollar down icon from lines, triangles and particle style design. Decrease diagram vector vectors Coronavirus impact global economy stock markets financial crisis background. Cost reduction dollar down icon from lines, tria... Coronavirus impact global economy stock markets financial crisis background. Cost reduction dollar down icon from lines, triangles and particle style design.
Free with trial Stylized graphics depict market trends with up and down arrows. Flat design with simple shapes for business and financial presentations. Decrease diagram vector vectors Stylized infographics illustrating growth and decline with upward and downward arrows on black background. Stylized graphics depict market trends with up and. Stylized graphics depict market trends with up and down arrows. Flat design with simple shapes for business and financial presentations.
Free with trial Collagen production in women based on age. Medical, healthcare infographics. Important information. Menopause problem. Editable vector illustration isolated on a white background. Horizontal banner. Decrease diagram vector vectors Collagen production in women based on age.
Free with trial Vibrant data visualization featuring bar and line graphs, sun icon, and descending trend lines against a stark black background in a flat style. Decrease diagram vector vectors Colorful data visualization with bar graphs, line graph, sun icon, and descending trends on a black background. Vibrant data visualization featuring bar and line graphs, sun icon, and descending trend lines against a stark black background in a flat style.
Free with trial Line art arrow icon set featuring percentage symbols with upward, downward, and bidirectional movement for financial data. Decrease diagram vector vectors Line art arrow icon set featuring percentage symbols with upward, downward, and bidirectional movement for financial data
Free with trial Decreasing graph icon with shadow. Bankrupt, market crash illustration concept. Decrease diagram vector vectors Decreasing graph icon with shadow. Bankrupt, market crash concept. Decreasing graph icon with shadow. Bankrupt, market crash illustration concept
Free with trial Isometric illustration of a chart board displaying upward and downward trend lines. Decrease diagram vector vectors Isometric graph chart with trends on display. Isometric illustration of a chart board displaying upward and downward trend lines
Free with trial Black percentage symbol enclosed in a speech bubble, surrounded by financial symbols representing interest rates, investments, sales, and discounts. Decrease diagram vector vectors Black percent symbol inside a speech bubble surrounded by financial icons visualizing interest rates, investments, sales, and. Black percentage symbol enclosed in a speech bubble, surrounded by financial symbols representing interest rates, investments, sales, and discounts
Free with trial Illustration of up and down percentage arrow line icon. Percentage arrow with percent sign. Design concept for banking, credit, interest rates, finance and financial fields. isolated white background. Decrease diagram vector illustrations Illustration of up and down percentage arrow line icon.
Free with trial Illustration of up and down percentage arrow line icon. Percentage arrow with percent sign. Design concept for banking, credit, interest rates, finance and financial fields. isolated white background. Decrease diagram vector illustrations Illustration of up and down percentage arrow line icon.
Free with trial Illustration of up and down percentage arrow line icon. Percentage arrow with percent sign. Design concept for banking, credit, interest rates, finance and financial fields. isolated white background. Decrease diagram vector illustrations Illustration of up and down percentage arrow line icon.
Free with trial Illustration of up and down percentage arrow line icon. Percentage arrow with percent sign. Design concept for banking, credit, interest rates, finance and financial fields. isolated white background. Decrease diagram vector illustrations Illustration of up and down percentage arrow line icon.
Free with trial Colorful pie chart is showing positive statistics and business growth, target and financial analysis and marketing report, data with copy space. Decrease diagram vector illustrations Colorful pie chart is showing positive statistics and business growth, target and financial analysis and marketing
Free with trial Decreasing Bar Chart with Arrow: Economic Decline Visualization, Business Graph, Financial Performance Overview, Downward Trend Graphic. Decrease diagram vector vectors Decreasing Bar Chart with Arrow: Economic Decline Visualization, Business Graph, Financial Performance Overview, Downward Trend
Free with trial Business graph icon. Flat design. Vector illustration, EPS 10. Decrease diagram vector vectors Recession statistics financial failure concept. Business graph icon. Flat design. Vector illustration, EPS 10.
Free with trial Two lines are representing data progression over time, one blue and one black, creating a visual representation of trends and a key intersection point is marked with a blue circle. Decrease diagram vector illustrations Two lines are representing data progression over time, one blue and one black, creating a visual representation of
Free with trial Two lines are representing data progression over time, one blue and one black, creating a visual representation of trends and a key intersection point is marked with a blue circle. Decrease diagram vector vectors Two lines are representing data progression over time, one blue and one black, creating a visual representation of
Free with trial Two lines are representing increasing and declining trends over a grid background, symbolizing market analysis, financial performance, or business progress. Decrease diagram vector illustrations Two lines are representing increasing and declining trends over a grid background, symbolizing market analysis
Free with trial Factors of production for labour in economics for demand of land and supply of land graph for wages vector. Decrease diagram vector vectors Factors of production for labour in economics for demand of land and supply of land graph for wages
Free with trial Decreasing bar chart icon in generic style. Market crash sign symbol illustration. Decrease diagram vector vectors Decreasing bar chart icon in generic style. Market crash sign symbol
Free with trial Colorful bar charts illustrating positive and negative business trends from january to may provide a clear visual representation of performance. Decrease diagram vector vectors Colorful bar charts illustrating positive and negative business trends from january to may provide a clear visual
Free with trial Colorful bar charts are presenting statistical trends and business performance data across different time periods. Possibly days of the week. Using a vibrant color scheme of blue. Purple. And orange. Decrease diagram vector illustrations Colorful bar charts are presenting statistical trends and business performance data across different time periods
Free with trial Blue graph chart is visually representing growth, decline, and subsequent recovery, with two key points highlighted by purple circles and a red arrow indicating a temporary dip. Decrease diagram vector vectors Blue graph chart is visually representing growth, decline, and subsequent recovery, with two key points highlighted by
Free with trial Blue graph chart is visually representing growth, decline, and subsequent recovery, with two key points highlighted by purple circles and a red arrow indicating a temporary dip. Decrease diagram vector illustrations Blue graph chart is visually representing growth, decline, and subsequent recovery, with two key points highlighted by
Free with trial This vibrant illustration features colorful bar graphs that visualize business growth and performance metrics, ideal for presentations, reports, and analysis. Decrease diagram vector illustrations Colorful Bar Graphs Representing Business Growth and Performance Metrics in Vibrant Tones of Red, Orange, Yellow, White, and Green. This vibrant illustration features colorful bar graphs that visualize business growth and performance metrics, ideal for presentations, reports, and analysis
Free with trial Colorful bar charts illustrating positive and negative business trends from january to may provide a clear visual representation of performance. Decrease diagram vector illustrations Colorful bar charts illustrating positive and negative business trends from january to may provide a clear visual
Free with trial Reduce energy usage, in line design, green. Reduce, energy, usage, conservation, efficiency, sustainable, power on white background vector. Reduce energy usage editable stroke icon. Decrease diagram vector vectors Reduce energy usage, in line design, green. Reduce, energy, usage, conservation, efficiency, sustainable, power on white
Free with trial Light bulb illustration regarding electricity bill increase decreaseImage of electricity bill. Decrease diagram vector vectors Light bulb illustration regarding electricity bill increase decrease
Free with trial Light bulb illustration regarding electricity bill increase decreaseImage of electricity bill. Decrease diagram vector vectors Light bulb illustration regarding electricity bill increase decrease
Free with trial Light bulb illustration regarding electricity bill increase decreaseImage of electricity bill. Decrease diagram vector vectors Light bulb illustration regarding electricity bill increase decrease
Free with trial Light bulb illustration regarding electricity bill increase decreaseImage of electricity bill. Decrease diagram vector vectors Light bulb illustration regarding electricity bill increase decrease
Free with trial Light bulb illustration regarding electricity bill increase decreaseImage of electricity bill. Decrease diagram vector vectors Light bulb illustration regarding electricity bill increase decrease
Free with trial Light bulb illustration regarding electricity bill increase decreaseImage of electricity bill. Decrease diagram vector vectors Light bulb illustration regarding electricity bill increase decrease
Free with trial Light bulb illustration regarding electricity bill increase decreaseImage of electricity bill. Decrease diagram vector vectors Light bulb illustration regarding electricity bill increase decrease
Free with trial Light bulb illustration regarding electricity bill increase decreaseImage of electricity bill. Decrease diagram vector vectors Light bulb illustration regarding electricity bill increase decrease
Free with trial Light bulb illustration regarding electricity bill increase decreaseImage of electricity bill. Decrease diagram vector vectors Light bulb illustration regarding electricity bill increase decrease
Free with trial Light bulb illustration regarding electricity bill increase decreaseImage of electricity bill. Decrease diagram vector vectors Light bulb illustration regarding electricity bill increase decrease
Free with trial Light bulb illustration regarding electricity bill increase decreaseImage of electricity bill. Decrease diagram vector vectors Light bulb illustration regarding electricity bill increase decrease
Free with trial Light bulb illustration regarding electricity bill increase decreaseImage of electricity bill. Decrease diagram vector vectors Light bulb illustration regarding electricity bill increase decrease
Free with trial Light bulb illustration regarding electricity bill increase decreaseImage of electricity bill. Decrease diagram vector vectors Light bulb illustration regarding electricity bill increase decrease
Free with trial Light bulb illustration regarding electricity bill increase decreaseImage of electricity bill. Decrease diagram vector vectors Light bulb illustration regarding electricity bill increase decrease
Free with trial Light bulb illustration regarding electricity bill increase decreaseImage of electricity bill. Decrease diagram vector vectors Light bulb illustration regarding electricity bill increase decrease
Free with trial Light bulb illustration regarding electricity bill increase decreaseImage of electricity bill. Decrease diagram vector vectors Light bulb illustration regarding electricity bill increase decrease
Free with trial Featuring four vibrant business charts illustrating increasing, decreasing, fluctuating, and peaking trends, perfect for enhancing presentations and reports with clear visual data analysis. Decrease diagram vector vectors Featuring four vibrant business charts illustrating increasing, decreasing, fluctuating, and peaking trends, perfect for
Free with trial Sad businesswoman on stock index chart falling and investor finance loss banner. Stressed business woman on exchange market trading decreasing data fall down graph. Bankruptcy concept. Eps. Decrease diagram vector vectors Sad businesswoman on stock index chart falling and investor finance loss banner. Stressed business woman on exchange
Free with trial Featuring four vibrant business charts illustrating increasing, decreasing, fluctuating, and peaking trends, perfect for enhancing presentations and reports with clear visual data analysis. Decrease diagram vector illustrations Featuring four vibrant business charts illustrating increasing, decreasing, fluctuating, and peaking trends, perfect for
Free with trial Reduce energy usage, in line design. Reduce, energy, usage, conservation, efficiency, sustainable, power on white background vector. Reduce energy usage editable stroke icon. Decrease diagram vector vectors Reduce energy usage, in line design. Reduce, energy, usage, conservation, efficiency, sustainable, power on white
Free with trial Icon of a splash of poured liquid on the surface. Icon of flowing drop, wave, splash, splash of nature isolated on white background. Dripping liquid. Water spill. A drop of rain and a drop of sweat. Decrease diagram vector vectors A large splash of spilled liquid on the surface. Icon of a splash of poured liquid on the surface. Icon of flowing drop, wave, splash, splash of nature isolated on white background. Dripping liquid. Water spill. A drop of rain and a drop of sweat
Free with trial Collagen production in women based on age. Medical, healthcare infographics. Important information. Menopause problem. Editable vector illustration isolated on a white background. Horizontal banner. Decrease diagram vector vectors Collagen production in women based on age. Medical, healthcare infographics.
Free with trial Collagen production in women based on age. Medical, healthcare infographics. Important information. Menopause problem. Editable vector illustration isolated on a white background. Horizontal banner. Decrease diagram vector vectors Collagen production in women based on age. Medical, healthcare infographics.
Free with trial Reduction chart icon. eps. Decrease diagram vector vectors Chart Icon Demonstrating Reduction in Data, Business Decline, and Statistical Analysis. Reduction chart icon.eps
Free with trial Determinants Of Supply in Economics for price, technology, number of sellers, input prices, government, weather vector. Decrease diagram vector vectors Determinants Of Supply in Economics for price, technology, number of sellers, input prices, government, weather
Free with trial The decline in the bar graph is due to the stock market falling, economic crash, investing failure or mistake, price drop, recession, investment risk concept, stock price decline concept flat design. Decrease diagram vector vectors The decline in the bar graph is due to the stock market falling, economic crash, investing failure or mistake, , price drop. The decline in the bar graph is due to the stock market falling, economic crash, investing failure or mistake, price drop, recession, investment risk concept, stock price decline concept flat design
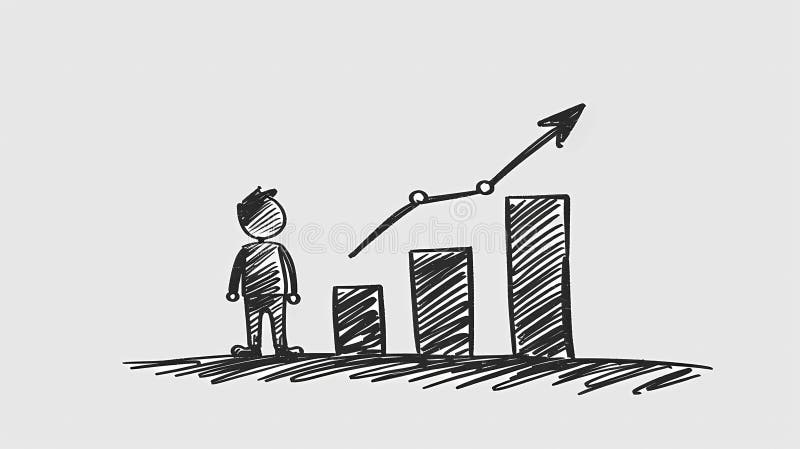
Free with trial Businessman standing on graph, drawing by hand, Generative AI illustrations. Decrease diagram vector illustrations Businessman standing on graph, drawing by hand, Generative AI illustrations
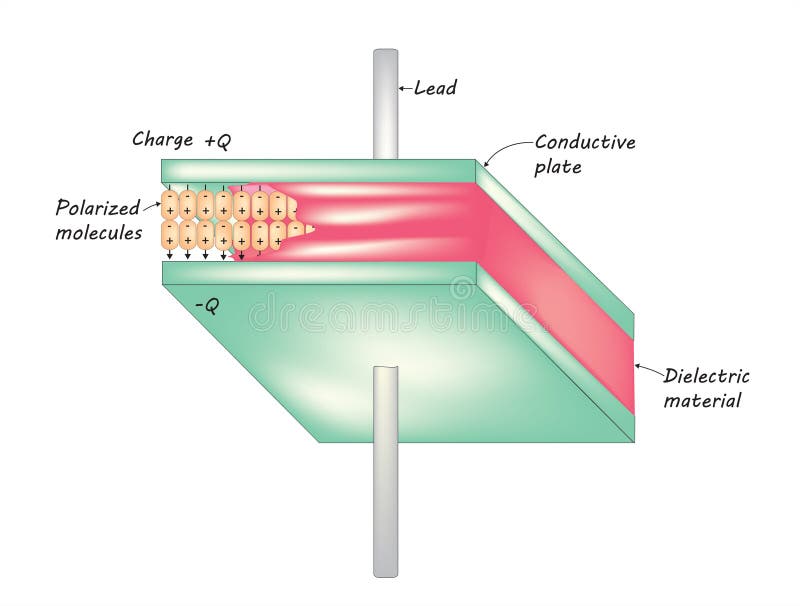
Free with trial A parallel plate capacitor is a simple electronic component used to store electrical energy in a circuit. It consists of two parallel conductive plates separated by a dielectric material. When a voltage is applied across the plates, an electric field is generated between them, causing electric charge to accumulate on the plates. The capacitance of the capacitor, denoted by C, is a measure of its ability to store charge per unit voltage and is determined by factors such as the area of the plates, the distance between them, and the properties of the dielectric material. Decrease diagram vector vectors Parallel plate capacitor
Free with trial A striking and impactful collection of illustrations depicting a stock market crash with dramatic downward trend graphs. Decrease diagram vector vectors Stock market crash down graph illustration. A striking and impactful collection of illustrations depicting a stock market crash with dramatic downward trend graphs
Free with trial Sad businessman trader on stock index chart falling and investor finance loss banner concept. Stressed business man broker on exchange market trading decreasing data fall down graph. Economic crash. Decrease diagram vector vectors Sad businessman trader on stock index chart falling and investor finance loss banner concept. Stressed business man
Free with trial Arrows pointing up and down or to sides, taking on different shapes and statistical charts. Background of straight or wavy arrows for web design, presentations and infographics. Hand drawn doodle. Decrease diagram vector vectors Arrows pointing up and down or to sides, taking on different shapes. Hand drawn doodle. Arrows pointing up and down or to sides, taking on different shapes and statistical charts. Background of straight or wavy arrows for web design, presentations and infographics. Hand drawn doodle
Free with trial Illustration of a businessman running from the rock of problems, investment asset fall down, World economic recession, problem on business, decline concept, Debt problem, finance problem. Decrease diagram vector illustrations Illustration of a businessman running from the rock of problems, investment asset fall down, World economic recession, problem on
Free with trial Unsuccessful investments cause negative emotions in woman standing among declining charts. Girl had bad luck and lost income or investments due to crisis and lack of financial analysis. Decrease diagram vector vectors Unsuccessful investments cause negative emotions in woman standing among declining charts
Free with trial Collapse stock market is seen by man invested money, standing near collapsing financial chart. Crisis in stock market and sharp stop in growth or beginning of decline in prices for stocks and bonds. Decrease diagram vector vectors Collapse of stock market is seen by man invested money, standing near collapsing financial chart. Collapse stock market is seen by man invested money, standing near collapsing financial chart. Crisis in stock market and sharp stop in growth or beginning of decline in prices for stocks and bonds
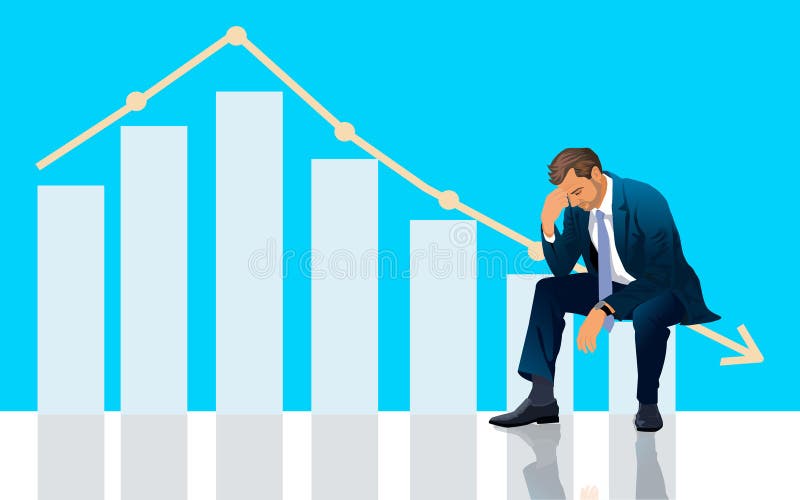
Free with trial Businessman are sit down on a business graph. Chart in the fall. Business falling down. Negative trend. Crisis impact. economy going down. vector, illustration. Decrease diagram vector illustrations Businessman are sit down on a business graph. Chart in the fall. Business falling down. Negative trend. Crisis impact. economy
Free with trial Cartoon stickman drawing conceptual illustration of happy family with growing arrow, Generative AI illustrations. Decrease diagram vector illustrations Cartoon stickman drawing conceptual illustration of happy family with growing arrow, Generative AI illustrations
Free with trial Businessman looking at a declining info graph. vector,illustration. Decrease diagram vector illustrations Businessman looking at a declining info graph
Free with trial Cartoon stickman drawing conceptual illustration of businessman standing on top of a graph, Generative AI illustrations. Decrease diagram vector illustrations Cartoon stickman drawing conceptual illustration of businessman standing on top of a graph, Generative AI illustrations
Free with trial A simple, flat design icon depicting a downward trend. The image features a red graph line descending from the top left to the bottom right, with an arrow indicating the direction. The graph is set against a clean white background, emphasizing the visual impact of the trend. This graphic is suitable for illustrating concepts such as financial decline, decreasing sales, or negative performance in business, economics, or data analysis. Decrease diagram vector vectors Downward Trend Graph Icon. A simple, flat design icon depicting a downward trend. The image features a red graph line descending from the top left to the bottom right, with an arrow indicating the direction. The graph is set against a clean white background, emphasizing the visual impact of the trend. This graphic is suitable for illustrating concepts such as financial decline, decreasing sales, or negative performance in business, economics, or data analysis.
Free with trial A simple, bold red arrow trending downwards against a white background. The arrow zigzags downwards, ending with an arrowhead pointing down, resting on a horizontal red line. This image represents concepts like financial loss, economic downturn, market crash, failure, and negative trends. It's suitable for illustrating articles, presentations, or reports dealing with business, finance, and economics. Decrease diagram vector illustrations Red Downward Trend Arrow. A simple, bold red arrow trending downwards against a white background. The arrow zigzags downwards, ending with an arrowhead pointing down, resting on a horizontal red line. This image represents concepts like financial loss, economic downturn, market crash, failure, and negative trends. It's suitable for illustrating articles, presentations, or reports dealing with business, finance, and economics.
Free with trial A simple graphic illustration of a bar chart. The chart features four bars of varying heights, indicating growth or progress. The design is clean and minimalist, making it suitable for a wide range of applications such as presentations, reports, and infographics. The black bars stand out against the white background, providing a clear visual representation of data. Decrease diagram vector illustrations Bar Chart Icon. A simple graphic illustration of a bar chart. The chart features four bars of varying heights, indicating growth or progress. The design is clean and minimalist, making it suitable for a wide range of applications such as presentations, reports, and infographics. The black bars stand out against the white background, providing a clear visual representation of data.
Free with trial Three orange bar graphs illustrating different data patterns increasing, decreasing, and varied. Ideal for presentations or data visualization. Simple and visually appealing design. Decrease diagram vector illustrations Orange Bar Graph Variations. Three orange bar graphs illustrating different data patterns increasing, decreasing, and varied. Ideal for presentations or data visualization. Simple and visually appealing design.
Free with trial A collection of hand-drawn, black and white icons representing growth, decline, and financial concepts. The set includes upward and downward arrows, percentage symbols, and a bar graph illustrating trends. The simple line art style makes these icons versatile for various applications, including presentations, infographics, and website design. They convey concepts of progress, success, loss, and market fluctuations. Decrease diagram vector illustrations Growth and Decline Icons Set. A collection of hand-drawn, black and white icons representing growth, decline, and financial concepts. The set includes upward and downward arrows, percentage symbols, and a bar graph illustrating trends. The simple line art style makes these icons versatile for various applications, including presentations, infographics, and website design. They convey concepts of progress, success, loss, and market fluctuations.
Free with trial A hand holds a piece of paper with a simple line graph, possibly representing data or a trend, generated by AI. The minimalist design emphasizes the visual simplicity and the concept of data representation. The image could be used to illustrate various concepts related to progress, decline, or chan. Decrease diagram vector illustrations Hand Holding Simple Line Graph. A hand holds a piece of paper with a simple line graph, possibly representing data or a trend, generated by AI. The minimalist design emphasizes the visual simplicity and the concept of data representation. The image could be used to illustrate various concepts related to progress, decline, or chan
Free with trial Cartoon stickman drawing conceptual illustration of two happy businessmen standing on top of a chart, Generative AI illustrations. Decrease diagram vector illustrations Cartoon stickman drawing conceptual illustration of two happy businessmen standing on top of a chart, Generative AI illustrations
Free with trial Business Financial Loss Icon Illustration Logo Vector. Decrease diagram vector vectors Loss
Free with trial Business Financial Loss Icon Illustration Logo Vector. Decrease diagram vector vectors Loss
Free with trial Business Financial Loss Icon Illustration Logo Vector. Decrease diagram vector vectors Loss
Free with trial Business Financial Loss Icon Illustration Logo Vector. Decrease diagram vector vectors Loss
Free with trial This image shows a simple isometric bar graph, generated by AI. It features four black bars of varying heights against a white background, suitable for use as a minimalist graphic or logo. The clean design allows for versatile application in various contexts. Decrease diagram vector illustrations AI-Generated Isometric Bar Graph. This image shows a simple isometric bar graph, generated by AI. It features four black bars of varying heights against a white background, suitable for use as a minimalist graphic or logo. The clean design allows for versatile application in various contexts.
Free with trial View of Graphs showing declining CO₂ emissions. Decrease diagram vector illustrations Graphs showing declining CO₂ emissions