Free with trial Blue curved arrow pointing down and right vector illustration. Business growth, financial decline, process flow, navigation path, strategic movement, data visualization. Wavy directional pointer. Decrease graph icon vectors Blue curved arrow pointing down and right for business growth and process flow vector illustration. Blue curved arrow pointing down and right vector illustration. Blue curved arrow pointing down and right vector illustration. Business growth, financial decline, process flow, navigation path, strategic movement, data visualization. Wavy directional pointer
Free with trial A striking visual of a vibrant green arrow pointing upwards and a bold red arrow pointing downwards, symbolizing progress, finance, and directional changes. Perfect for presentations. Decrease graph icon illustrations Green up arrow and red down arrow icons representing growth and decline white background. A striking visual of a vibrant green arrow pointing upwards and a bold red arrow pointing downwards, symbolizing progress, finance, and directional changes. Perfect for presentations
Free with trial Four colorful 3D arrows in red, orange, cyan, and green are pointing down, representing a decline, loss, or downward trend in a business or financial chart. Decrease graph icon vectors Set of Four Glossy 3D Arrows Showing a Downward Trend. Four colorful 3D arrows in red, orange, cyan, and green are pointing down, representing a decline, loss, or downward trend in a business or financial chart
Free with trial Decline Chart simple icons set designed in filled, outline, line and stroke style. Decrease graph icon vectors Decline Chart simple icons set designed in filled and stroke style. Decline Chart simple icons set designed in filled, outline, line and stroke style
Free with trial Decreasing arrow and golden coins heap. Crisis, money and loss concept. 3d rendering. Decrease graph icon illustrations Decreasing arrow and golden coins heap
Free with trial A glossy, transparent blue arrow curves downwards against a clean white background. The arrow's smooth surface reflects light, creating highlights and a subtle shadow beneath it. This 3D rendered graphic symbolizes direction, decline, or a downward trend. Decrease graph icon illustrations Blue Glass Arrow Pointing Downward on White Background direction. A glossy, transparent blue arrow curves downwards against a clean white background. The arrow's smooth surface reflects light, creating highlights and a subtle shadow beneath it. This 3D rendered graphic symbolizes direction, decline, or a downward trend
Free with trial This image features a variety of icons representing financial growth, percentage increases, and economic trends. The icons include symbols of upward and downward arrows, bar graphs, line graphs, and percentage signs, all in a simple, black-and-white design. These icons are commonly used in financial charts, business presentations, and economic reports to illustrate data trends and financial. Decrease graph icon vectors Collection of financial growth and percentage icons. This image features a variety of icons representing financial growth, percentage increases, and economic trends. The icons include symbols of upward and downward arrows, bar graphs, line graphs, and percentage signs, all in a simple, black-and-white design. These icons are commonly used in financial charts, business presentations, and economic reports to illustrate data trends and financial
Free with trial Simple up and down arrows. Upward, downward arrows in green and red isolated on white background, set of two. Vector illustration. Decrease graph icon vectors Simple up and down arrows
Free with trial Falling bar chart with downward arrow representing business decline and financial problems. Ideal for risk, loss, and economic downturn concepts. Decrease graph icon vectors Business decline chart downward trend problem failure vector silhouette illustration design. Falling bar chart with downward arrow representing business decline and financial problems. Ideal for risk, loss, and economic downturn concepts
Free with trial Vector illustration of a downward arrow symbolizing economic decline, recession, and financial downturn. Decrease graph icon vectors Vector illustration of a downward arrow symbolizing economic decline, recession
Free with trial Colorful vector icons showing graphs charts arrows lightbulb target briefcase for analytics strategy and success. Decrease graph icon illustrations Illustrated Business Data Analysis and Growth Concepts. Colorful vector icons showing graphs charts arrows lightbulb target briefcase for analytics strategy and success
Free with trial Concept of economic crash with connected icons. Decrease graph icon illustrations Concept of economic crash
Free with trial A glowing red 3D coin with a downward arrow symbol, floating against a digital background featuring declining bar charts and bearish market indicators. The neon red lighting emphasizes loss, downturn, risk, volatility, and negative financial trends. Ideal for illustrating stock market crashes, crypto decline, recession concepts, falling prices, and economic downturn visuals. This image is Generated with the help of AI. Decrease graph icon illustrations Bearish red 3D coin with down arrow and falling market chart. A glowing red 3D coin with a downward arrow symbol, floating against a digital background featuring declining bar charts and bearish market indicators. The neon red lighting emphasizes loss, downturn, risk, volatility, and negative financial trends. Ideal for illustrating stock market crashes, crypto decline, recession concepts, falling prices, and economic downturn visuals. This image is Generated with the help of AI.
Free with trial Dollar and bitcoin Coins with Upward Arrows Representing Financial Growth in Minimalist Flat Style. Decrease graph icon vectors Dollar and bitcoin Coins with Upward Arrows Representing Financial Growth in Minimalist Flat Style
Free with trial Golden dollar sign with circular chart showing financial growth and decline on black background. Vector graphic design. Decrease graph icon vectors Golden dollar sign with circular chart showing financial growth and decline on black background
Free with trial Declining bar chart. Wheat spikelets concept. Agricultural crisis symbol. Vector harvest illustration. EPS 10. Decrease graph icon vectors Declining bar chart. Wheat spikelets concept. Agricultural crisis symbol. Vector harvest illustration.
Free with trial E-commerce Sales Decline Visualization , elegant style. Decrease graph icon illustrations E-commerce Sales Decline Visualization
Free with trial A diverse collection of downward-pointing arrows presented against a clean, light grey background. The arrows vary in style, including solid black, outlined, and shaded grey designs. This graphic element is ideal for representing direction, decline, progress, or a list of instructions. Its versatile design makes it suitable for web graphics, presentations, infographics, and print materials. Decrease graph icon vectors Collection of Downward Arrows in Various Styles. A diverse collection of downward-pointing arrows presented against a clean, light grey background. The arrows vary in style, including solid black, outlined, and shaded grey designs. This graphic element is ideal for representing direction, decline, progress, or a list of instructions. Its versatile design makes it suitable for web graphics, presentations, infographics, and print materials.
Free with trial Data analytics dashboard illustrating a mix of line graphs, bar charts, and data summaries, representing business growth, financial trends, and statistical insights for market analysis. Decrease graph icon vectors Data analytics dashboard showing business growth and decline. Data analytics dashboard illustrating a mix of line graphs, bar charts, and data summaries, representing business growth, financial trends, and statistical insights for market analysis
Free with trial A glowing neon red bar chart shows a significant downward trend, symbolizing financial loss or negative growth on a black backdrop. Decrease graph icon illustrations Neon red bar chart illustrating a steep decline in financial performance against a dark background. A glowing neon red bar chart shows a significant downward trend, symbolizing financial loss or negative growth on a black backdrop
Free with trial A bold, red arrow with a zig-zag pattern points downwards, symbolizing a decline or negative trend. The arrow is rendered in a 3D style with subtle shading, giving it depth. It is isolated on a transparent background, making it versatile for various design applications. This graphic is ideal for representing financial losses, market downturns, declining performance, or any concept associated with a downward trajectory. Decrease graph icon illustrations Red Downward Trend Arrow. A bold, red arrow with a zig-zag pattern points downwards, symbolizing a decline or negative trend. The arrow is rendered in a 3D style with subtle shading, giving it depth. It is isolated on a transparent background, making it versatile for various design applications. This graphic is ideal for representing financial losses, market downturns, declining performance, or any concept associated with a downward trajectory.
Free with trial A bold, three-dimensional red arrow forms a jagged downward trend, symbolizing decline, loss, or negative performance. The arrow's sharp angles and bright red color convey urgency and a significant downturn. Isolated on a clean white background, this graphic is versatile for illustrating financial losses, market crashes, declining statistics, or any concept related to a negative trajectory. Its minimalist design makes it suitable for presentations, reports, and digital media. Decrease graph icon illustrations Red Downward Trend Arrow. A bold, three-dimensional red arrow forms a jagged downward trend, symbolizing decline, loss, or negative performance. The arrow's sharp angles and bright red color convey urgency and a significant downturn. Isolated on a clean white background, this graphic is versatile for illustrating financial losses, market crashes, declining statistics, or any concept related to a negative trajectory. Its minimalist design makes it suitable for presentations, reports, and digital media.
Free with trial Golden showing a shiny golden downward pointing arrow on a white background keywords: arrow, gold, golden, down, downward, direction, decline, decrease, falling, negative trend, loss, recession, stock market, finance, business, economy, chart, graph, symbol, icon, 3d, render, isolated, white background, metallic, shiny, polished, pointing, movement, strategy, progress, setback, negative, downturn. Decrease graph icon illustrations A Shiny Golden Downward Pointing Arrow on a White Background Keywords: arrow, gold, golden, down, downward, direction, decline
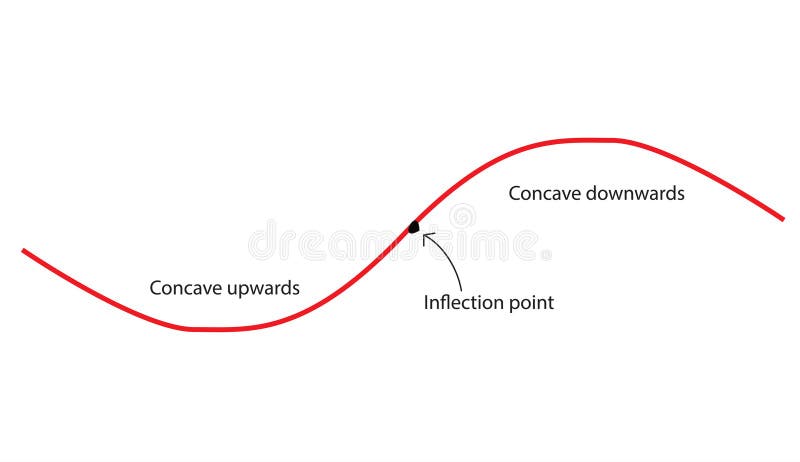
Free with trial Concavity of curve. Inflection point, concave down and concave up. Second derivative tangent lines of function. Decrease graph icon vectors Concavity of curve
Free with trial This comprehensive vector illustration features a set of 18 flat icons depicting various financial trends, market indicators, and warning signals. The collection includes rising and falling line graphs, bar charts, currency symbols (dollar and euro) indicating fluctuations, and alert symbols like sirens and exclamation marks. Ideal for illustrating concepts of economic growth, decline, market volatility, financial crisis, investment risks, and business performance. Perfect for presentations, reports, websites, and applications related to finance, economics, and stock markets. Decrease graph icon vectors Financial Trends, Market Indicators and Crisis Alert Icons Set. This comprehensive vector illustration features a set of 18 flat icons depicting various financial trends, market indicators, and warning signals. The collection includes rising and falling line graphs, bar charts, currency symbols (dollar and euro) indicating fluctuations, and alert symbols like sirens and exclamation marks. Ideal for illustrating concepts of economic growth, decline, market volatility, financial crisis, investment risks, and business performance. Perfect for presentations, reports, websites, and applications related to finance, economics, and stock markets.
Free with trial This set of four flat design icons visually represents key concepts related to climate change and sustainable energy. It includes a thermometer with a rising graph indicating global warming, a stylized Earth with continents and oceans, a young plant sprout symbolizing growth and nature, and a wind turbine representing renewable energy. These icons are ideal for illustrating environmental issues, conservation efforts, and the transition to clean power sources in presentations, articles, and educational materials. Decrease graph icon illustrations Climate Change and Green Energy Icons. This set of four flat design icons visually represents key concepts related to climate change and sustainable energy. It includes a thermometer with a rising graph indicating global warming, a stylized Earth with continents and oceans, a young plant sprout symbolizing growth and nature, and a wind turbine representing renewable energy. These icons are ideal for illustrating environmental issues, conservation efforts, and the transition to clean power sources in presentations, articles, and educational materials.
Free with trial 3D Isometric Flat Vector Illustration of Real Estate Investment Risks, Fluctuations In Housing Prices. Decrease graph icon vectors 3D Isometric Flat Vector Illustration of Real Estate Investment Risks
Free with trial A vibrant, hand-drawn doodle illustration centered around a large percentage sign. This creative sketch features various financial and business icons, including bar graphs, pie charts, stacks of coins, dollar signs, and arrows indicating growth and decline. The colorful, cartoonish style makes it perfect for illustrating concepts like interest rates, economic trends, business analytics, and financial reports. Ideal for use in presentations, infographics, websites, and educational materials, this vector art is isolated on a white background for versatile application. Decrease graph icon illustrations Finance and Economy Doodle Illustration. A vibrant, hand-drawn doodle illustration centered around a large percentage sign. This creative sketch features various financial and business icons, including bar graphs, pie charts, stacks of coins, dollar signs, and arrows indicating growth and decline. The colorful, cartoonish style makes it perfect for illustrating concepts like interest rates, economic trends, business analytics, and financial reports. Ideal for use in presentations, infographics, websites, and educational materials, this vector art is isolated on a white background for versatile application.
Free with trial Set line Mobile stock trading, Contract money and pen and Global economic crisis on seamless pattern. Vector. Decrease graph icon illustrations Set line Mobile stock trading, Contract money and pen and Global economic crisis on seamless pattern. Vector
Free with trial Stickman presenting income growth with upward arrow and expenses decrease illustrated with chart. Perfect for financial themed presentations. Use as simple visual tool to show financial concepts on. Decrease graph icon illustrations Stickman with Financial Graphic Illustration on White Background. Stickman presenting income growth with upward arrow and expenses decrease illustrated with chart. Perfect for financial themed presentations. Use as simple visual tool to show financial concepts on
Free with trial Arrow Direction and Percentage Icons for Business Growth Concept. Decrease graph icon illustrations Arrow Direction and Percentage Icons for Business Growth Concept
Free with trial Dollar Coins with Upward and Downward Arrows Representing Financial Growth and Decline in Minimalist Flat Style. Decrease graph icon vectors Dollar Coins with Upward and Downward Arrows Representing Financial Growth and Decline in Minimalist Flat Style
Free with trial Bar chart representation of data increase growth and finance. Data analysis. Decrease graph icon vectors Bar chart representation of data increase growth and finance. Data analysis
Free with trial 3d blue magnifying glass with downward-trending chart inside Financial analysis, economic decline, risk assessment, market monitoring, investment evaluation concept Low poly digital futuristic Vector. Decrease graph icon vectors 3d blue magnifying glass with downward-trending chart inside Financial analysis, economic decline, risk assessment
Free with trial Businessman presenting falling chart indicating financial decline and loss. Ideal for analytics, reporting, and economic downturn presentations. Decrease graph icon vectors Business decline presentation with downward chart representing financial loss analysis and negative growth. Businessman presenting falling chart indicating financial decline and loss. Ideal for analytics, reporting, and economic downturn presentations
Free with trial Two sets of simple flat design charts showing bar graphs with line graphs and three-segment pie charts in red, green, and blue. Decrease graph icon vectors Two bar charts with line graphs and two pie charts data visualization statistics. Two sets of simple flat design charts showing bar graphs with line graphs and three-segment pie charts in red, green, and blue
Free with trial A striking 3D render illustrating a significant financial or business decline. The image features a minimalist bar chart with three decreasing blue-grey bars, symbolizing a negative trend or falling performance. A prominent, jagged red arrow sharply points downwards across the chart, emphatically conveying concepts of loss, recession, crisis, or market downturn. Set against a vibrant yellow background, this clean and modern graphic is ideal for presentations, reports, articles, or educational materials discussing economic challenges, poor statistics, or business risks. Decrease graph icon illustrations Financial Decline Bar Chart with Red Down Arrow. A striking 3D render illustrating a significant financial or business decline. The image features a minimalist bar chart with three decreasing blue-grey bars, symbolizing a negative trend or falling performance. A prominent, jagged red arrow sharply points downwards across the chart, emphatically conveying concepts of loss, recession, crisis, or market downturn. Set against a vibrant yellow background, this clean and modern graphic is ideal for presentations, reports, articles, or educational materials discussing economic challenges, poor statistics, or business risks.
Free with trial A striking 3D rendered image featuring a bar chart with decreasing red bars and a prominent red downward-pointing arrow, set against a vibrant yellow background. This minimalist visual powerfully symbolizes financial decline, economic recession, business loss, or a negative trend in performance. The clean design effectively conveys concepts of decreasing profits, market downturns, or poor investment outcomes. Ideal for presentations, financial reports, economic analysis, infographics, and articles discussing challenges, risks, or market volatility in business and finance. Decrease graph icon illustrations Economic Downturn Bar Chart with Downward Arrow. A striking 3D rendered image featuring a bar chart with decreasing red bars and a prominent red downward-pointing arrow, set against a vibrant yellow background. This minimalist visual powerfully symbolizes financial decline, economic recession, business loss, or a negative trend in performance. The clean design effectively conveys concepts of decreasing profits, market downturns, or poor investment outcomes. Ideal for presentations, financial reports, economic analysis, infographics, and articles discussing challenges, risks, or market volatility in business and finance.
Free with trial This vector illustration set features six distinct icons representing key financial and economic concepts. It includes bar charts depicting growth with a green arrow and decline with a red arrow, alongside currency exchange rate indicators for USD, INR, and EUR. Two donut charts visualize data distribution, while a world map colored green and red signifies global market trends or segmentation. Ideal for business presentations, financial reports, economic analysis, and investment-related content, these versatile graphics convey complex data clearly and concisely. Decrease graph icon vectors Financial Growth, Decline, and Global Market Data Visualization Icons Set. This vector illustration set features six distinct icons representing key financial and economic concepts. It includes bar charts depicting growth with a green arrow and decline with a red arrow, alongside currency exchange rate indicators for USD, INR, and EUR. Two donut charts visualize data distribution, while a world map colored green and red signifies global market trends or segmentation. Ideal for business presentations, financial reports, economic analysis, and investment-related content, these versatile graphics convey complex data clearly and concisely.
Free with trial A hand interacts with vibrant financial charts, showcasing data trends through modern technology and digital interfaces, ideal for conveying analytics and growth. Scalp. Decrease graph icon illustrations Hand Interacting with Financial Growth Chart Displaying Data Trends and Indicators Through Interactive Technology and. A hand interacts with vibrant financial charts, showcasing data trends through modern technology and digital interfaces, ideal for conveying analytics and growth. Scalp
Free with trial Several dark, pointed arrow shapes are patterned diagonally across a light background. The arrows point downwards, suggesting a trend or direction. Decrease graph icon illustrations Downward Trend Shown With Repeating Arrow Shapes on a Plain Background. Several dark, pointed arrow shapes are patterned diagonally across a light background. The arrows point downwards, suggesting a trend or direction.
Free with trial A comprehensive collection of cartoon-style vector icons illustrating key financial and economic concepts. This set includes symbols for market decline, payment processing, bull and bear market dynamics, investment analysis, global currencies, financial balance, and rising interest rates. Ideal for use in business presentations, financial reports, banking websites, educational materials, or any project related to economics and investment. Decrease graph icon vectors Financial and Economic Icons Set. A comprehensive collection of cartoon-style vector icons illustrating key financial and economic concepts. This set includes symbols for market decline, payment processing, bull and bear market dynamics, investment analysis, global currencies, financial balance, and rising interest rates. Ideal for use in business presentations, financial reports, banking websites, educational materials, or any project related to economics and investment.
Free with trial Up and down directional arrows in vector format for versatile use. Perfect for business infographics and data visualization. EPS 10. Decrease graph icon vectors Up and down directional arrows in vector format for versatile use. Perfect for business infographics and data visualization.
Free with trial Blue bar chart with decreasing values beside a soft cloud shape and horizontal lines. Ideal for data analytics, cloud computing, business growth, technology, forecasts, trends, and innovation. Simple. Decrease graph icon illustrations Minimalist Bar Chart with Cloud Element Representing Data Analysis and Cloud Computing Concepts. Blue bar chart with decreasing values beside a soft cloud shape and horizontal lines. Ideal for data analytics, cloud computing, business growth, technology, forecasts, trends, and innovation. Simple
Free with trial Illustration of a business activities. Decrease graph icon vectors Illustration of a business activities
Free with trial Illustration of a business activities. Decrease graph icon vectors Illustration of a business activities
Free with trial Illustration of a business activities. Decrease graph icon vectors Illustration of a business activities
Free with trial Illustration of a business activities. Decrease graph icon illustrations Illustration of a business activities
Free with trial A stark red jagged arrow points downwards diagonally against a solid black background, symbolizing a significant decline or loss. Decrease graph icon illustrations Red jagged downward trend arrow on black background. A stark red jagged arrow points downwards diagonally against a solid black background, symbolizing a significant decline or loss
Free with trial This illustration shows a downward trend for the US dollar and an upward trend for the Japanese Yen, generated by AI. The graphic uses stylized gold coins with currency symbols and directional arrows to clearly visualize the contrasting market movements. Decrease graph icon illustrations USD vs. Yen: Currency Fluctuation. This illustration shows a downward trend for the US dollar and an upward trend for the Japanese Yen, generated by AI. The graphic uses stylized gold coins with currency symbols and directional arrows to clearly visualize the contrasting market movements.
Free with trial A stark black jagged arrow descends diagonally, indicating a sharp decline or negative trend. Its sharp angles suggest volatility. Decrease graph icon illustrations Black jagged arrow pointing downward and to the right. A stark black jagged arrow descends diagonally, indicating a sharp decline or negative trend. Its sharp angles suggest volatility
Free with trial Hand Drawn Downward Trend Arrow On white Background. Decrease graph icon illustrations Hand-drawn black zigzag line ending with a downward arrow On white Background, symbolizing decline or negative trend. Hand Drawn Downward Trend Arrow On white Background
Free with trial Financial stock market chart with falling red arrow and rising green arrow. Business growth and decline concept for economic analysis success failure and investment. Decrease graph icon vectors Red decreasing and green increasing arrows representing market trend analytics. Financial stock market chart with falling red arrow and rising green arrow. Business growth and decline concept for economic analysis success failure and investment
Free with trial Abstract blue up and down arrow icons illustration set minimalist molecular grid design isolated on white background for technology business growth data analysis and finance ui ux. Decrease graph icon vectors Abstract blue up and down arrow icons illustration set minimalist molecular grid design isolated on white background for
Free with trial Abstract illustration of business growth, featuring bar graphs and line graphs in shades of blue and grey. The image conveys concepts of data analysis, progress, and financial performance. Suitable for presentations, reports, and marketing materials related to business, finance, and technology. Decrease graph icon illustrations Abstract Business Growth Chart. Abstract illustration of business growth, featuring bar graphs and line graphs in shades of blue and grey. The image conveys concepts of data analysis, progress, and financial performance. Suitable for presentations, reports, and marketing materials related to business, finance, and technology.
Free with trial A dynamic red jagged arrow plunges downward, visually representing a sharp decline, economic downturn, or negative trend in business and finance. Ideal for charting losses or market drops. Decrease graph icon illustrations Red jagged arrow pointing down symbolizing financial decline or negative trend. A dynamic red jagged arrow plunges downward, visually representing a sharp decline, economic downturn, or negative trend in business and finance. Ideal for charting losses or market drops
Free with trial A black downward arrow with a percentage symbol and a jagged line inside it on a white background. Decrease graph icon illustrations Black downward arrow with percentage sign and jagged line on white image photo. A black downward arrow with a percentage symbol and a jagged line inside it on a white background
Free with trial A black and white illustration features a thermometer, a warning triangle with an exclamation mark, a percentage symbol, and a downward trending arrow. Decrease graph icon vectors Warning Sign with Thermometer, Percentage Symbol, and Downward Arrow danger alert. A black and white illustration features a thermometer, a warning triangle with an exclamation mark, a percentage symbol, and a downward trending arrow
Free with trial Concept of economic crash with connected icons. Decrease graph icon illustrations Concept of economic crash
Free with trial A set of twelve black icons representing business and data analysis concepts, presented on a white background. The icons include various types of charts and graphs such as bar charts, a pie chart, and line graphs showing trends and fluctuations. There are also icons for data visualization, progress indicators, and reports. The collection is organized in a 3x4 grid. Decrease graph icon vectors Business and data analytics icons bar chart pie chart AI-Generated. A set of twelve black icons representing business and data analysis concepts, presented on a white background. The icons include various types of charts and graphs such as bar charts, a pie chart, and line graphs showing trends and fluctuations. There are also icons for data visualization, progress indicators, and reports. The collection is organized in a 3x4 grid
Free with trial Modern collection of business and finance elements. Contains data, charts,diagrams. Use it for presentation, report and infographic projects. Decrease graph icon vectors Set of Business and Finance Infographic Elements on Transparent Background Vectors. Modern collection of business and finance elements. Contains data, charts,diagrams. Use it for presentation, report and infographic projects
Free with trial Financial analysis scene showing colorful graphs and charts with a wooden block displaying a house icon and the year 2026, conveying real estate market growth and investment trends, ideal for finance and real estate marketing materials. Decrease graph icon illustrations Financial Growth Charts with Wooden House Block and Year 2026. Financial analysis scene showing colorful graphs and charts with a wooden block displaying a house icon and the year 2026, conveying real estate market growth and investment trends, ideal for finance and real estate marketing materials
Free with trial A visual representation of financial risk, showing declining profits, investment concerns, and the need for careful decision-making in business and finance. Decrease graph icon illustrations Financial Risk Alert - Declining Profits and Investment Concerns. A visual representation of financial risk, showing declining profits, investment concerns, and the need for careful decision-making in business and finance