Free with trial A sharply declining red arrow against a grid evokes negative trends and downward movement overall. Decrease graph icon illustrations A sharply declining red arrow against a grid evokes negative trends and downward movement overall
Free with trial 3D Isometric Flat Vector Illustration of Global Crisis, Red Arrow Symbolizing Rapid Economic Decline. Decrease graph icon vectors 3D Isometric Flat Vector Illustration of Global Crisis
Free with trial Illustration of a businessman running from the rock of problems, investment asset fall down, World economic recession, problem on business, decline concept, Debt problem, finance problem. Decrease graph icon illustrations Illustration of a businessman running from the rock of problems, investment asset fall down, World economic recession, problem on
Free with trial 3d man analyzing bar chart, a visual representation of growth, business performance, and investment strategy ,Generative ai. Decrease graph icon illustrations 3d man analyzing bar chart, a visual representation of growth, business performance, and investment strategy
Free with trial A businessman in suit pushing a percent sign for your needs. Concept for online bank or your finance company. Special offer, sale, gift. Vector illustration. Decrease graph icon vectors A businessman in suit pushing a percent sign for your needs. Concept for online bank or your finance company. Special
Free with trial Computer screen displaying a red arrow trending down, representing economic decline. Decrease graph icon illustrations Computer showing red downward trend on blue background. Computer screen displaying a red arrow trending down, representing economic decline
Free with trial Line art business graphs set featuring financial growth and decline with dollar signs for economic performance. Decrease graph icon vectors Line art business graphs set featuring financial growth and decline with dollar signs for economic performance
Free with trial Finance loss chart, financial crises, market fluctuations, and the importance of financial literacy for conveying concepts of bankruptcy, debt management. 3D render illustration. Decrease graph icon illustrations Financial Crises of a Finance Loss Chart. 3D render. Finance loss chart, financial crises, market fluctuations, and the importance of financial literacy for conveying concepts of bankruptcy, debt management. 3D render illustration
Free with trial Candlestick Chart and Speech Bubble vector Cryptocurrency Trading concept colored seamless pattern. Decrease graph icon illustrations Candlestick Chart and Speech Bubble vector Cryptocurrency Trading colored seamless pattern
Free with trial Abstract vector showing price decreasing and investment increasing, using blue lines and pink accents. Simple composition, balanced for illustrative purposes. Decrease graph icon vectors Abstract visual illustrating price reduction, investment, and financial dynamics on a black background. Abstract vector showing price decreasing and investment increasing, using blue lines and pink accents. Simple composition, balanced for illustrative purposes.
Free with trial Hand drawn line art illustration of financial analysis depicting growth and market trends for business strategy. Decrease graph icon vectors Hand drawn line art illustration of financial analysis depicting growth and market trends for business strategy
Free with trial Stylized vector graphic featuring an upward arrow and percentage sign, connected by lines, demonstrating rising performance and decreasing rates against a dark background. Decrease graph icon vectors Rising Performance and Decreasing Costs: Stylized Arrow and Percentage Icons Illustrating Financial Trends. Stylized vector graphic featuring an upward arrow and percentage sign, connected by lines, demonstrating rising performance and decreasing rates against a dark background.
Free with trial Bold illustration of financial market trends depicting monetary growth and decline for business and investment concepts. Decrease graph icon vectors Bold illustration of financial market trends depicting monetary growth and decline for business and investment concepts
Free with trial Collection of black flat design icons illustrating downward trending graphs, magnifying glass analysis, broken server, report documents, and gear with bar chart, used for business and finance visuals. Generative AI. Decrease graph icon vectors Black flat design icons set showing declining business graphs charts magnifying glass office documents computer screen and. Collection of black flat design icons illustrating downward trending graphs, magnifying glass analysis, broken server, report documents, and gear with bar chart, used for business and finance visuals. Generative AI
Free with trial A hand with the index finger extended and a glowing blue light on the fingertip surrounded by various blue percentage symbols and arrows on a white background. Decrease graph icon illustrations A hand with a glowing blue light and percentage symbols floating around isolated on transparent background, isolated on white. a hand with the index finger extended and a glowing blue light on the fingertip surrounded by various blue percentage symbols and arrows on a white background
Free with trial Set Global economic crisis, , Burning dollar bill and Drop crude oil price. Business infographic template. Vector. Decrease graph icon illustrations Set Global economic crisis, , Burning dollar bill and Drop crude oil price. Business infographic template. Vector
Free with trial Concept of currency devaluation, financial crisis and falling exchange rates. Decrease graph icon illustrations Dollar currency value going down with arrow and location pin. Concept of currency devaluation, financial crisis and falling exchange rates
Free with trial Money production system with a gear and dollar sign generating decreasing income streams represented by down arrows. Decrease graph icon vectors Money production system generating decreasing income streams. Money production system with a gear and dollar sign generating decreasing income streams represented by down arrows
Free with trial A 3D rendered yellow Bitcoin coin with the iconic 'B' symbol is centrally placed. To its left, a green circle with an upward arrow signifies growth, while to its right, a red circle with a downward arrow represents decline. These elements are presented on a clean white background, illustrating cryptocurrency market trends. Decrease graph icon illustrations 3D Rendered Bitcoin Symbol with Up and Down Arrows Indicating Cryptocurrency Market Trends on a White Background. A 3D rendered yellow Bitcoin coin with the iconic 'B' symbol is centrally placed. To its left, a green circle with an upward arrow signifies growth, while to its right, a red circle with a downward arrow represents decline. These elements are presented on a clean white background, illustrating cryptocurrency market trends
Free with trial Three pink dollar signs are shown on a pink background. The dollar signs are positioned in a row, with the middle one slightly higher than the other two. Decrease graph icon illustrations Three pink dollar signs are shown on a pink background
Free with trial Black and white line icons depicting currency devaluation, falling stocks, and market data analysis. Decrease graph icon vectors Financial downturn and market analysis icons. Black and white line icons depicting currency devaluation, falling stocks, and market data analysis
Free with trial Concept of economic crash with connected icons. Decrease graph icon illustrations Concept of economic crash
Free with trial Hand Drawn Pink Bar Chart Illustration Showing Rise and Fall of Data Trends with Arrows Symbolizing Up and Down Fluctuations. Decrease graph icon vectors Hand Drawn Pink Bar Chart Illustration Showing Rise and Fall of Data Trends with Arrows Symbolizing Up and Down Fluctuations
Free with trial 3D isometric business chart showing a downward trend with a red arrow and colorful bar graphs on a grid background, isolated on white. Decrease graph icon illustrations 3D isometric business chart showing a downward trend with a red arrow and colorful bar graphs on a grid background, isolated on
Free with trial Simple graphic illustration of a dollar coin and financial arrows depicting market fluctuations for business and finance concepts. Decrease graph icon vectors Simple graphic illustration of a dollar coin and financial arrows depicting market fluctuations for business and finance concepts
Free with trial 100 coin icons set. Color line set of coin vector icons thin line color flat on white. Decrease graph icon illustrations 100 coin icons set, color line style. 100 coin icons set. Color line set of coin vector icons thin line color flat on white
Free with trial Currency exchange rate is fluctuating showing dollar gaining value while euro is decreasing. Decrease graph icon vectors Dollar growing while euro is decreasing showing currency exchange rate. Currency exchange rate is fluctuating showing dollar gaining value while euro is decreasing
Free with trial Green arrows pointing up and down. Illustrative design shows direction choice. Concept for website user interface button, or for business graphic. Decrease graph icon illustrations Green arrows pointing up and down. Illustrative design shows direction choice. Concept for website user interface button or for
Free with trial Colorful pie chart is showing positive statistics and business growth, target and financial analysis and marketing report, data with copy space. Decrease graph icon illustrations Colorful pie chart is showing positive statistics and business growth, target and financial analysis and marketing
Free with trial Laptop displaying a declining chart with an error sign, symbolizing business failure. Decrease graph icon vectors Laptop showing declining chart with error sign, business failure concept. Laptop displaying a declining chart with an error sign, symbolizing business failure
Free with trial A businessman in suit pushing a percent sign for your needs. Concept for online bank or your finance company. Special offer, sale, gift. Vector illustration. Decrease graph icon vectors A businessman in suit pushing a percent sign for your needs. Concept for online bank or your finance company. Special
Free with trial Red arrow pointing down with stacks of gold coins. Represents financial market decline, economic recession, and investment loss. Business downturn and decreasing profits. Decrease graph icon illustrations Red arrow pointing down with stacks of gold coins financial market decline recession. Red arrow pointing down with stacks of gold coins. Represents financial market decline, economic recession, and investment loss. Business downturn and decreasing profits
Free with trial Lower price. Text effect design with modern colors and 3D font look. Decrease graph icon vectors Lower price. Text effect with modern colors and 3D font look
Free with trial Lower price. Text effect design with modern colors and 3D font look. Decrease graph icon vectors Lower price. Text effect with modern colors and 3D font look
Free with trial Lower price. Text effect design with modern colors and 3D font look. Decrease graph icon vectors Lower price. Text effect with modern colors and 3D font look
Free with trial Lower price. Text effect design with modern colors and 3D font look. Decrease graph icon illustrations Lower price. Text effect with modern colors and 3D font look
Free with trial Curved red down arrow and green up arrow icons for visualizing growth, decline, trends, performance metrics, charts, and financial data. Decrease graph icon vectors Curved red down and green up arrows for growth and decline indicators. Curved red down arrow and green up arrow icons for visualizing growth, decline, trends, performance metrics, charts, and financial data
Free with trial Colorful bar charts illustrating positive and negative business trends from january to may provide a clear visual representation of performance. Decrease graph icon vectors Colorful bar charts illustrating positive and negative business trends from january to may provide a clear visual
Free with trial A laconic, simple infographic showing the fall of the Ethereum on the stock exchange. Decrease graph icon illustrations Abstract infographic of falling Ethereum exchange rate. A laconic, simple infographic showing the fall of the Ethereum on the stock exchange.
Free with trial A chart that shows a decline. A falling chart that goes down sharply, a market crash. Vector illustration. Decrease graph icon vectors A chart that shows a decline. A falling chart that goes down sharply, a market crash. Vector
Free with trial Colorful bar charts illustrating positive and negative business trends from january to may provide a clear visual representation of performance. Decrease graph icon illustrations Colorful bar charts illustrating positive and negative business trends from january to may provide a clear visual
Free with trial Vector illustration stacked coins and arrow trending down, decreasing statistical graphic concept. Decrease graph icon vectors Vector illustration stack coin arrow downup trend. vector illustration stacked coins and arrow trending down, decreasing statistical graphic concept
Free with trial Featuring four vibrant business charts illustrating increasing, decreasing, fluctuating, and peaking trends, perfect for enhancing presentations and reports with clear visual data analysis. Decrease graph icon vectors Featuring four vibrant business charts illustrating increasing, decreasing, fluctuating, and peaking trends, perfect for
Free with trial Set line Drop in crude oil price, Tearing money banknote, Global economic crisis and Money bag. Business infographic template. Vector. Decrease graph icon vectors Set line Drop in crude oil price, Tearing money banknote, Global economic crisis and Money bag. Business infographic
Free with trial Featuring four vibrant business charts illustrating increasing, decreasing, fluctuating, and peaking trends, perfect for enhancing presentations and reports with clear visual data analysis. Decrease graph icon illustrations Featuring four vibrant business charts illustrating increasing, decreasing, fluctuating, and peaking trends, perfect for
Free with trial A simple infographic that schematically depicts the dynamics of the decline in offshore oil production. Vector illustration. Decrease graph icon vectors The dynamics of the decline in offshore oil production in laconic infographics. A simple infographic that schematically depicts the dynamics of the decline in offshore oil production. Vector illustration.
Free with trial A simple infographic that schematically depicts the dynamics of the decline in offshore oil production. Vector illustration. Decrease graph icon illustrations The dynamics of the decline in offshore oil production in laconic infographics. A simple infographic that schematically depicts the dynamics of the decline in offshore oil production. Vector illustration.
Free with trial A simple infographic that schematically depicts the dynamics of the decline in oil production in the world. Vector illustration. Decrease graph icon illustrations The dynamics of the decline in oil production in laconic infographics. A simple infographic that schematically depicts the dynamics of the decline in oil production in the world. Vector illustration.
Free with trial Clean and simple abstract infographic about decreasing supply of natural gas. Vector illustration. Decrease graph icon vectors A simple infographic about declining natural gas supply. Clean and simple abstract infographic about decreasing supply of natural gas. Vector illustration.
Free with trial A simple infographic depicting the decline in demand for natural gas. Vector illustration. Decrease graph icon illustrations Abstract infographic of decreasing demand for natural gas. A simple infographic depicting the decline in demand for natural gas. Vector illustration.
Free with trial A simple infographic depicting the decline in demand for natural gas. Vector illustration. Decrease graph icon vectors Abstract infographic of decreasing demand for natural gas. A simple infographic depicting the decline in demand for natural gas. Vector illustration.
Free with trial Stock market chart arrows in red and green are seen as graphic elements and are seen in a 3-d illustration. Arrows indicate the upward and downward gains and losses on the Dow. Decrease graph icon illustrations Stock market chart arrows in red and green are seen as graphic elements and are seen in a 3-d illustration
Free with trial 3D Isometric Flat Vector Illustration of Business Chart, Data and Statistic. Decrease graph icon vectors 3D Isometric Flat Vector Illustration of Business Chart
Free with trial 3D Isometric Flat Vector Illustration of Interest Rate Fall, Economic Downturn, Impact Of Falling Inflation, and Stock Market Value Loss. Decrease graph icon vectors 3D Isometric Flat Vector Illustration of Interest Rate Fall
Free with trial 3D Isometric Flat Vector Illustration of Global Economic Crash, Entrepreneur Declares Bankruptcy And Shuts Down Company. Decrease graph icon vectors 3D Isometric Flat Vector Illustration of Global Economic Crash
Free with trial 3D Isometric Flat Vector Illustration of Challenge Overcoming, Confident Investor Jumps From Red Arrow To Green For Growth Opportunity. Decrease graph icon vectors 3D Isometric Flat Vector Illustration of Challenge Overcoming
Free with trial Simple set of isometric flat icons for finance 3. Contains such symbols as Objective, Decision, Time is Money and Decrease. Decrease graph icon vectors Simple set of isometric flat icons for finance 3
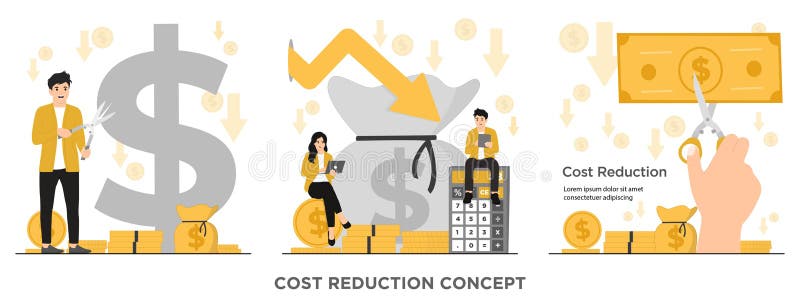
Free with trial 3D Isometric Flat Vector Illustration of Cost Cutting And Efficiency, Price Management. Decrease graph icon vectors 3D Isometric Flat Vector Illustration of Cost Cutting And Efficiency
Free with trial Discover the power of cost reduction and optimization with our flat vector illustration. Cut costs and boost your business's efficiency today!. Decrease graph icon vectors Flat vector costs reduction costs cut costs optimization business concept illustration. Discover the power of cost reduction and optimization with our flat vector illustration. Cut costs and boost your business's efficiency today!
Free with trial 3D Isometric Flat Vector Illustration of Resolving Financial Problems, Navigating Economic Downturns, Opportunities For Investors In A Recovering Stock Market. Decrease graph icon vectors 3D Isometric Flat Vector Illustration of Resolving Financial Problems
Free with trial Cost optimization concept. Cost and income balance. Spending and cost reduction, while maximizing business value. flat vector modern illustration. Decrease graph icon vectors Cost optimization concept. Cost and income balance. Spending and cost reduction, while maximizing business value.
Free with trial A simple line chart illustrates a decreasing trend with distinct dot markers representing data points. The design emphasizes the shift in values over time and aids in visualizing performance. Decrease graph icon vectors Chart Displaying a Downward Trend in Data Analysis. A simple line chart illustrates a decreasing trend with distinct dot markers representing data points. The design emphasizes the shift in values over time and aids in visualizing performance.
Free with trial 3D Isometric Flat Vector Illustration of Economy Recession, Company Bankruptcy. Decrease graph icon vectors 3D Isometric Flat Vector Illustration of Economy Recession
Free with trial 3D Isometric Flat Vector Conceptual Illustration of Menopause and Andropause, Sex Hormone Production in Man and Woman Body. Decrease graph icon vectors 3D Isometric Flat Vector Conceptual Illustration of Menopause and Andropause
Free with trial Discount card line icons set. Marketing and advertising on Internet. Promotions and special offer, loyalty program. Gift and cashback. Cartoon flat vector illustrations isolated on white background. Decrease graph icon vectors Discount card line icons set
Free with trial A graphic representing financial or performance decline featuring an orange arrow pointing downwards over a wavy line, with the word LOSS displayed below. Decrease graph icon illustrations Orange downward trend arrow over wavy line with loss text. A graphic representing financial or performance decline featuring an orange arrow pointing downwards over a wavy line, with the word LOSS displayed below
Free with trial This image shows a downward trend in a stock market chart with people losing money. Vector illustration design using ai tool. Decrease graph icon vectors Recession illustration. This image shows a downward trend in a stock market chart with people losing money. Vector illustration design using ai tool.
Free with trial Three Candles vector Stock Market Trading concept seamless pattern. Decrease graph icon vectors Three Candles vector Stock Market Trading seamless pattern
Free with trial The image shows a steep decline in the economy with factories and currency symbols. Vector illustration design using ai tool. Decrease graph icon vectors Canadian economy collapse. The image shows a steep decline in the economy with factories and currency symbols. Vector illustration design using ai tool.
Free with trial 3D Isometric Flat Vector Illustration of Cost Reduction , Business Finance Crisis. Decrease graph icon vectors 3D Isometric Flat Vector Illustration of Cost Reduction
Free with trial Vector Illustration. Stock Price Fall. Arrow On Chart Pointing Down. Bear Head. Stock Market Concept. Decrease graph icon vectors Bear Market Icon Color. Vector Illustration. Stock Price Fall. Arrow On Chart Pointing Down. Bear Head. Stock Market Concept
Free with trial Investing and Trading vector concept seamless pattern in thin line style. Decrease graph icon vectors Investing and Trading vector seamless pattern in thin line style
Free with trial Co2, carbon emission reduction, woman analyzing data, vector illustration. Decrease graph icon vectors Co2 carbon emission reduction, woman analyzes data. co2, carbon emission reduction, woman analyzing data, vector illustration
Free with trial Vector illustration of a red arrow trending down. Decrease graph icon vectors Red arrow downward trend. vector illustration of a red arrow trending down
Free with trial A boy is holding a handful of shiny coins, his fingers gripping them tightly. The coins glint in the light, showcasing their detailed engravings and reflecting his eager expression. Decrease graph icon illustrations The boy is holding coins. A boy is holding a handful of shiny coins, his fingers gripping them tightly. The coins glint in the light, showcasing their detailed engravings and reflecting his eager expression.
Free with trial A simple, bold red arrow trending downwards against a white background. The arrow zigzags downwards, ending with an arrowhead pointing down, resting on a horizontal red line. This image represents concepts like financial loss, economic downturn, market crash, failure, and negative trends. It's suitable for illustrating articles, presentations, or reports dealing with business, finance, and economics. Decrease graph icon illustrations Red Downward Trend Arrow. A simple, bold red arrow trending downwards against a white background. The arrow zigzags downwards, ending with an arrowhead pointing down, resting on a horizontal red line. This image represents concepts like financial loss, economic downturn, market crash, failure, and negative trends. It's suitable for illustrating articles, presentations, or reports dealing with business, finance, and economics.
Free with trial Trend and Candlestick Chart vector Crypto Investment concept seamless pattern. Decrease graph icon vectors Trend and Candlestick Chart vector Crypto Investment seamless pattern
Free with trial Dollar Vector illustration on a transparent background. Premium quality symmbols. Line Color vector icons for concept and graphic design. Decrease graph icon illustrations Dollar coin money down business. Dollar Vector illustration on a transparent background. Premium quality symmbols. Line Color vector icons for concept and graphic design