Free with trial Graph and diagram from planes with decrease. Finance and business concepts. Vector Illustration isolated. Decrease graph icon vectors Graph and diagram from planes with decrease. Finance and business concepts. Vector Illustration
Free with trial Arrow icon with percent symbol, economic growth, increase, decrease arrow, up and down arrow icon. Decrease graph icon vectors Arrow icon with percent symbol, economic growth, increase, decrease arrow, up and down arrow icon.
Free with trial Set line Pie chart infographic, Financial growth decrease and Data analysis icon. Vector. Decrease graph icon vectors Set line Pie chart infographic, Financial growth decrease and Data analysis icon. Vector
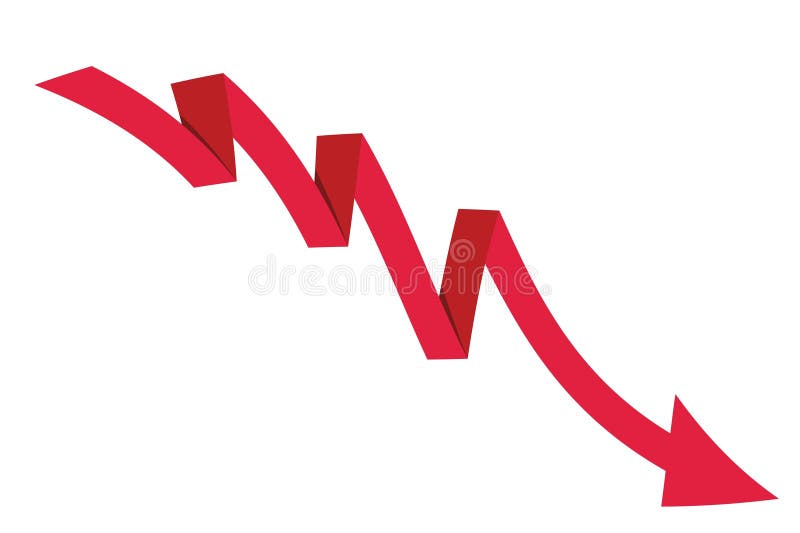
Free with trial Diagram with recession and bankruptcy progress. Business and finance vector illustration. Graph with decrease report. Decrease graph icon vectors Diagram with recession and bankruptcy progress. Business and finance vector illustration. Graph with decrease
Free with trial Downward Bar Graph Line Icon, Decline or Loss Vector. Decrease graph icon vectors Downward Bar Graph Line Icon
Free with trial A clean, minimalist icon representing an analytics graph. It features a series of vertical bars of varying heights, symbolizing data or trends. A line graph with circular data points connects the tops of some of the bars, illustrating growth, progress, or fluctuations over time. This graphic is ideal for representing business intelligence, financial data, research, or any concept related to data analysis and performance. Decrease graph icon vectors Analytics Graph Icon with Data Points. A clean, minimalist icon representing an analytics graph. It features a series of vertical bars of varying heights, symbolizing data or trends. A line graph with circular data points connects the tops of some of the bars, illustrating growth, progress, or fluctuations over time. This graphic is ideal for representing business intelligence, financial data, research, or any concept related to data analysis and performance.
Free with trial Conceptual graph with decrease report. Dark diagram with recession and bankruptcy progress. Business and finance vector illustration. Decrease graph icon vectors Conceptual graph with decrease report. Dark diagram with recession and bankruptcy progress. Business and finance vector
Free with trial Financial Graph Decline icon vector image. Suitable for mobile application web application and print media. Decrease graph icon vectors Financial Graph Decline icon vector image.
Free with trial Down arrow icon set. Decline decrease symbol. Downward trend sign vector. Decrease graph icon vectors Down arrow icon set. Decline decrease symbol. Downward trend sign
Free with trial Downward trending line graph with sad face emotion, classic phone icon, and computer monitor. Ideal for business loss, analytics, communication issues, technology, finance, statistics simple flat. Decrease graph icon vectors Declining Sales Graph with Sad Face, Phone Icon, and Monitor Display. Downward trending line graph with sad face emotion, classic phone icon, and computer monitor. Ideal for business loss, analytics, communication issues, technology, finance, statistics simple flat
Free with trial Abstract Graph Decrease Badge And Label Collection, vector editable design, can be used for business or presentation design. Decrease graph icon vectors Abstract Graph Decrease Badge And Label Collection
Free with trial Abstract Graph Decrease Silhouette Illustration, vector editable design, can be used for business or presentation design. Decrease graph icon vectors Abstract Graph Decrease Silhouette Illustration
Free with trial Graph line icon. Continuous line big heart. Column chart sign. Growth diagram symbol. 3d hearts in heart shaped loop. Graph chart single line ribbon. Loop curve pattern. Vector. Decrease graph icon vectors Graph line icon. Column chart sign. Continuous line big heart. Vector. Graph line icon. Continuous line big heart. Column chart sign. Growth diagram symbol. 3d hearts in heart shaped loop. Graph chart single line ribbon. Loop curve pattern. Vector
Free with trial Graph line icon. Continuous line with share plane. Column chart sign. Growth diagram symbol. 3d heart in speech bubble. Graph chart single line ribbon. Loop curve pattern. Vector. Decrease graph icon vectors Graph line icon. Column chart sign. Continuous line with plane. Vector. Graph line icon. Continuous line with share plane. Column chart sign. Growth diagram symbol. 3d heart in speech bubble. Graph chart single line ribbon. Loop curve pattern. Vector
Free with trial Graph line icon. Continuous line with share plane. Column chart sign. Ab test diagram symbol. 3d star in speech bubble. Graph chart single line ribbon. Loop curve pattern. Vector. Decrease graph icon vectors Graph line icon. Column chart sign. Continuous line with plane. Vector. Graph line icon. Continuous line with share plane. Column chart sign. Ab test diagram symbol. 3d star in speech bubble. Graph chart single line ribbon. Loop curve pattern. Vector
Free with trial Downward arrow icon set. Decrease direction symbol. Reduction indicator sign vector. Decrease graph icon vectors Downward arrow icon set. Decrease direction symbol. Reduction indicator sign
Free with trial Declining Business Line Graph Icon Set vol 32485. Decrease graph icon vectors Declining Business Line Graph Icon Set
Free with trial Graph line icon. Halftone dotted pattern. Gradient icon with grain shadow. Column chart sign. Growth diagram symbol. Line graph chart icon. Various designs. Vector. Decrease graph icon vectors Graph line icon. Column chart sign. Halftone dotted pattern. Vector. Graph line icon. Halftone dotted pattern. Gradient icon with grain shadow. Column chart sign. Growth diagram symbol. Line graph chart icon. Various designs. Vector
Free with trial Graph line icon. Halftone dotted pattern. Gradient icon with grain shadow. Column chart sign. Growth diagram symbol. Line graph chart icon. Various designs. Vector. Decrease graph icon vectors Graph line icon. Column chart sign. Halftone dotted pattern. Vector. Graph line icon. Halftone dotted pattern. Gradient icon with grain shadow. Column chart sign. Growth diagram symbol. Line graph chart icon. Various designs. Vector
Free with trial Web report line icon. Neumorphic, Flat shadow, 3d buttons. Column graph sign. Growth diagram symbol. Line web report icon. Social media icons. Vector. Decrease graph icon illustrations Web report line icon. Column graph sign. Neumorphic buttons. Vector. Web report line icon. Neumorphic, Flat shadow, 3d buttons. Column graph sign. Growth diagram symbol. Line web report icon. Social media icons. Vector
Free with trial Graph laptop line icon. Neumorphic, Flat shadow, 3d buttons. Column chart sign. Growth diagram symbol. Line graph laptop icon. Social media icons. Vector. Decrease graph icon illustrations Graph laptop line icon. Column chart sign. Neumorphic buttons. Vector. Graph laptop line icon. Neumorphic, Flat shadow, 3d buttons. Column chart sign. Growth diagram symbol. Line graph laptop icon. Social media icons. Vector
Free with trial Decrease bar chart icon on circle line. Statistic sign symbol illustration. Decrease graph icon vectors Decrease bar chart icon on circle line. Statistic sign symbol
Free with trial Calendar graph line icon. Neumorphic, Flat shadow, 3d buttons. Column chart sign. Growth diagram symbol. Line calendar graph icon. Social media icons. Vector. Decrease graph icon vectors Calendar graph line icon. Column chart sign. Neumorphic buttons. Vector. Calendar graph line icon. Neumorphic, Flat shadow, 3d buttons. Column chart sign. Growth diagram symbol. Line calendar graph icon. Social media icons. Vector
Free with trial Pie chart line icon. Neumorphic, Flat shadow, 3d buttons. Presentation graph sign. Market analytics symbol. Line pie chart icon. Social media icons. Vector. Decrease graph icon vectors Pie chart line icon. Presentation graph sign. Neumorphic buttons. Vector. Pie chart line icon. Neumorphic, Flat shadow, 3d buttons. Presentation graph sign. Market analytics symbol. Line pie chart icon. Social media icons. Vector
Free with trial Web report line icon. Halftone dotted pattern. Gradient icon with grain shadow. Column graph sign. Growth diagram symbol. Line web report icon. Various designs. Vector. Decrease graph icon illustrations Web report line icon. Column graph sign. Halftone dotted pattern. Vector. Web report line icon. Halftone dotted pattern. Gradient icon with grain shadow. Column graph sign. Growth diagram symbol. Line web report icon. Various designs. Vector
Free with trial Pie chart line icon. Neumorphic, Flat shadow, 3d buttons. Presentation graph sign. Market analytics symbol. Line pie chart icon. Social media icons. Vector. Decrease graph icon vectors Pie chart line icon. Presentation graph sign. Neumorphic buttons. Vector. Pie chart line icon. Neumorphic, Flat shadow, 3d buttons. Presentation graph sign. Market analytics symbol. Line pie chart icon. Social media icons. Vector
Free with trial Report document line icon. Neumorphic, Flat shadow, 3d buttons. Column graph sign. Growth diagram, pie chart symbol. Line report document icon. Social media icons. Vector. Decrease graph icon vectors Report document line icon. Column graph sign. Neumorphic buttons. Vector. Report document line icon. Neumorphic, Flat shadow, 3d buttons. Column graph sign. Growth diagram, pie chart symbol. Line report document icon. Social media icons. Vector
Free with trial Statistics line icon. Neumorphic, Flat shadow, 3d buttons. Column chart sign. Growth graph diagram symbol. Line graph chart icon. Social media icons. Vector. Decrease graph icon vectors Statistics line icon. Column graph chart sign. Neumorphic buttons. Vector. Statistics line icon. Neumorphic, Flat shadow, 3d buttons. Column chart sign. Growth graph diagram symbol. Line graph chart icon. Social media icons. Vector
Free with trial Report line icon. Neumorphic, Flat shadow, 3d buttons. Column graph, pie chart sign. Market analytics symbol. Line report icon. Social media icons. Vector. Decrease graph icon vectors Report line icon. Column graph, pie chart sign. Neumorphic buttons. Vector. Report line icon. Neumorphic, Flat shadow, 3d buttons. Column graph, pie chart sign. Market analytics symbol. Line report icon. Social media icons. Vector
Free with trial 3D graph going up and down with red arrows, blue bar chart icon vector, sales chart with 3D arrow down and arrow up, financial analytics symbol, EPS 10. Decrease graph icon vectors 3D graph going up and down with red arrows, blue bar chart icon vector, sales chart symbol. 3D graph going up and down with red arrows, blue bar chart icon vector, sales chart with 3D arrow down and arrow up, financial analytics symbol, EPS 10
Free with trial Growth chart line icon. Halftone dotted pattern. Gradient icon with grain shadow. Column graph sign. Market analytics symbol. Line growth chart icon. Various designs. Vector. Decrease graph icon vectors Growth chart line icon. Column graph sign. Halftone dotted pattern. Vector. Growth chart line icon. Halftone dotted pattern. Gradient icon with grain shadow. Column graph sign. Market analytics symbol. Line growth chart icon. Various designs. Vector
Free with trial Growth chart line icon. Halftone dotted pattern. Gradient icon with grain shadow. Column graph sign. Market analytics symbol. Line growth chart icon. Various designs. Vector. Decrease graph icon illustrations Growth chart line icon. Column graph sign. Halftone dotted pattern. Vector. Growth chart line icon. Halftone dotted pattern. Gradient icon with grain shadow. Column graph sign. Market analytics symbol. Line growth chart icon. Various designs. Vector
Free with trial Analytics graph line icon. Continuous line big heart. Column chart sign. Growth diagram symbol. 3d hearts in heart shaped loop. Analytics graph single line ribbon. Loop curve pattern. Vector. Decrease graph icon vectors Analytics graph line icon. Column chart sign. Continuous line big heart. Vector. Analytics graph line icon. Continuous line big heart. Column chart sign. Growth diagram symbol. 3d hearts in heart shaped loop. Analytics graph single line ribbon. Loop curve pattern. Vector
Free with trial Graph line icon. Continuous line big heart. Column chart sign. Growth diagram symbol. 3d hearts in heart shaped loop. Graph chart single line ribbon. Loop curve pattern. Vector. Decrease graph icon vectors Graph line icon. Column chart sign. Continuous line big heart. Vector. Graph line icon. Continuous line big heart. Column chart sign. Growth diagram symbol. 3d hearts in heart shaped loop. Graph chart single line ribbon. Loop curve pattern. Vector
Free with trial Euro Currency Decrease Icon Set: Financial Decline Symbol vol 34475. Decrease graph icon vectors Euro Currency Decrease Icon Set: Financial Decline Symbol
Free with trial Diagram graph line icon. Halftone dotted pattern. Gradient icon with grain shadow. Column chart sign. Market analytics symbol. Line diagram graph icon. Various designs. Vector. Decrease graph icon vectors Diagram graph line icon. Column chart sign. Halftone dotted pattern. Vector. Diagram graph line icon. Halftone dotted pattern. Gradient icon with grain shadow. Column chart sign. Market analytics symbol. Line diagram graph icon. Various designs. Vector
Free with trial Pie chart line icon. Continuous line with share plane. Presentation graph sign. Market analytics symbol. 3d heart in speech bubble. Pie chart single line ribbon. Loop curve pattern. Vector. Decrease graph icon vectors Pie chart line icon. Presentation graph sign. Continuous line with plane. Vector. Pie chart line icon. Continuous line with share plane. Presentation graph sign. Market analytics symbol. 3d heart in speech bubble. Pie chart single line ribbon. Loop curve pattern. Vector
Free with trial Analytics graph line icon. Continuous line with share plane. Column chart sign. Growth diagram symbol. Hearts rate review in speech bubble. Analytics graph single line ribbon. Vector. Decrease graph icon illustrations Analytics graph line icon. Column chart sign. Continuous line with plane. Vector. Analytics graph line icon. Continuous line with share plane. Column chart sign. Growth diagram symbol. Hearts rate review in speech bubble. Analytics graph single line ribbon. Vector
Free with trial Presentation board line icon. Neumorphic, Flat shadow, 3d buttons. Column graph sign. Growth diagram symbol. Line presentation board icon. Social media icons. Vector. Decrease graph icon vectors Presentation board line icon. Column graph sign. Neumorphic buttons. Vector. Presentation board line icon. Neumorphic, Flat shadow, 3d buttons. Column graph sign. Growth diagram symbol. Line presentation board icon. Social media icons. Vector
Free with trial Web Browser sale graph down Tool flat icon design isolated on a white background. Decrease graph icon vectors Web Browser sale graph down Tool flat icon design
Free with trial Candlestick chart line icon. Neumorphic, Flat shadow, 3d buttons. Analytics graph sign. Market analytics symbol. Line candlestick chart icon. Social media icons. Vector. Decrease graph icon vectors Candlestick chart line icon. Analytics graph sign. Neumorphic buttons. Vector. Candlestick chart line icon. Neumorphic, Flat shadow, 3d buttons. Analytics graph sign. Market analytics symbol. Line candlestick chart icon. Social media icons. Vector
Free with trial Analytics graph line icon. Halftone dotted pattern. Gradient icon with grain shadow. Column chart sign. Growth diagram symbol. Line analytics graph icon. Various designs. Vector. Decrease graph icon vectors Analytics graph line icon. Column chart sign. Halftone dotted pattern. Vector. Analytics graph line icon. Halftone dotted pattern. Gradient icon with grain shadow. Column chart sign. Growth diagram symbol. Line analytics graph icon. Various designs. Vector
Free with trial Pie chart line icon. Halftone dotted pattern. Gradient icon with grain shadow. Presentation graph sign. Market analytics symbol. Line pie chart icon. Various designs. Vector. Decrease graph icon vectors Pie chart line icon. Presentation graph sign. Halftone dotted pattern. Vector. Pie chart line icon. Halftone dotted pattern. Gradient icon with grain shadow. Presentation graph sign. Market analytics symbol. Line pie chart icon. Various designs. Vector
Free with trial Report statistics line icon. Continuous line with share plane. Column graph sign. Growth diagram symbol. Five star rate review in speech bubble. Report statistics single line ribbon. Vector. Decrease graph icon illustrations Report statistics line icon. Column graph sign. Continuous line with plane. Vector. Report statistics line icon. Continuous line with share plane. Column graph sign. Growth diagram symbol. Five star rate review in speech bubble. Report statistics single line ribbon. Vector
Free with trial Report line icon. Halftone dotted pattern. Gradient icon with grain shadow. Column graph, pie chart sign. Market analytics symbol. Line report icon. Various designs. Vector. Decrease graph icon vectors Report line icon. Column graph, pie chart sign. Halftone dotted pattern. Vector. Report line icon. Halftone dotted pattern. Gradient icon with grain shadow. Column graph, pie chart sign. Market analytics symbol. Line report icon. Various designs. Vector
Free with trial Decreasing graph line icon. Halftone dotted pattern. Gradient icon with grain shadow. Column chart sign. Market analytics symbol. Line decreasing graph icon. Various designs. Vector. Decrease graph icon vectors Decreasing graph line icon. Column chart sign. Halftone dotted pattern. Vector. Decreasing graph line icon. Halftone dotted pattern. Gradient icon with grain shadow. Column chart sign. Market analytics symbol. Line decreasing graph icon. Various designs. Vector
Free with trial Report line icon. Halftone dotted pattern. Gradient icon with grain shadow. Column graph, pie chart sign. Market analytics symbol. Line report icon. Various designs. Vector. Decrease graph icon vectors Report line icon. Column graph, pie chart sign. Halftone dotted pattern. Vector. Report line icon. Halftone dotted pattern. Gradient icon with grain shadow. Column graph, pie chart sign. Market analytics symbol. Line report icon. Various designs. Vector
Free with trial Presentation board line icon. Halftone dotted pattern. Gradient icon with grain shadow. Column graph sign. Growth diagram symbol. Line presentation board icon. Various designs. Vector. Decrease graph icon vectors Presentation board line icon. Column graph sign. Halftone dotted pattern. Vector. Presentation board line icon. Halftone dotted pattern. Gradient icon with grain shadow. Column graph sign. Growth diagram symbol. Line presentation board icon. Various designs. Vector
Free with trial Pie chart line icon. Halftone dotted pattern. Gradient icon with grain shadow. Presentation 3d graph sign. Market analytics symbol. Line pie chart icon. Various designs. Vector. Decrease graph icon vectors Pie chart line icon. Presentation 3d graph sign. Halftone dotted pattern. Vector. Pie chart line icon. Halftone dotted pattern. Gradient icon with grain shadow. Presentation 3d graph sign. Market analytics symbol. Line pie chart icon. Various designs. Vector
Free with trial Decrease and increase chart icon with arrow. Negative and positive trend symbol illustration. Decrease graph icon vectors Decrease and increase chart icon with arrow. Negative and positive trend symbol
Free with trial A simple and clean line art icon of a graph, isolated on a white background. This vector illustration features a line chart with axes, showing a fluctuating trend with distinct data points. The minimalist design makes it perfect for various applications related to business, finance, and data analysis. Ideal for use in presentations, infographics, websites, mobile apps, and user interfaces to represent concepts like statistics, growth, market trends, performance reports, and financial analytics. A versatile symbol for progress and data visualization. Decrease graph icon illustrations Analytics Line Graph Vector Icon. A simple and clean line art icon of a graph, isolated on a white background. This vector illustration features a line chart with axes, showing a fluctuating trend with distinct data points. The minimalist design makes it perfect for various applications related to business, finance, and data analysis. Ideal for use in presentations, infographics, websites, mobile apps, and user interfaces to represent concepts like statistics, growth, market trends, performance reports, and financial analytics. A versatile symbol for progress and data visualization.
Free with trial Set line Mind map infographic, Financial growth decrease and icon. Vector. Decrease graph icon illustrations Set line Mind map infographic, Financial growth decrease and icon. Vector
Free with trial Arrow icon with percent symbol, economic growth, increase, decrease arrow, up and down arrow icon. Decrease graph icon vectors Arrow icon with percent symbol, economic growth, increase, decrease arrow, up and down arrow icon
Free with trial A simple and clean line graph icon illustration, perfect for illustrating financial data, growth charts, and statistical analysis. Ideal for use in presentations, reports, and websites. Decrease graph icon vectors Minimalist Line Graph Icon Design for Financial Data Analysis Presentation. A simple and clean line graph icon illustration, perfect for illustrating financial data, growth charts, and statistical analysis. Ideal for use in presentations, reports, and websites.
Free with trial Economic crisis icon of price decrease for oil barrel in global economy downturn, line vector. Stock exchange trade at world crisis with price index decrease in investments and financial recession. Decrease graph icon vectors Economic crisis icon, price decrease of oil barrel. Economic crisis icon of price decrease for oil barrel in global economy downturn, line vector. Stock exchange trade at world crisis with price index decrease in investments and financial recession
Free with trial Financial problem color line icon with money and recession graph. Vector economic crisis, bankruptcy, money loss and poverty outline symbol with decline chart arrow, dollar currency bill and coins. Decrease graph icon vectors Financial problem color line icon, money and graph. Financial problem color line icon with money and recession graph. Vector economic crisis, bankruptcy, money loss and poverty outline symbol with decline chart arrow, dollar currency bill and coins
Free with trial A black and white icon depicts a laptop with a downward-trending graph on the screen. The graph features a zigzagging line sloping downward, ending with an arrow. The design implies a decrease, decline, or loss in data or performance, commonly used in financial or business contexts. Simple and minimalistic, it effectively communicates the concept of negative change in a digital context. Decrease graph icon vectors Laptop with a downward-trending graph
Free with trial Circular chart icon presenting a bar graph visualizing statistical data, analytics, and business reports, symbolizing financial decline, data analysis, and market trends. Decrease graph icon vectors Circular chart icon showing declining bar graph. Circular chart icon presenting a bar graph visualizing statistical data, analytics, and business reports, symbolizing financial decline, data analysis, and market trends
Free with trial Decline bar chart with downward trend arrow outline icon vector. Decrease, loss, and financial drop symbol in black circle. Decrease graph icon vectors Decline bar chart with downward trend arrow outline icon. Decrease, loss, and financial drop symbol in black circle
Free with trial Set line Data analysis, Financial growth, Calculator, Folder and lock, decrease and icon. Vector. Decrease graph icon illustrations Set line Data analysis, Financial growth, Calculator, Folder and lock, decrease and icon. Vector
Free with trial Set Sales funnel with chart, Financial growth decrease, Server and Calculator icon. Vector. Decrease graph icon illustrations Set Sales funnel with chart, Financial growth decrease, Server and Calculator icon. Vector
Free with trial A black icon depicts a bar graph with four ascending bars. An upward-trending curved arrow originates from the left and sweeps over the bars, indicating growth. A downward-pointing arrow is positioned below the bars on the right. The text "APERTURE F 1. 4 ISO 1600" is visible below the graphic. Decrease graph icon illustrations Black Bar Graph with Upward Trending Arrow and Downward Arrow Icon chart statistics. A black icon depicts a bar graph with four ascending bars. An upward-trending curved arrow originates from the left and sweeps over the bars, indicating growth. A downward-pointing arrow is positioned below the bars on the right. The text "APERTURE F 1.4 ISO 1600" is visible below the graphic
Free with trial Set Isometric Financial growth decrease Data analysis and Pie chart infographic icon. Vector. Decrease graph icon vectors Set Isometric Financial growth decrease, Data analysis and Pie chart infographic icon. Vector
Free with trial Sophisticated finance graph. Detailed chart Vector. Success failure symbol. Sophisticated growth reduction icon. EPS 10. Decrease graph icon vectors Sophisticated finance graph. Detailed chart Vector. Success failure symbol. Sophisticated growth reduction icon.
Free with trial Set line Shopping cart and dollar Piggy bank with coin and Financial growth decrease icon. Vector. Decrease graph icon illustrations Set line Shopping cart and dollar, Piggy bank with coin and Financial growth decrease icon. Vector
Free with trial Set Isometric Global economic crisis, Dollar rate decrease, Contract money and pen and icon. Vector. Decrease graph icon vectors Set Isometric Global economic crisis, Dollar rate decrease, Contract money and pen and icon. Vector
Free with trial Set line Location, Financial growth decrease, Old hourglass with sand and increase icon. Vector. Decrease graph icon illustrations Set line Location, Financial growth decrease, Old hourglass with sand and increase icon. Vector
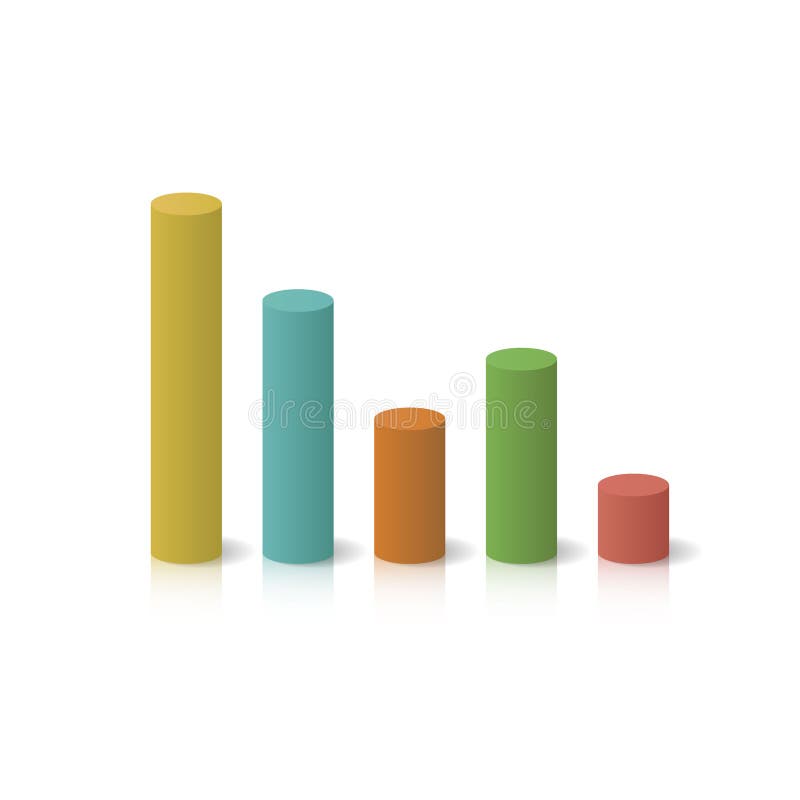
Free with trial Isometric colorful cylinder bar graph showing a financial decline. 3D chart representing loss, decrease, and business drop symbol. Decrease graph icon vectors Isometric colorful cylinder bar graph showing a financial decline. 3D chart representing loss, decrease, and business drop
Free with trial This image features a bar graph with a downward trend, indicated by a red arrow. The bars are colored in various shades of blue and decrease in height from left to right. The image has a transparent background, making it suitable for various design applications. Keywords: bar graph, downward trend, blue bars, red arrow, white background, transparent background. Decrease graph icon illustrations Decreasing bar graph icon isolated on white background. This image features a bar graph with a downward trend, indicated by a red arrow. The bars are colored in various shades of blue and decrease in height from left to right. The image has a transparent background, making it suitable for various design applications. Keywords: bar graph, downward trend, blue bars, red arrow, white background, transparent background
Free with trial Line Graph Chart Line And Solid Icon Set. Data Analysis, Trend Visualization, And Business Growth Symbol Collection. Statistical Representation And Performance Tracking. Isolated Vector Illustration. Decrease graph icon vectors Line Graph Chart Line And Solid Icon Set. Data Analysis, Trend Visualization, And Business Growth Symbol Collection
Free with trial Pop art Financial growth decrease icon isolated on color background. Increasing revenue. Vector. Decrease graph icon vectors Pop art Financial growth decrease icon isolated on color background. Increasing revenue. Vector
Free with trial Set line Search cloud computing, Financial growth decrease and Pie chart infographic icon. Vector. Decrease graph icon vectors Set line Search cloud computing, Financial growth decrease and Pie chart infographic icon. Vector
Free with trial Decreasing graph line icon. Neumorphic, Flat shadow, 3d buttons. Column chart sign. Crisis diagram symbol. Line decreasing graph icon. Social media icons. Vector. Decrease graph icon vectors Decreasing graph line icon. Crisis chart sign. Neumorphic buttons. Vector. Decreasing graph line icon. Neumorphic, Flat shadow, 3d buttons. Column chart sign. Crisis diagram symbol. Line decreasing graph icon. Social media icons. Vector
Free with trial Decreasing graph line icon. Neumorphic, Flat shadow, 3d buttons. Column chart sign. Market analytics symbol. Line decreasing graph icon. Social media icons. Vector. Decrease graph icon vectors Decreasing graph line icon. Column chart sign. Neumorphic buttons. Vector. Decreasing graph line icon. Neumorphic, Flat shadow, 3d buttons. Column chart sign. Market analytics symbol. Line decreasing graph icon. Social media icons. Vector
Free with trial A 3D icon depicts a financial graph. The icon features a rounded purple square with a lighter purple top edge. Inside, a yellow line chart with circular data points shows an upward trend, overlaid on a series of yellow vertical bars representing a bar chart. The overall design is clean and modern, symbolizing data analysis, business growth, and financial performance. Decrease graph icon illustrations 3D icon representing a financial graph with bars and a line chart on a purple background. A 3D icon depicts a financial graph. The icon features a rounded purple square with a lighter purple top edge. Inside, a yellow line chart with circular data points shows an upward trend, overlaid on a series of yellow vertical bars representing a bar chart. The overall design is clean and modern, symbolizing data analysis, business growth, and financial performance
Free with trial A simple and bold icon illustration of a bar graph. This can be used to represent data, statistics, growth, or trends. The icon is designed in a clean and minimalist style, making it versatile for various applications. Decrease graph icon vectors Simple Bold Bar Graph Sign Shape Icon for Data Presentation. A simple and bold icon illustration of a bar graph. This can be used to represent data, statistics, growth, or trends. The icon is designed in a clean and minimalist style, making it versatile for various applications.
Free with trial Doodle Graph icon. Blue pen hand drawn infographic symbol on a notepaper piece. Line art style graphic design element. Web button with shadow. Decline, save on expences concept. Decrease graph icon vectors Doodle Graph icon
Free with trial Dollar price up and down icon in outline style. Dollar coin graph up and down symbol. Money cost arrow growth, decline. Currency investment. Up and down dollar arrow. illustration. Decrease graph icon vectors Dollar price up and down icon in outline style. Dollar coin graph up and down symbol. Money cost arrow growth, decline. Currency
Free with trial A 3D rendered icon depicting a blue document with a raised bar graph. The bar graph features alternating blue, orange, and yellow bars of varying heights. White lines and a circular orange and white element are also present on the blue document surface. The icon is isolated on a white background. Decrease graph icon vectors 3 D blue document icon with orange and blue bar graph and white lines image. A 3D rendered icon depicting a blue document with a raised bar graph. The bar graph features alternating blue, orange, and yellow bars of varying heights. White lines and a circular orange and white element are also present on the blue document surface. The icon is isolated on a white background
Free with trial Set line Financial growth decrease, Data analysis, Pie chart infographic, Server, Binary code, and icon. Vector. Decrease graph icon illustrations Set line Financial growth decrease, Data analysis, Pie chart infographic, Server, Binary code, and icon. Vector