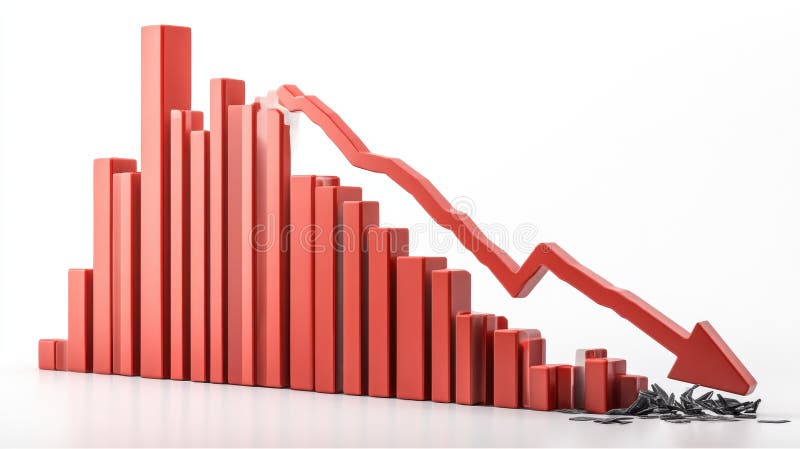
Free with trial A bar chart showing a steady decline with a red downward arrow, symbolizing financial loss, economic downturn, business decline, or negative performance trends. Decrease growth arrow illustrations Economic Downtrend Bar Chart for Business concept 3d Rendering. A bar chart showing a steady decline with a red downward arrow, symbolizing financial loss. A bar chart showing a steady decline with a red downward arrow, symbolizing financial loss, economic downturn, business decline, or negative performance trends
Free with trial A bar chart showing a steady decline with a red downward arrow, symbolizing financial loss, economic downturn, business decline, or negative performance trends. Decrease growth arrow illustrations Economic Downtrend Bar Chart for Business concept 3d Rendering. A bar chart showing a steady decline with a red downward arrow, symbolizing financial loss. A bar chart showing a steady decline with a red downward arrow, symbolizing financial loss, economic downturn, business decline, or negative performance trends
Free with trial The image features a large, golden dollar sign positioned centrally with a red downward arrow on the left and a green upward arrow on the right, symbolizing financial gain and loss. Decrease growth arrow illustrations Financial fluctuations: gain and loss represented by arrows and dollar sign. The image features a large, golden dollar sign positioned centrally with a red. The image features a large, golden dollar sign positioned centrally with a red downward arrow on the left and a green upward arrow on the right, symbolizing financial gain and loss
Free with trial A 3D rendering of a bar graph depicting a sharp decline in values. The red bars decrease in size, culminating in a large downward red arrow, symbolizing a significant economic downturn or market crash. The broken pieces at the bottom represent the loss or damage incurred. Decrease growth arrow illustrations Red Bar Graph Showing Decline. A 3D rendering of a bar graph depicting a sharp decline in values. The red bars decrease in size, culminating in a large downward. A 3D rendering of a bar graph depicting a sharp decline in values. The red bars decrease in size, culminating in a large downward red arrow, symbolizing a significant economic downturn or market crash. The broken pieces at the bottom represent the loss or damage incurred.
Free with trial Stylized data illustrates financial increase using dollar signs, bar graphs, and arrows. Some data trends down while other data trends up, showing potential profits and losses. Decrease growth arrow illustrations Stock Market Data Shows Economic Growth and Potential Loss in the Future. Stylized data illustrates financial increase using dollar signs, bar graphs, and arrows. Stylized data illustrates financial increase using dollar signs, bar graphs, and arrows. Some data trends down while other data trends up, showing potential profits and losses.
Free with trial A comprehensive vector icon set depicting various aspects of online video content creation and social media analytics. This collection includes symbols for growth charts, play buttons, speech bubbles representing comments or chat, subscriber counts, watch time indicators, and percentage-based progress arrows. Ideal for illustrating concepts related to video platforms, digital marketing, content creator dashboards, performance reports, and online engagement strategies. The modern flat design makes it suitable for websites, mobile applications, and presentations. Decrease growth arrow vectors Video Content and Social Media Analytics Icon Set. A comprehensive vector icon set depicting various aspects of online video content creation and social media. A comprehensive vector icon set depicting various aspects of online video content creation and social media analytics. This collection includes symbols for growth charts, play buttons, speech bubbles representing comments or chat, subscriber counts, watch time indicators, and percentage-based progress arrows. Ideal for illustrating concepts related to video platforms, digital marketing, content creator dashboards, performance reports, and online engagement strategies. The modern flat design makes it suitable for websites, mobile applications, and presentations.
Free with trial Up and down arrows, bar graph, and fingerprint emphasize data analysis, growth, security, identity, biometrics, trends and technology. Ideal for business analytics privacy security technology. Decrease growth arrow illustrations Arrows Indicating Trends With Bar Graph and Digital Fingerprint for Data and Security Concepts. Up and down arrows, bar graph, and fingerprint emphasize data. Up and down arrows, bar graph, and fingerprint emphasize data analysis, growth, security, identity, biometrics, trends and technology. Ideal for business analytics privacy security technology
Free with trial A woman is working on a laptop analyzing a digital graph that shows cost reduction for a successful business model She is using a pen to focus on the downward trend highlighting the strategy and financial planning for efficiency and growth This highlights digital transformation for effective business analysis and future cost management. Decrease growth arrow illustrations Cost Reduction Strategy Digital Transformation Business Analysis and Financial Planning for Success. A woman is working on a laptop analyzing a digital graph. A woman is working on a laptop analyzing a digital graph that shows cost reduction for a successful business model She is using a pen to focus on the downward trend highlighting the strategy and financial planning for efficiency and growth This highlights digital transformation for effective business analysis and future cost management
Free with trial A simplified flat style icon displays a declining bar graph with arrow. Focuses on business and financial themes. Decrease growth arrow vectors Flat icon illustration showing bar chart trending downwards. A simplified flat style icon displays a declining bar graph with arrow. Focuses on business and. A simplified flat style icon displays a declining bar graph with arrow. Focuses on business and financial themes.
Free with trial Three red 3D arrows point downward, each featuring a white percentage sign (%) on a flat white surface. The design conveys a theme of decrease or reduction, often associated with discounts or financial downturns. The arrows are evenly spaced, and their bold colors create a striking visual contrast. Decrease growth arrow illustrations Three red arrows with percentage signs pointing downwards on a black background. Three red 3D arrows point downward, each featuring a white percentage sign (%). Three red 3D arrows point downward, each featuring a white percentage sign (%) on a flat white surface. The design conveys a theme of decrease or reduction, often associated with discounts or financial downturns. The arrows are evenly spaced, and their bold colors create a striking visual contrast.
Free with trial The image depicts a bar graph with five bars of varying heights, each accompanied by an arrow indicating the direction of change. The bars are colored in shades of blue and green, with the arrows in black. The first bar is the tallest and has a downward arrow, the second bar is shorter with an upward arrow, the third bar is the shortest with a downward arrow, the fourth bar is taller than the. Decrease growth arrow illustrations Visual representation of fluctuating data with upward and downward trends. The image depicts a bar graph with five bars of varying heights, each accompanied by. The image depicts a bar graph with five bars of varying heights, each accompanied by an arrow indicating the direction of change. The bars are colored in shades of blue and green, with the arrows in black. The first bar is the tallest and has a downward arrow, the second bar is shorter with an upward arrow, the third bar is the shortest with a downward arrow, the fourth bar is taller than the
Free with trial Stylized graphics depict market trends with up and down arrows. Flat design with simple shapes for business and financial presentations. Decrease growth arrow vectors Stylized infographics illustrating growth and decline with upward and downward arrows on black background. Stylized graphics depict market trends with up and. Stylized graphics depict market trends with up and down arrows. Flat design with simple shapes for business and financial presentations.
Free with trial A digital graphic depicting a financial chart with two prominent line graphs. A blue line trends upward, representing a rising stock price, while a red line trends downward, indicating a decrease in trading volume. The chart is set against a faint, blurred city background, featuring a grid system on the vertical axis labeled 'Volume' and a horizontal axis labeled 'Time', with a red arrow at the. Decrease growth arrow illustrations A financial line chart showing the inverse relationship between stock price and trading volume data. A digital graphic depicting a financial chart with two. A digital graphic depicting a financial chart with two prominent line graphs. A blue line trends upward, representing a rising stock price, while a red line trends downward, indicating a decrease in trading volume. The chart is set against a faint, blurred city background, featuring a grid system on the vertical axis labeled 'Volume' and a horizontal axis labeled 'Time', with a red arrow at the
Free with trial A hand in a suit jacket holds up an upward arrow for quality and a downward arrow for cost against a dark background with glowing particles. Decrease growth arrow illustrations Hand holding upward quality and downward cost percentages business open palm. A hand in a suit jacket holds up an upward arrow for quality and a downward arrow. A hand in a suit jacket holds up an upward arrow for quality and a downward arrow for cost against a dark background with glowing particles
Free with trial Downward arrow points toward stacked coins alongside people icons, representing financial loss and economic challenges. Ideal for finance, economy, recession, budgeting, investment, inequality. Decrease growth arrow vectors Decreasing Wealth Concept with Downward Arrow, Coins, and People Icons. Downward arrow points toward stacked coins alongside people icons, representing financial. Downward arrow points toward stacked coins alongside people icons, representing financial loss and economic challenges. Ideal for finance, economy, recession, budgeting, investment, inequality
Free with trial A colorful, hand-drawn illustration depicting a large percentage symbol surrounded by various financial and statistical icons. This doodle-style artwork includes bar graphs, pie charts, stacks of coins, dollar signs, and arrows indicating growth and decline. The sketch effectively visualizes concepts like interest rates, economic trends, business analytics, investment returns, and market data. Isolated on a white background, this versatile image is perfect for presentations, infographics, financial reports, and educational materials related to business, finance, and statistics. Decrease growth arrow illustrations Hand Drawn Finance and Percentage Concept Illustration. A colorful, hand-drawn illustration depicting a large percentage symbol surrounded by various financial. A colorful, hand-drawn illustration depicting a large percentage symbol surrounded by various financial and statistical icons. This doodle-style artwork includes bar graphs, pie charts, stacks of coins, dollar signs, and arrows indicating growth and decline. The sketch effectively visualizes concepts like interest rates, economic trends, business analytics, investment returns, and market data. Isolated on a white background, this versatile image is perfect for presentations, infographics, financial reports, and educational materials related to business, finance, and statistics.
Free with trial Business partners discussing real estate investment with graphs and statistics in a modern office setting showcasing financial trends and growth potential Sigmoid. Decrease growth arrow illustrations Two business partners in formal attire engage in a conversation about real estate investments, with graphs and. Business partners discussing real estate. Business partners discussing real estate investment with graphs and statistics in a modern office setting showcasing financial trends and growth potential Sigmoid
Free with trial A 3D illustration depicts a financial chart with a downward trend. Four vertical bars, colored yellow, orange, and green, are arranged in descending order of height, suggesting a decline. To the left, a prominent orange circle contains a white downward-pointing arrow, reinforcing the theme of a negative trend or decrease. The entire composition is set against a plain white background. Decrease growth arrow illustrations Financial chart with downward trend indicator stock market. A 3D illustration depicts a financial chart with a downward trend. Four vertical bars, colored yellow. A 3D illustration depicts a financial chart with a downward trend. Four vertical bars, colored yellow, orange, and green, are arranged in descending order of height, suggesting a decline. To the left, a prominent orange circle contains a white downward-pointing arrow, reinforcing the theme of a negative trend or decrease. The entire composition is set against a plain white background
Free with trial A vibrant and diverse set of financial icons, including symbols for money, growth, and profit, as well as various charts and graphs. The icons are colorful and modern, making them perfect for use in business presentations, reports, and marketing materials. The white background provides a clean and neutral space for the icons to stand out, allowing for easy customization and integration into various designs. Decrease growth arrow vectors A collection of colorful financial icons on a white background for business use. A vibrant and diverse set of financial icons, including symbols for money. A vibrant and diverse set of financial icons, including symbols for money, growth, and profit, as well as various charts and graphs. The icons are colorful and modern, making them perfect for use in business presentations, reports, and marketing materials. The white background provides a clean and neutral space for the icons to stand out, allowing for easy customization and integration into various designs.
Free with trial The image features two bar graphs isolated on a white background. The graph on the left has green bars with an upward green arrow indicating growth or increase. The graph on the right has red bars with a downward red arrow indicating decline or decrease. The image is simple and uses contrasting colors for clear visual representation. Decrease growth arrow illustrations Green and red bar graphs with arrows isolated on white background. The image features two bar graphs isolated on a white background. The graph on the left has. The image features two bar graphs isolated on a white background. The graph on the left has green bars with an upward green arrow indicating growth or increase. The graph on the right has red bars with a downward red arrow indicating decline or decrease. The image is simple and uses contrasting colors for clear visual representation
Free with trial A conceptual illustration of market analysis featuring a bar chart, magnifying glass, upward and downward arrows, and business icons on white. Decrease growth arrow illustrations Market Analysis Concept with Bar Chart Magnifying Glass and Upward Arrow graph. A conceptual illustration of market analysis featuring a bar chart, magnifying. A conceptual illustration of market analysis featuring a bar chart, magnifying glass, upward and downward arrows, and business icons on white
Free with trial Two distinct green, pixelated arrows are presented vertically on a white background. The top arrow points upwards, constructed from stacked cubes, while the bottom arrow points downwards, also formed from a pixelated cube structure. The arrows are identical in style and color, representing opposing directions or concepts. Decrease growth arrow illustrations Two Green Pixelated Arrows Pointing Up and Down on White Background image photo. Two distinct green, pixelated arrows are presented vertically on a white. Two distinct green, pixelated arrows are presented vertically on a white background. The top arrow points upwards, constructed from stacked cubes, while the bottom arrow points downwards, also formed from a pixelated cube structure. The arrows are identical in style and color, representing opposing directions or concepts
Free with trial A 3D rendered image of a metallic percentage sign with arrows pointing both upwards and downwards. The upward arrow on top and downward arrow on the bottom symbolize the fluctuating nature of interest rates, inflation, or market trends. The metallic texture adds a sense of solidity and importance to the concept. Suitable for financial, economic, or business-related content. Decrease growth arrow illustrations Fluctuating Interest Rates Concept. A 3D rendered image of a metallic percentage sign with arrows pointing both upwards and downwards. The upward arrow on top. A 3D rendered image of a metallic percentage sign with arrows pointing both upwards and downwards. The upward arrow on top and downward arrow on the bottom symbolize the fluctuating nature of interest rates, inflation, or market trends. The metallic texture adds a sense of solidity and importance to the concept. Suitable for financial, economic, or business-related content.
Free with trial Visual representation of financial trends with euro symbols, depicting both upward and downward movements in bar graph format, suitable for economic analysis. Decrease growth arrow vectors Bar charts showing euro currency growth and decline isolated on transparent background. Visual representation of financial trends with euro symbols, depicting. Visual representation of financial trends with euro symbols, depicting both upward and downward movements in bar graph format, suitable for economic analysis
Free with trial Laptop displays a money bag graphic surrounded by upward and downward arrows, suggesting potential investment changes, great for illustrating financial concepts. Decrease growth arrow illustrations Money Bag on Laptop Screen with Arrows Showing Financial Growth. Laptop displays a money bag graphic surrounded by upward and downward arrows, suggesting. Laptop displays a money bag graphic surrounded by upward and downward arrows, suggesting potential investment changes, great for illustrating financial concepts
Free with trial Two bar charts are displayed side by side. One shows a clear upward trend with a green arrow, while the other shows a downward trend with a red arrow. Decrease growth arrow illustrations Bar charts showing contrasting upward and downward trends. Two bar charts are displayed side by side. One shows a clear upward trend with a green arrow, while. Two bar charts are displayed side by side. One shows a clear upward trend with a green arrow, while the other shows a downward trend with a red arrow
Free with trial Simple line graph illustrating a negative trend, representing a decrease or decline in data. Perfect for presentations, reports, or website design. Decrease growth arrow vectors Downward Trending Line Graph, Showing Negative Growth or Decline. Simple line graph illustrating a negative trend, representing a decrease or decline in data. Simple line graph illustrating a negative trend, representing a decrease or decline in data. Perfect for presentations, reports, or website design.
Free with trial A flat, cartoon-style line graph on a white grid background shows a green upward-pointing arrow representing growth and a red downward-pointing arrow indicating decline, with a red dollar sign placed atop the green arrow to symbolize financial gain, illustrating contrasting economic trends in a simplified, visually engaging manner ideal for business, finance, and investment-related content that. Decrease growth arrow illustrations Upward and downward financial trend with green and red arrows on grid graph. A flat, cartoon-style line graph on a white grid background shows a green upward. A flat, cartoon-style line graph on a white grid background shows a green upward-pointing arrow representing growth and a red downward-pointing arrow indicating decline, with a red dollar sign placed atop the green arrow to symbolize financial gain, illustrating contrasting economic trends in a simplified, visually engaging manner ideal for business, finance, and investment-related content that
Free with trial Bar charts showing upward and downward trends. Two bar charts, one green showing growth and one red showing decline, with trend lines and arrows. Decrease growth arrow illustrations Bar charts showing upward and downward trends. Two bar charts, one green showing growth and one red showing decline, with trend lines and arrows
Free with trial A collection of Indian Rupee symbols presented in circular and square icons, some featuring downward-pointing arrows indicating a decrease in value. A stack of golden coins is also depicted. The icons are arranged in a grid on a white background. Decrease growth arrow illustrations Indian Rupee Currency Symbols with Downward Arrows and Stacked Coins money finance. A collection of Indian Rupee symbols presented in circular and square icons. A collection of Indian Rupee symbols presented in circular and square icons, some featuring downward-pointing arrows indicating a decrease in value. A stack of golden coins is also depicted. The icons are arranged in a grid on a white background
Free with trial Flat of a shocked male passenger wearing a seatbelt sitting in a taxi seat reacting with surprise to a high fare displayed on a large smartphone shaped like a taxi. The screen shows $23. 40 with a rising orange arrow chart and luggage icons. Stacked suitcases nearby emphasize travel. Perfect concept for surge pricing, inflation, expensive transportation, rideshare costs, tourism and financial articles, blogs, and marketing materials. Decrease growth arrow vectors Shocked Passenger Reacts to High Taxi Fare. Flat of a shocked male passenger wearing a seatbelt sitting in a taxi seat reacting with surprise to a high fare. Flat of a shocked male passenger wearing a seatbelt sitting in a taxi seat reacting with surprise to a high fare displayed on a large smartphone shaped like a taxi. The screen shows $23.40 with a rising orange arrow chart and luggage icons. Stacked suitcases nearby emphasize travel. Perfect concept for surge pricing, inflation, expensive transportation, rideshare costs, tourism and financial articles, blogs, and marketing materials.
Free with trial Man examines with magnifying glass, coins signifying finance, gear and downward arrow symbolizing process decline. Ideal for business, analysis, economy, process, research, strategy simple flat. Decrease growth arrow vectors Businessman Holding Magnifying Glass, Coins, and Gear with Downward Arrow. Man examines with magnifying glass, coins signifying finance, gear and downward arrow. Man examines with magnifying glass, coins signifying finance, gear and downward arrow symbolizing process decline. Ideal for business, analysis, economy, process, research, strategy simple flat
Free with trial A 3D illustration depicting financial concepts. A purple rectangular bar shows a sharp red downward trending arrow. Below it, another purple bar displays a candlestick chart with red and blue bars. To the right, a magnifying glass with an orange handle and turquoise lens hovers, suggesting analysis. A small, colorful pie chart with red, yellow, and blue segments is positioned to the left. The. Decrease growth arrow illustrations 3D Financial Downward Trend Chart with Magnifying Glass and Pie Chart finance stock market. A 3D illustration depicting financial concepts. A purple rectangular. A 3D illustration depicting financial concepts. A purple rectangular bar shows a sharp red downward trending arrow. Below it, another purple bar displays a candlestick chart with red and blue bars. To the right, a magnifying glass with an orange handle and turquoise lens hovers, suggesting analysis. A small, colorful pie chart with red, yellow, and blue segments is positioned to the left. The
Free with trial This 3D graphic presents two distinct icons: a vibrant green square with a white upward arrow and a bold red square with a white downward arrow, symbolizing contrasting directions and choices. Decrease growth arrow illustrations Two 3d icons representing up and down arrows, one green and one red. This 3D graphic presents two distinct icons: a vibrant green square with a white upward. This 3D graphic presents two distinct icons: a vibrant green square with a white upward arrow and a bold red square with a white downward arrow, symbolizing contrasting directions and choices
Free with trial Profit and loss concept. Businessmen run with briefcases on the upward growth and downward recession charts. Decrease growth arrow vectors Profit and loss concept. Businessmen run on the up and down arrows. Profit and loss concept. Businessmen run with briefcases on the upward growth and downward. Profit and loss concept. Businessmen run with briefcases on the upward growth and downward recession charts
Free with trial A 3D bar graph with a red line graph indicating a significant decrease, isolated on a clean white background. Decrease growth arrow illustrations Bar graph showing downward trend isolated on white background. A 3D bar graph with a red line graph indicating a significant decrease, isolated on a clean white. A 3D bar graph with a red line graph indicating a significant decrease, isolated on a clean white background
Free with trial Downward arrow alongside a money bag and binary code speech bubble showing cost reduction concepts. Ideal for finance, technology, coding, efficiency, investment, savings, simple flat metaphor. Decrease growth arrow illustrations Decreasing Costs with Digital Transformation and Binary Communication. Downward arrow alongside a money bag and binary code speech bubble showing cost reduction. Downward arrow alongside a money bag and binary code speech bubble showing cost reduction concepts. Ideal for finance, technology, coding, efficiency, investment, savings, simple flat metaphor
Free with trial A red downward arrow symbolizes a decline in financial markets. The background features blurred lights, creating a dramatic effect. financial markets. Decrease growth arrow illustrations A red downward arrow symbolizes a decline in financial markets. The background features blurred lights, creating a dramatic effect. financial markets
Free with trial Four distinct icons show curved arrows pointing upwards and downwards, some with a percentage symbol, representing financial growth and decline. Decrease growth arrow illustrations Financial arrows illustrating percentage changes up and down. Four distinct icons show curved arrows pointing upwards and downwards, some with a percentage. Four distinct icons show curved arrows pointing upwards and downwards, some with a percentage symbol, representing financial growth and decline
Free with trial A white paper receipt floats with a green upward arrow and a red downward arrow, symbolizing financial changes. Decrease growth arrow illustrations 3D Rendered Receipt with Up and Down Arrows Indicating Financial Trends bill invoice. A white paper receipt floats with a green upward arrow and a red downward. A white paper receipt floats with a green upward arrow and a red downward arrow, symbolizing financial changes
Free with trial Money falling down towards golden coins in a minimalistic setting. Bright blue arrow points downward, signifying a drop in value above shiny gold coins. Decrease growth arrow illustrations Money falling down towards golden coins in a minimalistic setting. Bright blue arrow points downward, signifying a drop in value above shiny gold coins
Free with trial 3D graph going up and down with red arrows, blue bar chart icon vector, sales chart with 3D arrow down and arrow up, financial analytics symbol, EPS 10. Decrease growth arrow vectors 3D graph going up and down with red arrows, blue bar chart icon vector, sales chart symbol. 3D graph going up and down with red arrows, blue bar chart icon. 3D graph going up and down with red arrows, blue bar chart icon vector, sales chart with 3D arrow down and arrow up, financial analytics symbol, EPS 10
Free with trial This image shows a downward-trending red arrow graph, generated by AI, illustrating a significant decline. The visual representation is clear and effective in communicating a negative trend, potentially in stock prices, sales figures, or other quantifiable data. Decrease growth arrow illustrations Downward Trending Graph. This image shows a downward-trending red arrow graph, generated by AI, illustrating a significant decline. The visual representation is. This image shows a downward-trending red arrow graph, generated by AI, illustrating a significant decline. The visual representation is clear and effective in communicating a negative trend, potentially in stock prices, sales figures, or other quantifiable data.
Free with trial Flat contrasting food and fuel price trends. On the left a grocery basket filled with bread, milk, fruit, and dairy products sits over a downward arrow, while on the right a red gasoline pump stands in front of a rising orange arrow. Gray gears and plus-minus icons in the center suggest economy and calculation. Perfect for concepts of inflation, cost of living, budgeting, energy crisis, and consumer finance. Decrease growth arrow vectors Rising fuel prices versus falling grocery costs. Flat contrasting food and fuel price trends. On the left a grocery basket filled with bread, milk, fruit, and. Flat contrasting food and fuel price trends. On the left a grocery basket filled with bread, milk, fruit, and dairy products sits over a downward arrow, while on the right a red gasoline pump stands in front of a rising orange arrow. Gray gears and plus-minus icons in the center suggest economy and calculation. Perfect for concepts of inflation, cost of living, budgeting, energy crisis, and consumer finance.
Free with trial Up and Down sign with golden arrows isolated on a black, vector illustration. Concept of sales bar chart symbol icon with arrow moving down and sales bar chart with gold arrows moving up and down. Decrease growth arrow vectors Up and Down sign with golden arrows isolated on a black, vector illustration. Concept of sales bar chart symbol. Icon with arrow moving down and sales bar chart. Up and Down sign with golden arrows isolated on a black, vector illustration. Concept of sales bar chart symbol icon with arrow moving down and sales bar chart with gold arrows moving up and down.
Free with trial The word 'TRENDS' is displayed prominently in blue, overlaid by a sharp, downward-pointing red arrow, visually communicating a negative trend or decline in data or performance. Decrease growth arrow illustrations Word trends with a downward red arrow. The word 'TRENDS' is displayed prominently in blue, overlaid by a sharp, downward-pointing red arrow, visually. The word 'TRENDS' is displayed prominently in blue, overlaid by a sharp, downward-pointing red arrow, visually communicating a negative trend or decline in data or performance
Free with trial A versatile set of business and finance icons isolated on a white background. This collection features various data visualization elements, including bar charts, line graphs, pie charts, and diagrams. The clean, vector style represents concepts like statistical analysis, market growth, financial reporting, and economic trends. These infographic elements are perfect for presentations, business reports, websites, and marketing materials to illustrate progress, performance, and data-driven insights. Decrease growth arrow vectors Business and Finance Chart and Graph Icon Set. A versatile set of business and finance icons isolated on a white background. This collection features various. A versatile set of business and finance icons isolated on a white background. This collection features various data visualization elements, including bar charts, line graphs, pie charts, and diagrams. The clean, vector style represents concepts like statistical analysis, market growth, financial reporting, and economic trends. These infographic elements are perfect for presentations, business reports, websites, and marketing materials to illustrate progress, performance, and data-driven insights.
Free with trial A close-up shot of a hand placing a wooden block with the letter C on top of other blocks spelling COST, with a green downward arrow indicating a decrease or reduction in expenses. Decrease growth arrow illustrations Hand arranging wooden blocks spelling COST with a downward arrow, symbolizing cost reduction. A close-up shot of a hand placing a wooden block with the letter C. A close-up shot of a hand placing a wooden block with the letter C on top of other blocks spelling COST, with a green downward arrow indicating a decrease or reduction in expenses
Free with trial Flat depicting the impact of rising fuel prices on society and economy. A central gas pump with soaring prices and a large orange upward arrow connects to a truck climbing uphill, a man pushing a car, a family, and declining coin stacks. Industrial city skyline in background. Concept of inflation, energy crisis, transportation cost. Ideal for articles, presentations, and reports on economics, fuel, and cost of living. Decrease growth arrow vectors Rising Fuel Prices Impact on Economy Illustration. Flat depicting the impact of rising fuel prices on society and economy. A central gas pump with soaring prices. Flat depicting the impact of rising fuel prices on society and economy. A central gas pump with soaring prices and a large orange upward arrow connects to a truck climbing uphill, a man pushing a car, a family, and declining coin stacks. Industrial city skyline in background. Concept of inflation, energy crisis, transportation cost. Ideal for articles, presentations, and reports on economics, fuel, and cost of living.
Free with trial A businessman is actively typing on a modern, transparent laptop, which prominently displays the word Cost alongside a green downward-pointing arrow, illustrating a concept of cost reduction and improved financial efficiency in business operations. Decrease growth arrow illustrations Businessman typing on laptop with Cost and a downward arrow displayed, symbolizing cost reduction and financial efficiency. A businessman is actively typing on a. A businessman is actively typing on a modern, transparent laptop, which prominently displays the word Cost alongside a green downward-pointing arrow, illustrating a concept of cost reduction and improved financial efficiency in business operations
Free with trial A collection of simple finance graphic element icons, depicting trends, charts, and money. These icons can be used to visualize various financial concepts, such as growth, decline, and investment. Decrease growth arrow vectors Simple Style Finance Graphic Element Icons with Trend, Chart and Money. A collection of simple finance graphic element icons, depicting trends, charts, and money. A collection of simple finance graphic element icons, depicting trends, charts, and money. These icons can be used to visualize various financial concepts, such as growth, decline, and investment.
Free with trial Flat showing a local goods delivery truck crushed between rising fuel price arrow and falling profit arrow, with stacks of euro and dollar coins, margin squeeze text, rising costs sign, and small business owners near closed shops. Concept of inflation, transportation cost, logistics crisis, and economic pressure on retailers. Ideal for articles on energy prices, supply chain, small business struggles, and financial downturn. Decrease growth arrow vectors Rising Fuel Prices Squeezing Local Business Profits. Flat showing a local goods delivery truck crushed between rising fuel price arrow and falling profit arrow. Flat showing a local goods delivery truck crushed between rising fuel price arrow and falling profit arrow, with stacks of euro and dollar coins, margin squeeze text, rising costs sign, and small business owners near closed shops. Concept of inflation, transportation cost, logistics crisis, and economic pressure on retailers. Ideal for articles on energy prices, supply chain, small business struggles, and financial downturn.
Free with trial The image shows a downward trending line, illuminated with a bright blue glow, resembling a graph or chart. the line starts high on the left and descends diagonally to the lower right, ending in an arrow pointing downwards. the background is a dark, metallic texture, lit by several spotlights from above, creating a dramatic effect. the floor reflects the blue light, adding depth to the scene. the overall impression is one of decline or failure, possibly related to business or finance. Decrease growth arrow illustrations Declining trend line with arrow in spotlight. The image shows a downward trending line, illuminated with a bright blue glow, resembling a graph or chart. the. the image shows a downward trending line, illuminated with a bright blue glow, resembling a graph or chart. the line starts high on the left and descends diagonally to the lower right, ending in an arrow pointing downwards. the background is a dark, metallic texture, lit by several spotlights from above, creating a dramatic effect. the floor reflects the blue light, adding depth to the scene. the overall impression is one of decline or failure, possibly related to business or finance.
Free with trial A businessman in a suit is interacting with a digital interface, highlighting the balance between increasing quality and decreasing costs. The interface shows 'Quality' with an upward arrow and 'Cost' with a downward arrow, both marked with checkmarks, symbolizing successful optimization. This image represents business strategy, efficiency, and the importance of finding the right balance for success. Decrease growth arrow illustrations Quality vs. Cost Optimization. A businessman in a suit is interacting with a digital interface, highlighting the balance between increasing quality and. A businessman in a suit is interacting with a digital interface, highlighting the balance between increasing quality and decreasing costs. The interface shows 'Quality' with an upward arrow and 'Cost' with a downward arrow, both marked with checkmarks, symbolizing successful optimization. This image represents business strategy, efficiency, and the importance of finding the right balance for success.
Free with trial Two glossy red arrows point upwards and downwards. This image represents concepts of change, direction, choice, and decision-making in various contexts. Useful for financial charts or conceptual graphics. Decrease growth arrow illustrations Red up and down arrows symbolizing progress growth decline choice direction and decision making. Two glossy red arrows point upwards and downwards. This image. Two glossy red arrows point upwards and downwards. This image represents concepts of change, direction, choice, and decision-making in various contexts. Useful for financial charts or conceptual graphics
Free with trial Vector of a motorcycle delivery courier riding upward on a large red rising graph arrow, surrounded by heavy weights, falling arrows, a stack of coins topped with a fuel pump icon, and delivery boxes. Symbolizes inflation, increasing fuel prices, delivery costs, and economic pressure on logistics. Isolated on white background. Ideal for business, finance, e-commerce, transportation, and economic crisis concepts. Decrease growth arrow vectors Delivery Rider Facing Rising Fuel Costs Illustration. Vector of a motorcycle delivery courier riding upward on a large red rising graph arrow, surrounded by. Vector of a motorcycle delivery courier riding upward on a large red rising graph arrow, surrounded by heavy weights, falling arrows, a stack of coins topped with a fuel pump icon, and delivery boxes. Symbolizes inflation, increasing fuel prices, delivery costs, and economic pressure on logistics. Isolated on white background. Ideal for business, finance, e-commerce, transportation, and economic crisis concepts.
Free with trial A businessman presenting a concept of cost increase versus quality decrease with the help of visual arrows This is a good representation of business strategy financial challenges economic downturn and the need for effective resource management It shows a common corporate problem and a call for efficient solutions Focus is on the hand and arrows. Decrease growth arrow illustrations Business Strategy Showing Increased Cost and Decreased Quality Represented by Hand and Arrows. A businessman presenting a concept of cost increase versus quality. A businessman presenting a concept of cost increase versus quality decrease with the help of visual arrows This is a good representation of business strategy financial challenges economic downturn and the need for effective resource management It shows a common corporate problem and a call for efficient solutions Focus is on the hand and arrows
Free with trial Hand drawn up and down arrows brushstroke icons. Decrease growth arrow illustrations Black brushstroke arrows pointing up and down on white background abstract direction symbols for navigation, growth and. Hand drawn up and down arrows. Hand drawn up and down arrows brushstroke icons
Free with trial Red bar graph shows downward trend with falling coin. Red bar chart illustrating financial decline with gray arrow and single golden coin on white. Decrease growth arrow vectors Red bar graph shows downward trend with falling coin. Red bar chart illustrating financial decline with gray arrow and single golden coin on white
Free with trial This flat vector illustration depicts a rectangular screen displaying a red line graph with a downward pointing arrow. The design uses a clean, minimalist aesthetic with soft pastel background tones and bold outlines. It represents concepts of financial decline, market loss, or negative economic performance in a professional business context. Decrease growth arrow vectors A digital icon showing a red downward trend arrow on a screen. This flat vector illustration depicts a rectangular screen displaying a red line graph with a. This flat vector illustration depicts a rectangular screen displaying a red line graph with a downward pointing arrow. The design uses a clean, minimalist aesthetic with soft pastel background tones and bold outlines. It represents concepts of financial decline, market loss, or negative economic performance in a professional business context
Free with trial This minimalist vector illustration depicts a line chart indicating a negative performance or decline. The design features a clean blue line with circular data points connected by segments, ending in a sharp red arrow pointing downwards. The background is a soft, neutral shade, emphasizing the clear visual representation of financial loss or decreasing statistics. Decrease growth arrow vectors A simple line graph showing a downward trend with a red arrow. This minimalist vector illustration depicts a line chart indicating a negative performance or. This minimalist vector illustration depicts a line chart indicating a negative performance or decline. The design features a clean blue line with circular data points connected by segments, ending in a sharp red arrow pointing downwards. The background is a soft, neutral shade, emphasizing the clear visual representation of financial loss or decreasing statistics
Free with trial A simple and clean graphic featuring two bold red arrows. One arrow points directly upwards, symbolizing growth or increase, while the other points downwards, representing decline or decrease. They ar. Decrease growth arrow illustrations Two red arrows, one pointing up and one down, isolated on white background. A simple and clean graphic featuring two bold red arrows. One arrow points directly. A simple and clean graphic featuring two bold red arrows. One arrow points directly upwards, symbolizing growth or increase, while the other points downwards, representing decline or decrease. They ar
Free with trial Flat centered on an orange delivery truck with rising arrow, surrounded by logistics and supply chain icons including cardboard boxes, oil barrels, invoices, fuel pumps, financial charts, maps with location pins, price tags, gears, and delivery personnel. Concept represents transportation, e-commerce, distribution, cost analysis and global shipping. Ideal for business presentations, logistics articles, supply chain management, marketing materials and economic reports. Decrease growth arrow vectors Logistics Supply Chain Illustration with Delivery Truck. Flat centered on an orange delivery truck with rising arrow, surrounded by logistics and supply chain. Flat centered on an orange delivery truck with rising arrow, surrounded by logistics and supply chain icons including cardboard boxes, oil barrels, invoices, fuel pumps, financial charts, maps with location pins, price tags, gears, and delivery personnel. Concept represents transportation, e-commerce, distribution, cost analysis and global shipping. Ideal for business presentations, logistics articles, supply chain management, marketing materials and economic reports.
Free with trial Flat showing fuel price fluctuations with a red gas pump nozzle, oil barrel, fuel pump and industrial tanks surrounded by rising and falling arrows, bar charts, line graphs, dollar signs and percentage symbols. Red downward arrow contrasts with upward trends indicating market volatility, inflation and energy costs. Ideal for business, finance, economy, petroleum industry articles, presentations and reports about gasoline prices, oil crisis and economic analysis. Decrease growth arrow vectors Fuel Price Increase with Oil Market Graphs Illustration. Flat showing fuel price fluctuations with a red gas pump nozzle, oil barrel, fuel pump and industrial. Flat showing fuel price fluctuations with a red gas pump nozzle, oil barrel, fuel pump and industrial tanks surrounded by rising and falling arrows, bar charts, line graphs, dollar signs and percentage symbols. Red downward arrow contrasts with upward trends indicating market volatility, inflation and energy costs. Ideal for business, finance, economy, petroleum industry articles, presentations and reports about gasoline prices, oil crisis and economic analysis.
Free with trial Vector depicting rising fuel prices and economic impact, featuring a red upward arrow with gas pump and dollar symbol, bar chart breaking apart, gas station producing money bags, orange trucks on a damaged road losing coins, falling red oil barrels, businessmen pushing efficiency gears uphill, and hands with gauges indicating declining profit. Ideal for articles on inflation, energy crisis, transportation costs, logistics, and business finance. Decrease growth arrow vectors Rising Fuel Prices Impacting Transport Efficiency Costs. Vector depicting rising fuel prices and economic impact, featuring a red upward arrow with gas pump and. Vector depicting rising fuel prices and economic impact, featuring a red upward arrow with gas pump and dollar symbol, bar chart breaking apart, gas station producing money bags, orange trucks on a damaged road losing coins, falling red oil barrels, businessmen pushing efficiency gears uphill, and hands with gauges indicating declining profit. Ideal for articles on inflation, energy crisis, transportation costs, logistics, and business finance.
Free with trial A set of six line art icons illustrating financial concepts, including stacks of coins with upward and downward arrows, hands with falling coins, a banknote, and a coin. Decrease growth arrow vectors Finance Icons Money Growth Loss Savings Investment Cash Coins banknote. A set of six line art icons illustrating financial concepts, including stacks of coins. A set of six line art icons illustrating financial concepts, including stacks of coins with upward and downward arrows, hands with falling coins, a banknote, and a coin
Free with trial Flat depicting cost reduction concept with a large gas pump chained to delivery trucks, a falling red arrow, stacks of coins and dollar bills, and business people pushing a large block labeled percent costs. Surrounding icons include bar charts, gears, and directional arrows symbolizing economic decline, logistics, and financial strategy. Ideal for articles on inflation, fuel prices, budgeting, supply chain management, and corporate savings. Decrease growth arrow vectors Business Illustration Reducing Fuel Costs Downward Trend. Flat depicting cost reduction concept with a large gas pump chained to delivery trucks, a falling red. Flat depicting cost reduction concept with a large gas pump chained to delivery trucks, a falling red arrow, stacks of coins and dollar bills, and business people pushing a large block labeled percent costs. Surrounding icons include bar charts, gears, and directional arrows symbolizing economic decline, logistics, and financial strategy. Ideal for articles on inflation, fuel prices, budgeting, supply chain management, and corporate savings.
Free with trial Vector infographic showing total cost of motorcycle ownership with a rider on a red motorbike surrounded by financial charts and icons. Includes fuel price growth, maintenance and repairs breakdown, registration and insurance fees, and depreciation. Features dollar signs, coins, graphs, and city background in blue, orange and gray colors. Ideal for articles about budgeting, transportation economics, insurance, personal finance, and motorbike maintenance planning. Decrease growth arrow vectors Motorcycle Total Ownership Cost Infographic Illustration. Vector infographic showing total cost of motorcycle ownership with a rider on a red motorbike. Vector infographic showing total cost of motorcycle ownership with a rider on a red motorbike surrounded by financial charts and icons. Includes fuel price growth, maintenance and repairs breakdown, registration and insurance fees, and depreciation. Features dollar signs, coins, graphs, and city background in blue, orange and gray colors. Ideal for articles about budgeting, transportation economics, insurance, personal finance, and motorbike maintenance planning.
Free with trial Percentage signs with upward and downward arrows symbolizing increase and decrease. Economic fluctuations and rate changes illustration. Decrease growth arrow vectors Red percentage arrows up and down. Percentage signs with upward and downward arrows symbolizing increase and decrease. Economic fluctuations and rate changes. Percentage signs with upward and downward arrows symbolizing increase and decrease. Economic fluctuations and rate changes illustration
Free with trial A collection of twenty-eight black thin line icons on white background featuring stacks of coins, dollar and euro symbols, money bag, wallet, safe, piggy bank, hands holding coins, growth and decline arrows, percentage signs, exchange symbols, financial charts, target, checkmark and shield. Perfect for representing banking, savings, investment, budgeting and economic concepts in websites, mobile apps, presentations, infographics and financial reports. Decrease growth arrow vectors Set of Money and Coin Line Icons. A collection of twenty-eight black thin line icons on white background featuring stacks of coins, dollar and euro symbols. A collection of twenty-eight black thin line icons on white background featuring stacks of coins, dollar and euro symbols, money bag, wallet, safe, piggy bank, hands holding coins, growth and decline arrows, percentage signs, exchange symbols, financial charts, target, checkmark and shield. Perfect for representing banking, savings, investment, budgeting and economic concepts in websites, mobile apps, presentations, infographics and financial reports.
Free with trial Vector of a balance scale comparing delivery costs and sales. The heavy left side labeled delivery costs holds shipping containers, fuel pump and rising orange arrows with cost percentage. The light right side labeled sales holds a sad shopping cart and price tags with falling red arrow. Background shows gas station, delivery trucks and city. Concept of inflation, logistics crisis, ecommerce challenges. Ideal for business, economy, supply chain articles and presentations. Decrease growth arrow vectors Rising Delivery Costs Versus Declining Sales Illustration. Vector of a balance scale comparing delivery costs and sales. The heavy left side labeled delivery. Vector of a balance scale comparing delivery costs and sales. The heavy left side labeled delivery costs holds shipping containers, fuel pump and rising orange arrows with cost percentage. The light right side labeled sales holds a sad shopping cart and price tags with falling red arrow. Background shows gas station, delivery trucks and city. Concept of inflation, logistics crisis, ecommerce challenges. Ideal for business, economy, supply chain articles and presentations.
Free with trial 3D Isometric Flat Vector Illustration of Fertility Reduction In Europe, Decline Chart Showing Decrease in Number of People over Time. Decrease growth arrow vectors 3D Isometric Flat Vector Illustration of Fertility Reduction In Europe. Decline Chart Showing Decrease in Number of People over Time
Free with trial Flat showing the impact of rising fuel prices on delivery business. A courier on a loaded scooter climbs a steep upward arrow labeled delivery cost, while a second arrow shows falling sales. Elements include warehouses, gas pump with coins, worried customers and shopping basket. Concept of inflation, logistics expense, e-commerce challenge and economic downturn. Ideal for articles on transportation, retail, supply chain and small business finance. Decrease growth arrow vectors Rising Delivery Costs Causing Declining Sales Illustration. Flat showing the impact of rising fuel prices on delivery business. A courier on a loaded scooter. Flat showing the impact of rising fuel prices on delivery business. A courier on a loaded scooter climbs a steep upward arrow labeled delivery cost, while a second arrow shows falling sales. Elements include warehouses, gas pump with coins, worried customers and shopping basket. Concept of inflation, logistics expense, e-commerce challenge and economic downturn. Ideal for articles on transportation, retail, supply chain and small business finance.
Free with trial Dollar sign with up and down arrows. Bright vector illustration showing a dollar sign balanced between a red downward and green upward arrow. Decrease growth arrow illustrations Dollar sign with up and down arrows. Bright vector illustration showing a dollar sign balanced between a red downward and green upward arrow
Free with trial Dollar sign with up and down arrows. 3D dollar sign symbol with contrasting upward green arrow and downward red arrow indicating financial trends. Decrease growth arrow illustrations Dollar sign with up and down arrows. 3D dollar sign symbol with contrasting upward green arrow and downward red arrow indicating financial trends
Free with trial A 3D rendering depicts a scale balancing location markers (representing market presence) and a downward-trending arrow (symbolizing market value decline). It visually represents the complex relationship between a business's geographic reach and its financial performance, highlighting how even strong. Decrease growth arrow illustrations Location vs. Market Value. A 3D rendering depicts a scale balancing location markers (representing market presence) and a downward-trending arrow (symbolizing. A 3D rendering depicts a scale balancing location markers (representing market presence) and a downward-trending arrow (symbolizing market value decline). It visually represents the complex relationship between a business's geographic reach and its financial performance, highlighting how even strong
Free with trial This set includes 15 high-quality, vector business icons representing various aspects of finance, networking, and growth. Perfect for websites, presentations, and applications. These simple yet effective icons provide visual clarity and professionalism. Decrease growth arrow illustrations Business Icon Set. This set includes 15 high-quality, vector business icons representing various aspects of finance, networking, and growth. Perfect for websites. This set includes 15 high-quality, vector business icons representing various aspects of finance, networking, and growth. Perfect for websites, presentations, and applications. These simple yet effective icons provide visual clarity and professionalism.
Free with trial Three stacks of gold coins, two labeled 'OM' and one labeled 'OP', with a blue arrow pointing downwards towards the center stack, symbolizing financial decline or a decrease in value. Decrease growth arrow illustrations Stacks of coins with an arrow pointing down, isolated on white background. Three stacks of gold coins, two labeled 'OM' and one labeled 'OP', with a blue arrow. Three stacks of gold coins, two labeled 'OM' and one labeled 'OP', with a blue arrow pointing downwards towards the center stack, symbolizing financial decline or a decrease in value
Free with trial A downward trending graph overlays a stack of coins spilling from an overflowing wallet, symbolizing decreasing financial growth, economic downturn, and financial crisis. Represents investment loss, debt, budget concerns, and market recession. Ideal for illustrating financial instability and economic hardship, generated by AI. Decrease growth arrow illustrations Decreasing financial growth stacked coins wallet. A downward trending graph overlays a stack of coins spilling from an overflowing wallet, symbolizing decreasing. A downward trending graph overlays a stack of coins spilling from an overflowing wallet, symbolizing decreasing financial growth, economic downturn, and financial crisis. Represents investment loss, debt, budget concerns, and market recession. Ideal for illustrating financial instability and economic hardship, generated by AI.
Free with trial A stylized blue price tag is depicted against a clean white background. The tag features a dark outline and a rounded bottom edge. Prominently displayed on its surface are two contrasting arrows: a vibrant green arrow pointing upwards and an orange arrow pointing downwards. These arrows symbolize concepts like exchange, trade, price fluctuations, or the movement of goods. The image is simple, graphic, and easily understandable, making it suitable for various commercial and informational applications. Decrease growth arrow illustrations Blue Price Tag with Up and Down Arrows. A stylized blue price tag is depicted against a clean white background. The tag features a dark outline and a rounded. A stylized blue price tag is depicted against a clean white background. The tag features a dark outline and a rounded bottom edge. Prominently displayed on its surface are two contrasting arrows: a vibrant green arrow pointing upwards and an orange arrow pointing downwards. These arrows symbolize concepts like exchange, trade, price fluctuations, or the movement of goods. The image is simple, graphic, and easily understandable, making it suitable for various commercial and informational applications.
 Sign in