Free with trial Financial graph with green and red pointers, Business strategy, Business concept, Price increase, Price decrease. Decrease growth arrow vectors Financial graph with green and red pointers, Business strategy, Business concept. Price increase, Price decrease
Free with trial Financial graph with green and red pointers, Business strategy, Business concept, Price increase, Price decrease. Decrease growth arrow vectors Financial graph with green and red pointers, Business strategy, Business concept. Price increase, Price decrease
Free with trial A 3D rendered illustration depicting a bright yellow coin with a prominent white dollar sign at its center. Flanking the coin are two circular icons: one with a green upward-pointing arrow and the other with a red downward-pointing arrow. The entire composition is set against a clean white background, symbolizing financial concepts of growth and decline. Decrease growth arrow illustrations 3D Rendered Yellow Dollar Coin with Up and Down Arrows on White. A 3D rendered illustration depicting a bright yellow coin with a prominent white dollar sign at. A 3D rendered illustration depicting a bright yellow coin with a prominent white dollar sign at its center. Flanking the coin are two circular icons: one with a green upward-pointing arrow and the other with a red downward-pointing arrow. The entire composition is set against a clean white background, symbolizing financial concepts of growth and decline
Free with trial Bright green and yellow arrow icons pointing up and down on a simple geometric triangular stand for growth and balance concepts. Decrease growth arrow illustrations Up and down arrows on a triangular base. Bright green and yellow arrow icons pointing up and down on a simple geometric triangular stand for growth and balance. Bright green and yellow arrow icons pointing up and down on a simple geometric triangular stand for growth and balance concepts
Free with trial Collection of twenty-four black thin line pie chart icons arranged in grid on white background, featuring variations with financial symbols, magnifying glass, shopping carts, graphs, arrows, global and business elements. Minimalist outline style represents data analysis, statistics, market research, reporting and business growth. Ideal for presentations, infographics, websites, mobile apps, dashboards and financial documents requiring clean modern data visualization symbols. Decrease growth arrow vectors Set of Pie Chart Line Icons Collection. Collection of twenty-four black thin line pie chart icons arranged in grid on white background, featuring variations with. Collection of twenty-four black thin line pie chart icons arranged in grid on white background, featuring variations with financial symbols, magnifying glass, shopping carts, graphs, arrows, global and business elements. Minimalist outline style represents data analysis, statistics, market research, reporting and business growth. Ideal for presentations, infographics, websites, mobile apps, dashboards and financial documents requiring clean modern data visualization symbols.
Free with trial Modern black and white vector icons depicting financial trends like rising, falling, and stable graphs, dollar signs, and investment arrows for business presentations and reports. Decrease growth arrow vectors Financial trend icons vector illustration showing profit loss growth and investment flat design. Modern black and white vector icons depicting financial trends. Modern black and white vector icons depicting financial trends like rising, falling, and stable graphs, dollar signs, and investment arrows for business presentations and reports.
Free with trial A collection of colorful flat design icons centered around a large price tag with dollar sign, downward arrow and warning triangle, symbolizing price drop and financial risk. Surrounding icons include money, charts, trucks, shopping bags, magnifying glasses, calendars and warning signs in red, yellow and blue. Isolated on white background. Ideal for business, finance, e-commerce, inflation, crisis, discount and economic analysis concepts in presentations and websites. Decrease growth arrow vectors Financial Risk and Price Drop Icon Set. A collection of colorful flat design icons centered around a large price tag with dollar sign, downward arrow and warning. A collection of colorful flat design icons centered around a large price tag with dollar sign, downward arrow and warning triangle, symbolizing price drop and financial risk. Surrounding icons include money, charts, trucks, shopping bags, magnifying glasses, calendars and warning signs in red, yellow and blue. Isolated on white background. Ideal for business, finance, e-commerce, inflation, crisis, discount and economic analysis concepts in presentations and websites.
Free with trial This image features two prominent arrows pointing upwards one green and one red symbolizing contrasting financial performance or progress in different areas. Decrease growth arrow illustrations Two upward arrows green and red showing growth progress and contrasting trends. This image features two prominent arrows pointing upwards one green and one red. This image features two prominent arrows pointing upwards one green and one red symbolizing contrasting financial performance or progress in different areas
Free with trial Modern icon showing a red downward percentage arrow and green upward price arrow for financial trends and growth concepts. Decrease growth arrow illustrations Percentage and price increase arrows icon. Modern icon showing a red downward percentage arrow and green upward price arrow for financial trends and growth. Modern icon showing a red downward percentage arrow and green upward price arrow for financial trends and growth concepts
Free with trial A bar chart showing a steady decline with a red downward arrow, symbolizing financial loss, economic downturn, business decline, or negative performance trends. Decrease growth arrow illustrations Economic Downtrend Bar Chart for Business concept 3d Rendering. A bar chart showing a steady decline with a red downward arrow, symbolizing financial loss. A bar chart showing a steady decline with a red downward arrow, symbolizing financial loss, economic downturn, business decline, or negative performance trends
Free with trial A bar chart showing a steady decline with a red downward arrow, symbolizing financial loss, economic downturn, business decline, or negative performance trends. Decrease growth arrow illustrations Economic Downtrend Bar Chart for Business concept 3d Rendering. A bar chart showing a steady decline with a red downward arrow, symbolizing financial loss. A bar chart showing a steady decline with a red downward arrow, symbolizing financial loss, economic downturn, business decline, or negative performance trends
Free with trial A bar chart showing a steady decline with a red downward arrow, symbolizing financial loss, economic downturn, business decline, or negative performance trends. Decrease growth arrow illustrations Economic Downtrend Bar Chart for Business concept 3d Rendering. A bar chart showing a steady decline with a red downward arrow, symbolizing financial loss. A bar chart showing a steady decline with a red downward arrow, symbolizing financial loss, economic downturn, business decline, or negative performance trends
Free with trial A 3D bar chart with a red arrow indicating a significant downward trend, symbolizing financial loss or economic decline. Isolated on a white background. Decrease growth arrow illustrations Bar chart showing a downward trend isolated on white background. A 3D bar chart with a red arrow indicating a significant downward trend, symbolizing financial. A 3D bar chart with a red arrow indicating a significant downward trend, symbolizing financial loss or economic decline. Isolated on a white background
Free with trial Wooden blocks spelling COST stand above coins, with white arrows pointing downwards, symbolizing a decrease in expenses. Decrease growth arrow illustrations Cost reduction concept with downward arrows and coins. Wooden blocks spelling COST stand above coins, with white arrows pointing downwards, symbolizing a. Wooden blocks spelling COST stand above coins, with white arrows pointing downwards, symbolizing a decrease in expenses
Free with trial A collection of twenty-four colorful flat-style financial and economic icons arranged in a grid on white background, including growth and decline charts, money bags, dollar coins, cash stacks, inflation balloons, interest rates, tax documents, budget calculators, shopping carts, delivery trucks, forklifts, global shipping, and business graphs. Ideal for illustrating banking, accounting, investment, market analysis, e-commerce, logistics, and economic concepts in presentations, websites, reports, and marketing materials. Decrease growth arrow vectors Colorful Set of Finance and Business Icons. A collection of twenty-four colorful flat-style financial and economic icons arranged in a grid on white background. A collection of twenty-four colorful flat-style financial and economic icons arranged in a grid on white background, including growth and decline charts, money bags, dollar coins, cash stacks, inflation balloons, interest rates, tax documents, budget calculators, shopping carts, delivery trucks, forklifts, global shipping, and business graphs. Ideal for illustrating banking, accounting, investment, market analysis, e-commerce, logistics, and economic concepts in presentations, websites, reports, and marketing materials.
Free with trial This flat depicts the economic concept of inflation driving up the value of gold. A red flame icon labeled 'INFLATION' points via an arrow to a gold bar with an upward arrow labeled 'GOLD', symbolizing rising prices and the asset's role as a hedge. The minimalist design uses bold colors and simple shapes to convey financial themes, making it suitable for presentations, articles on economics, investment guides, or infographics about market trends. Decrease growth arrow vectors Inflation leads to gold price increase concept. This flat depicts the economic concept of inflation driving up the value of gold. A red flame icon labeled '. This flat depicts the economic concept of inflation driving up the value of gold. A red flame icon labeled 'INFLATION' points via an arrow to a gold bar with an upward arrow labeled 'GOLD', symbolizing rising prices and the asset's role as a hedge. The minimalist design uses bold colors and simple shapes to convey financial themes, making it suitable for presentations, articles on economics, investment guides, or infographics about market trends.
Free with trial This vibrant vector illustration showcases a collection of red and orange gradient arrows, all pointing downwards. The set includes both straight and dynamically curved arrows, effectively symbolizing various forms of decline, decrease, or negative trends. Perfect for use in business presentations, financial reports, infographics, or any design requiring a clear visual representation of falling statistics, market drops, recession, loss, or a general downward movement. The clean, modern flat design ensures versatility and impact. Decrease growth arrow vectors Downward Trend Red Gradient Arrows Vector Set. This vibrant vector illustration showcases a collection of red and orange gradient arrows, all pointing downwards. This vibrant vector illustration showcases a collection of red and orange gradient arrows, all pointing downwards. The set includes both straight and dynamically curved arrows, effectively symbolizing various forms of decline, decrease, or negative trends. Perfect for use in business presentations, financial reports, infographics, or any design requiring a clear visual representation of falling statistics, market drops, recession, loss, or a general downward movement. The clean, modern flat design ensures versatility and impact.
Free with trial This image shows two bar graphs. One shows an upward trend with an arrow pointing up. The other shows a downward trend with an arrow pointing down. Black and white. Decrease growth arrow illustrations Black and white illustration showing upward and downward trending bar graphs with arrows pointing up down. This image shows two bar graphs. One shows an upward. This image shows two bar graphs. One shows an upward trend with an arrow pointing up. The other shows a downward trend with an arrow pointing down. Black and white.
Free with trial Set of twenty-four minimalist black line icons on white background featuring business analytics and performance symbols including charts, graphs, pie chart, bar graph, arrows, target, funnel, clock, calendar, location, gear, rocket, database, lightbulb and star. Clean outline style ideal for dashboards, reports, presentations, infographics, websites and mobile apps illustrating growth, strategy, marketing, data analysis and management concepts. Decrease growth arrow vectors Business Analytics Line Icons Set Collection. Set of twenty-four minimalist black line icons on white background featuring business analytics and performance. Set of twenty-four minimalist black line icons on white background featuring business analytics and performance symbols including charts, graphs, pie chart, bar graph, arrows, target, funnel, clock, calendar, location, gear, rocket, database, lightbulb and star. Clean outline style ideal for dashboards, reports, presentations, infographics, websites and mobile apps illustrating growth, strategy, marketing, data analysis and management concepts.
Free with trial Two purple arrows, one pointing up and one down, each with a pink and white percentage sign, symbolize financial growth and decline. Decrease growth arrow illustrations Purple up and down arrows with percentage signs representing financial change. Two purple arrows, one pointing up and one down, each with a pink and white. Two purple arrows, one pointing up and one down, each with a pink and white percentage sign, symbolize financial growth and decline
Free with trial This flat infographic illustrates the inverse relationship between monetary policy and gold valuation. The left panel features a red downward arrow beneath a percentage symbol, labeled 'Monetary Policy' and 'Interest Rates & Currency Value. ' The right panel displays a teal upward arrow pointing toward a gold bar, labeled 'Gold' and 'Asset Value & Safe Haven. ' This conceptual design is ideal for financial presentations, economic reports, and investment blogs discussing interest rate cuts, inflation, and the role of precious metals as safe-haven assets. Decrease growth arrow vectors Monetary Policy and Gold Asset Value Infographic. This flat infographic illustrates the inverse relationship between monetary policy and gold valuation. The left. This flat infographic illustrates the inverse relationship between monetary policy and gold valuation. The left panel features a red downward arrow beneath a percentage symbol, labeled 'Monetary Policy' and 'Interest Rates & Currency Value.' The right panel displays a teal upward arrow pointing toward a gold bar, labeled 'Gold' and 'Asset Value & Safe Haven.' This conceptual design is ideal for financial presentations, economic reports, and investment blogs discussing interest rate cuts, inflation, and the role of precious metals as safe-haven assets.
Free with trial Flat showing a small local shop being squeezed between two large fists labeled rising costs and supply chain transport. Upward prices arrow above store, downward margins banner below with euro symbols. Surrounding businessmen, bar charts, gears and dollar icons represent energy, rent, materials, inflation and logistics pressure. Ideal for articles on small business crisis, inflation, retail economics, entrepreneurship challenges and economic downturn concepts. Decrease growth arrow vectors Local Shop Squeezed by Rising Costs and Prices. Flat showing a small local shop being squeezed between two large fists labeled rising costs and supply chain. Flat showing a small local shop being squeezed between two large fists labeled rising costs and supply chain transport. Upward prices arrow above store, downward margins banner below with euro symbols. Surrounding businessmen, bar charts, gears and dollar icons represent energy, rent, materials, inflation and logistics pressure. Ideal for articles on small business crisis, inflation, retail economics, entrepreneurship challenges and economic downturn concepts.
Free with trial A graphic illustrating the concept of home value trends. A green arrow pointing upwards represents growth, while a red arrow pointing downwards signifies decline. A family icon is placed above the arrows. Decrease growth arrow illustrations Family Home Value: Upward Trend, Downward Trend, Financial Concepts. A graphic illustrating the concept of home value trends. A green arrow pointing upwards. A graphic illustrating the concept of home value trends. A green arrow pointing upwards represents growth, while a red arrow pointing downwards signifies decline. A family icon is placed above the arrows
Free with trial This graphic features a bold yellow arrow pointing downwards against a clean background. The word costs is printed in a simple black sans-serif font across the center of the arrow. The design uses a flat aesthetic with a subtle drop shadow to create a sense of depth and visual clarity. It serves as a clear conceptual representation of financial reduction or economic trends. Decrease growth arrow vectors A bright yellow downward pointing arrow with the word costs written on it. This graphic features a bold yellow arrow pointing downwards against a clean. This graphic features a bold yellow arrow pointing downwards against a clean background. The word costs is printed in a simple black sans-serif font across the center of the arrow. The design uses a flat aesthetic with a subtle drop shadow to create a sense of depth and visual clarity. It serves as a clear conceptual representation of financial reduction or economic trends
Free with trial A 3D rendered image displays a large white dollar sign ($) centered on a vibrant purple circle. Flanking the central circle are two smaller white circles, one containing a green upward-pointing arrow and the other a red downward-pointing arrow. This composition visually represents financial concepts like currency exchange, market fluctuations, or profit and loss. Decrease growth arrow illustrations 3D Dollar Sign with Up and Down Arrows on Purple and White Circles currency money. A 3D rendered image displays a large white dollar sign ($) centered on a. A 3D rendered image displays a large white dollar sign ($) centered on a vibrant purple circle. Flanking the central circle are two smaller white circles, one containing a green upward-pointing arrow and the other a red downward-pointing arrow. This composition visually represents financial concepts like currency exchange, market fluctuations, or profit and loss
Free with trial Collection of twenty-eight black thin line icons on white background featuring business and analytics symbols including charts, graphs, arrows, percentage, bell, checklist, shield, clock, speedometer, documents and growth indicators. Clean minimalist outline style perfect for web design, mobile apps, presentations, dashboards, financial reports, marketing materials and infographics representing performance, progress, monitoring, strategy and success concepts. Decrease growth arrow vectors Set of Minimalist Business Analytics Line Icons. Collection of twenty-eight black thin line icons on white background featuring business and analytics symbols. Collection of twenty-eight black thin line icons on white background featuring business and analytics symbols including charts, graphs, arrows, percentage, bell, checklist, shield, clock, speedometer, documents and growth indicators. Clean minimalist outline style perfect for web design, mobile apps, presentations, dashboards, financial reports, marketing materials and infographics representing performance, progress, monitoring, strategy and success concepts.
Free with trial A bar chart showing a steady decline with a red downward arrow, symbolizing financial loss, economic downturn, business decline, or negative performance trends. Decrease growth arrow illustrations Economic Downtrend Bar Chart for Business concept 3d Rendering. A bar chart showing a steady decline with a red downward arrow, symbolizing financial loss. A bar chart showing a steady decline with a red downward arrow, symbolizing financial loss, economic downturn, business decline, or negative performance trends
Free with trial Stack of coins with downward trending graph arrow. A metallic downward trending graph arrow resting on a stack of silver coins against a white background. Decrease growth arrow illustrations Stack of coins with downward trending graph arrow. A metallic downward trending graph arrow resting on a stack of silver coins against a white background
Free with trial A colorful set of flat line business and finance icons isolated on white background including newspaper, bar charts, pie chart, dollar coins, money bags, growth arrows, delivery trucks, cargo ships, trains and investment symbols. Designed in red, blue, orange and gray tones. Perfect concept for economy, trade, logistics, banking, market analysis, financial news and e-commerce. Ideal for presentations, websites, apps and infographics. Decrease growth arrow vectors Business Finance Logistics Icon Set Collection. A colorful set of flat line business and finance icons isolated on white background including newspaper, bar. A colorful set of flat line business and finance icons isolated on white background including newspaper, bar charts, pie chart, dollar coins, money bags, growth arrows, delivery trucks, cargo ships, trains and investment symbols. Designed in red, blue, orange and gray tones. Perfect concept for economy, trade, logistics, banking, market analysis, financial news and e-commerce. Ideal for presentations, websites, apps and infographics.
Free with trial Collection of thirty-two colorful flat line icons related to business, finance and economy on white background. Includes symbols for money, banking, investment, charts, growth, taxes, bills, shopping carts, shipping, logistics, real estate and analytics. Designed in orange, red, blue and yellow outline style. Perfect concept for financial reports, presentations, websites, mobile apps, infographics and marketing materials illustrating global trade, commerce and economic trends. Decrease growth arrow vectors Colorful Business Finance and Economy Icon Set. Collection of thirty-two colorful flat line icons related to business, finance and economy on white background. Collection of thirty-two colorful flat line icons related to business, finance and economy on white background. Includes symbols for money, banking, investment, charts, growth, taxes, bills, shopping carts, shipping, logistics, real estate and analytics. Designed in orange, red, blue and yellow outline style. Perfect concept for financial reports, presentations, websites, mobile apps, infographics and marketing materials illustrating global trade, commerce and economic trends.
Free with trial Infographic collage illustrating rising fuel prices and economic inflation with multiple line and bar charts showing upward and downward trends. Central image features a fuel pump nozzle over a bold red-orange rising arrow, surrounded by icons of shopping carts, houses, coins, and delivery trucks. Blue, gray, and red graphs depict cost increases. Ideal for articles on energy, economy, inflation, logistics, and financial analysis. Decrease growth arrow vectors Rising Fuel Prices and Inflation Economic Charts. Infographic collage illustrating rising fuel prices and economic inflation with multiple line and bar charts. Infographic collage illustrating rising fuel prices and economic inflation with multiple line and bar charts showing upward and downward trends. Central image features a fuel pump nozzle over a bold red-orange rising arrow, surrounded by icons of shopping carts, houses, coins, and delivery trucks. Blue, gray, and red graphs depict cost increases. Ideal for articles on energy, economy, inflation, logistics, and financial analysis.
Free with trial A clean, minimalist set of line art icons representing business and service plan management. The icons depict 'Plan Switch' with a toggle symbol, 'Upgrade' with an upward arrow, and 'Downgrade' with a downward arrow. Another 'Downgrade' icon shows a document transitioning to a dollar sign, indicating a change in service level or cost. These graphics are ideal for websites, apps, presentations, and marketing materials related to subscription services, software features, or financial planning. Decrease growth arrow illustrations Business Plan Icons: Upgrade, Downgrade, and Switch. A clean, minimalist set of line art icons representing business and service plan management. The icons. A clean, minimalist set of line art icons representing business and service plan management. The icons depict 'Plan Switch' with a toggle symbol, 'Upgrade' with an upward arrow, and 'Downgrade' with a downward arrow. Another 'Downgrade' icon shows a document transitioning to a dollar sign, indicating a change in service level or cost. These graphics are ideal for websites, apps, presentations, and marketing materials related to subscription services, software features, or financial planning.
Free with trial A collection of twenty-four black thin line icons on white background representing finance, investment and agriculture themes. Includes symbols for money growth, interest rates, gold bars, diamonds, cryptocurrency, stock charts, market trends, savings lock and safe, risk warning, diversification arrows, farming tools, wheat harvest, seedlings and potted plants. Clean minimalist outline style ideal for business presentations, financial reports, banking apps, economic articles, infographics and agricultural projects. Decrease growth arrow vectors Finance Investment and Agriculture Line Icon Set. A collection of twenty-four black thin line icons on white background representing finance, investment and. A collection of twenty-four black thin line icons on white background representing finance, investment and agriculture themes. Includes symbols for money growth, interest rates, gold bars, diamonds, cryptocurrency, stock charts, market trends, savings lock and safe, risk warning, diversification arrows, farming tools, wheat harvest, seedlings and potted plants. Clean minimalist outline style ideal for business presentations, financial reports, banking apps, economic articles, infographics and agricultural projects.
Free with trial Collection of twenty-four colorful flat line oil and petroleum industry icons isolated on white background featuring barrels, pumpjack, rig, refinery, pipeline valve, tanker ship and truck, gas station pump, global maps, and financial charts showing price growth and decline. Perfect for illustrating energy market, crude trading, fuel costs, economy reports, business presentations, websites, and educational materials about fossil fuels. Decrease growth arrow vectors Oil Industry Icons Set Including Barrels Charts. Collection of twenty-four colorful flat line oil and petroleum industry icons isolated on white background. Collection of twenty-four colorful flat line oil and petroleum industry icons isolated on white background featuring barrels, pumpjack, rig, refinery, pipeline valve, tanker ship and truck, gas station pump, global maps, and financial charts showing price growth and decline. Perfect for illustrating energy market, crude trading, fuel costs, economy reports, business presentations, websites, and educational materials about fossil fuels.
Free with trial A collection of thirty-two colorful flat line business and finance icons arranged in grid on white background. Includes charts, graphs, candlesticks, pie charts, bull and bear markets, rockets, wallets, coins, calculator, shopping cart, target, gears, clock, real estate and documents. Modern outline style with blue, red and orange colors. Perfect for financial presentations, investment apps, banking websites, economic reports, marketing materials and infographics illustrating growth, trading and success concepts. Decrease growth arrow vectors Colorful Business Finance Stock Market Icon Set. A collection of thirty-two colorful flat line business and finance icons arranged in grid on white background. A collection of thirty-two colorful flat line business and finance icons arranged in grid on white background. Includes charts, graphs, candlesticks, pie charts, bull and bear markets, rockets, wallets, coins, calculator, shopping cart, target, gears, clock, real estate and documents. Modern outline style with blue, red and orange colors. Perfect for financial presentations, investment apps, banking websites, economic reports, marketing materials and infographics illustrating growth, trading and success concepts.
Free with trial Flat showing an oil barrel with fuel pump nozzle in center surrounded by rising orange and falling gray arrows, bar charts, line graphs, cargo ship, airplane, factories, pressure gauge and gold coins on white background. Concept represents crude oil price volatility, fuel cost inflation, energy market trends, transportation expenses and industrial impact. Ideal for business, finance, economy articles, energy reports and investment presentations. Decrease growth arrow vectors Rising Oil Prices Affecting Global Economy Growth. Flat showing an oil barrel with fuel pump nozzle in center surrounded by rising orange and falling gray arrows. Flat showing an oil barrel with fuel pump nozzle in center surrounded by rising orange and falling gray arrows, bar charts, line graphs, cargo ship, airplane, factories, pressure gauge and gold coins on white background. Concept represents crude oil price volatility, fuel cost inflation, energy market trends, transportation expenses and industrial impact. Ideal for business, finance, economy articles, energy reports and investment presentations.
Free with trial Flat showing a red fuel pump nozzle with an anchor symbolizing high fuel prices, chained to a blue delivery cargo truck carrying boxes. A rising bar chart on the pump contrasts with a large red downward arrow over the truck, representing declining logistics efficiency and increased transportation costs. Isolated on white background. Ideal for articles on inflation, supply chain crisis, energy, freight, and economic challenges. Decrease growth arrow vectors Rising Fuel Prices Impacting Delivery Truck Costs. Flat showing a red fuel pump nozzle with an anchor symbolizing high fuel prices, chained to a blue delivery. Flat showing a red fuel pump nozzle with an anchor symbolizing high fuel prices, chained to a blue delivery cargo truck carrying boxes. A rising bar chart on the pump contrasts with a large red downward arrow over the truck, representing declining logistics efficiency and increased transportation costs. Isolated on white background. Ideal for articles on inflation, supply chain crisis, energy, freight, and economic challenges.
Free with trial Flat showing a family with two children standing beside a loaded car carrying luggage, dollar coins and banknotes on its roof. A heavy anchor with a money bag holds the vehicle back by a breaking chain, while a large red arrow rises upward. Icons for fuel, maintenance and insurance appear nearby, with decreasing coin stacks below. Concept of rising auto expenses, inflation and financial burden, ideal for finance, insurance and automotive articles. Decrease growth arrow vectors Family struggling with rising car ownership costs. Flat showing a family with two children standing beside a loaded car carrying luggage, dollar coins and. Flat showing a family with two children standing beside a loaded car carrying luggage, dollar coins and banknotes on its roof. A heavy anchor with a money bag holds the vehicle back by a breaking chain, while a large red arrow rises upward. Icons for fuel, maintenance and insurance appear nearby, with decreasing coin stacks below. Concept of rising auto expenses, inflation and financial burden, ideal for finance, insurance and automotive articles.
Free with trial Flat showing economic inflation and market volatility with rising blue arrow and falling red arrow surrounded by icons for grocery cart, housing costs, coin stacks, fuel pump, shipping, factory production decline, bar chart and food bag on white background. Red and orange upward arrows indicate price increases while gray downward arrows show industrial slowdown. Ideal for finance, business, news articles about inflation, recession, cost of living and global economy. Decrease growth arrow vectors Rising Prices Inflation Chart With Economic Icons. Flat showing economic inflation and market volatility with rising blue arrow and falling red arrow surrounded. Flat showing economic inflation and market volatility with rising blue arrow and falling red arrow surrounded by icons for grocery cart, housing costs, coin stacks, fuel pump, shipping, factory production decline, bar chart and food bag on white background. Red and orange upward arrows indicate price increases while gray downward arrows show industrial slowdown. Ideal for finance, business, news articles about inflation, recession, cost of living and global economy.
Free with trial Flat of a delivery van overloaded with large red boxes marked with downward arrow and rising cost symbols, while a shocked worker in overalls sits on top with raised hands. A wrench falls, bar chart with upward trend in background, toolbox nearby. Concept represents rising delivery costs, logistics overload, inflation, supply chain crisis and small business struggle. Ideal for articles on transportation, e-commerce, economy and freight management. Decrease growth arrow vectors Overloaded Delivery Van With Falling Cargo Crisis. Flat of a delivery van overloaded with large red boxes marked with downward arrow and rising cost symbols. Flat of a delivery van overloaded with large red boxes marked with downward arrow and rising cost symbols, while a shocked worker in overalls sits on top with raised hands. A wrench falls, bar chart with upward trend in background, toolbox nearby. Concept represents rising delivery costs, logistics overload, inflation, supply chain crisis and small business struggle. Ideal for articles on transportation, e-commerce, economy and freight management.
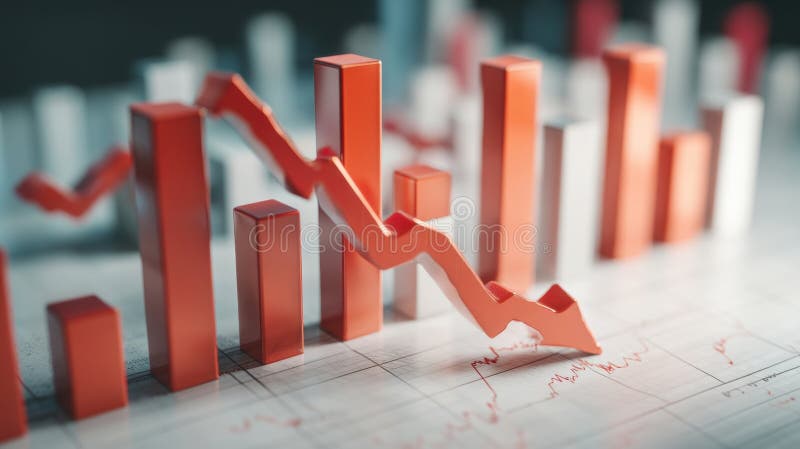
Free with trial This image depicts a 3D rendering of a downward trending graph, generated by AI, showcasing a clear visual representation of market decline or economic downturn. The red bars and arrow emphasize the severity of the fall, suggesting potential financial instability or crisis. Decrease growth arrow illustrations Declining Market Trends. This image depicts a 3D rendering of a downward trending graph, generated by AI, showcasing a clear visual representation of market. This image depicts a 3D rendering of a downward trending graph, generated by AI, showcasing a clear visual representation of market decline or economic downturn. The red bars and arrow emphasize the severity of the fall, suggesting potential financial instability or crisis.
Free with trial Woman holding glasses and a tablet while examining large upward and downward arrows. Ideal for business analysis, decision-making, growth, statistics, market trends, planning, and presentations in. Decrease growth arrow illustrations Professional woman analyzing upward and downward trends alongside graphical arrows and metrics. Woman holding glasses and a tablet while examining large upward. Woman holding glasses and a tablet while examining large upward and downward arrows. Ideal for business analysis, decision-making, growth, statistics, market trends, planning, and presentations in
Free with trial Green bars and an upward arrow signify profit, contrasted by red bars and a downward arrow representing loss on a white background. Decrease growth arrow illustrations Visual comparison of profit and loss using green ascending and red descending bar charts and arrows on a white. Green bars and an upward arrow signify profit. Green bars and an upward arrow signify profit, contrasted by red bars and a downward arrow representing loss on a white background
Free with trial Stock Chart Icon on Red Background. A black stock chart icon with upward and downward trends is displayed on a red background to represent business growth. Decrease growth arrow illustrations Stock Chart Icon on Red Background. A black stock chart icon with upward and downward trends is displayed on a red background to represent business growth
Free with trial Three wooden blocks display a green up arrow, a black percentage sign, and a red down arrow, symbolizing the concept of fluctuating interest rates, economic changes, and financial market trends. Decrease growth arrow illustrations Interest Rate Fluctuation Concept with Up and Down Arrows and Percentage Sign on Wooden Blocks. Three wooden blocks display a green up arrow, a black percentage. Three wooden blocks display a green up arrow, a black percentage sign, and a red down arrow, symbolizing the concept of fluctuating interest rates, economic changes, and financial market trends
Free with trial A vibrant set of twenty-four flat design financial and business icons arranged in a grid on white background, including money bags, coins, piggy bank, bar charts with up and down arrows, calculator, handshake, rocket, calendar, clock, scales, percentage symbol, lightbulb and business report. Perfect for banking, investment, accounting, marketing presentations, websites, apps and infographics illustrating growth, savings, profit, loss and economic concepts. Decrease growth arrow vectors Colorful Financial Business Icons Set Collection. A vibrant set of twenty-four flat design financial and business icons arranged in a grid on white background. A vibrant set of twenty-four flat design financial and business icons arranged in a grid on white background, including money bags, coins, piggy bank, bar charts with up and down arrows, calculator, handshake, rocket, calendar, clock, scales, percentage symbol, lightbulb and business report. Perfect for banking, investment, accounting, marketing presentations, websites, apps and infographics illustrating growth, savings, profit, loss and economic concepts.
Free with trial Vector of a balance scale comparing income and expense for financial management concept. Left pan labeled income holds coins, cash, money bag with upward arrows and growth charts. Right pan labeled expense holds money bags, bills, coins, receipts with shopping cart and rising chart. Clean flat design on white background, ideal for budgeting, accounting, investment, economy articles, business presentations and personal finance education. Decrease growth arrow vectors Income and Expense Balance Scale Financial Concept. Vector of a balance scale comparing income and expense for financial management concept. Left pan labeled. Vector of a balance scale comparing income and expense for financial management concept. Left pan labeled income holds coins, cash, money bag with upward arrows and growth charts. Right pan labeled expense holds money bags, bills, coins, receipts with shopping cart and rising chart. Clean flat design on white background, ideal for budgeting, accounting, investment, economy articles, business presentations and personal finance education.
Free with trial Visualize financial decline with this striking depiction of a report showing falling tax revenue and a clear downward trend, perfect for economic analysis and business strategy content. Decrease growth arrow vectors Business financial report shows declining tax revenue with downward trend arrow. Visualize financial decline with this striking depiction of a report showing. Visualize financial decline with this striking depiction of a report showing falling tax revenue and a clear downward trend, perfect for economic analysis and business strategy content
Free with trial A dynamic collection of eight distinct dollar sign symbols, each uniquely rendered in a bold, grunge, and street art style. Featuring dripping ink effects, distressed textures, and halftone patterns, these black and white icons are integrated with various arrows depicting financial trends. The arrows illustrate upward growth, downward decline, and fluctuating market movements, conveying concepts of profit, loss, and economic change. This versatile set is perfect for modern designs related to finance, investment, business, and urban culture, suitable for web, print, and creative projects. Decrease growth arrow vectors Grunge Dollar Signs with Financial Trend Arrows Set. A dynamic collection of eight distinct dollar sign symbols, each uniquely rendered in a bold, grunge, and. A dynamic collection of eight distinct dollar sign symbols, each uniquely rendered in a bold, grunge, and street art style. Featuring dripping ink effects, distressed textures, and halftone patterns, these black and white icons are integrated with various arrows depicting financial trends. The arrows illustrate upward growth, downward decline, and fluctuating market movements, conveying concepts of profit, loss, and economic change. This versatile set is perfect for modern designs related to finance, investment, business, and urban culture, suitable for web, print, and creative projects.
Free with trial This image was created using Generative AI. Abstract featuring a building, coin, and up down arrows symbolizing real estate market analysis, property investment, and financial growth trends. Decrease growth arrow vectors Real Estate Market Trends Icon with Coin and Arrows. This image was created using Generative AI. Abstract featuring a building, coin, and up down arrows. This image was created using Generative AI. Abstract featuring a building, coin, and up down arrows symbolizing real estate market analysis, property investment, and financial growth trends
Free with trial Isolated zero percent symbol between upward green arrow and downward red arrow icons on a clean white background, perfect for financial or data presentations. Decrease growth arrow illustrations Zero percent increase and decrease arrows icon set. Isolated zero percent symbol between upward green arrow and downward red arrow icons on a clean white. Isolated zero percent symbol between upward green arrow and downward red arrow icons on a clean white background, perfect for financial or data presentations
Free with trial Vector of an orange delivery truck driving through city with large gray cloud overhead filled with financial symbols including red upward and downward arrows, dollar coins, weights, fuel pump, bar charts, growth graphs and maintenance tools. Concept represents rising transportation costs, logistics expenses, inflation, fuel prices and supply chain pressure. Ideal for business, economy, freight, shipping and e-commerce articles about delivery challenges and economic burden. Decrease growth arrow illustrations Delivery Truck Under Rising Logistics Cost Pressure. Vector of an orange delivery truck driving through city with large gray cloud overhead filled with financial. Vector of an orange delivery truck driving through city with large gray cloud overhead filled with financial symbols including red upward and downward arrows, dollar coins, weights, fuel pump, bar charts, growth graphs and maintenance tools. Concept represents rising transportation costs, logistics expenses, inflation, fuel prices and supply chain pressure. Ideal for business, economy, freight, shipping and e-commerce articles about delivery challenges and economic burden.
Free with trial Falling interest rates concept, with stacked coins and a percentage sign alongside a red downward arrow. Decrease growth arrow illustrations Declining interest rates with coins and percentage symbol. Falling interest rates concept, with stacked coins and a percentage sign alongside a red downward. Falling interest rates concept, with stacked coins and a percentage sign alongside a red downward arrow.
Free with trial This minimalist vector illustration features a stylized baby carriage positioned next to a downward-trending line graph. The graph includes a bold red arrow pointing toward several small baby bottle icons, symbolizing a reduction in population growth. The clean lines and flat color palette create a professional and conceptual visual representation of demographic trends. Decrease growth arrow vectors A graphic illustration showing a decline in birth rates with a baby carriage icon. This minimalist vector illustration features a stylized baby carriage. This minimalist vector illustration features a stylized baby carriage positioned next to a downward-trending line graph. The graph includes a bold red arrow pointing toward several small baby bottle icons, symbolizing a reduction in population growth. The clean lines and flat color palette create a professional and conceptual visual representation of demographic trends
Free with trial Colorful flat depicting rising transit expenses with a central savings box labeled Transit Expense receiving coins and credit card payment. Surrounding elements include a fuel pump nozzle with oil drops, upward bar chart and downward arrow, plus icons of bus, train and bicycle with currency symbols. Perfect concept for transportation costs, fuel inflation, public commuting budget, and urban mobility finance articles, presentations, and marketing materials. Decrease growth arrow vectors Rising Transit Expense and Fuel Cost Illustration. Colorful flat depicting rising transit expenses with a central savings box labeled Transit Expense receiving. Colorful flat depicting rising transit expenses with a central savings box labeled Transit Expense receiving coins and credit card payment. Surrounding elements include a fuel pump nozzle with oil drops, upward bar chart and downward arrow, plus icons of bus, train and bicycle with currency symbols. Perfect concept for transportation costs, fuel inflation, public commuting budget, and urban mobility finance articles, presentations, and marketing materials.
Free with trial A black and white circular icon depicting a bar chart with three bars of decreasing height. A diagonal arrow points downwards from the tallest bar to the shortest, indicating a downward trend or decline. The icon is set against a white background. Decrease growth arrow illustrations Black and White Icon of a Downward Trending Bar Chart in a Circle graph decrease. A black and white circular icon depicting a bar chart with three bars of. A black and white circular icon depicting a bar chart with three bars of decreasing height. A diagonal arrow points downwards from the tallest bar to the shortest, indicating a downward trend or decline. The icon is set against a white background
Free with trial A collection of forty colorful flat line icons arranged in a grid on white background featuring financial, logistics and food cost symbols. Includes dollar coins, money bags, banknotes, growth charts, delivery trucks, shipping containers, and restaurant plates with coins. Designed in orange, green and red tones with brown outlines. Perfect for illustrating economy, trade, inflation, transport, business finance, e-commerce and food price concepts in presentations, websites and infographics. Decrease growth arrow vectors Colorful Finance Logistics and Food Cost Icons Set. A collection of forty colorful flat line icons arranged in a grid on white background featuring financial. A collection of forty colorful flat line icons arranged in a grid on white background featuring financial, logistics and food cost symbols. Includes dollar coins, money bags, banknotes, growth charts, delivery trucks, shipping containers, and restaurant plates with coins. Designed in orange, green and red tones with brown outlines. Perfect for illustrating economy, trade, inflation, transport, business finance, e-commerce and food price concepts in presentations, websites and infographics.
Free with trial High-quality 3D render of wooden blocks displaying a green upward arrow, black percentage symbol, and red downward arrow, symbolizing financial trends, interest rates, and economic changes for business and investment concepts. Decrease growth arrow vectors Interest rate trend wooden blocks up down percentage. High-quality 3D render of wooden blocks displaying a green upward arrow, black percentage symbol, and red. High-quality 3D render of wooden blocks displaying a green upward arrow, black percentage symbol, and red downward arrow, symbolizing financial trends, interest rates, and economic changes for business and investment concepts
Free with trial Vector depicting economic crisis and industrial decline with large blue gears breaking apart under pressure from a sharp red downward arrow. Surrounding elements include bar charts, line graphs, cargo ship, fuel pump, dollar symbols and network icons in blue, red and gray on white background. Concept of recession, market crash, manufacturing failure. Ideal for financial reports, business presentations, news articles about economy, trade and industry. Decrease growth arrow vectors Economic Downturn Concept with Falling Market Graphs. Vector depicting economic crisis and industrial decline with large blue gears breaking apart under pressure. Vector depicting economic crisis and industrial decline with large blue gears breaking apart under pressure from a sharp red downward arrow. Surrounding elements include bar charts, line graphs, cargo ship, fuel pump, dollar symbols and network icons in blue, red and gray on white background. Concept of recession, market crash, manufacturing failure. Ideal for financial reports, business presentations, news articles about economy, trade and industry.
Free with trial Stylized graphic featuring a balance scale, security shield, lightning bolts, and a rising bar chart. Suitable for illustrating concepts of risk management, comparison, energy dynamics, or financial analysis in corporate presentations or editorial features. Decrease growth arrow illustrations Iconic Balance Scale With Security And Growth Symbols. Stylized graphic featuring a balance scale, security shield, lightning bolts, and a rising bar chart. Stylized graphic featuring a balance scale, security shield, lightning bolts, and a rising bar chart. Suitable for illustrating concepts of risk management, comparison, energy dynamics, or financial analysis in corporate presentations or editorial features.
Free with trial A collection of flat line finance and business icons arranged in a grid on white background with a large central folder and calculator symbol. Includes symbols for charts, graphs, piggy bank, safe, money, calendar, credit card, warehouse, global trade, and analytics. Designed in muted green, orange, gray and red tones. Perfect concept for accounting, banking, investment, budgeting, reporting, and economic growth. Ideal for websites, presentations, apps, and infographics illustrating financial management. Decrease growth arrow vectors Set of Colorful Financial Business Management Icons. A collection of flat line finance and business icons arranged in a grid on white background with a large. A collection of flat line finance and business icons arranged in a grid on white background with a large central folder and calculator symbol. Includes symbols for charts, graphs, piggy bank, safe, money, calendar, credit card, warehouse, global trade, and analytics. Designed in muted green, orange, gray and red tones. Perfect concept for accounting, banking, investment, budgeting, reporting, and economic growth. Ideal for websites, presentations, apps, and infographics illustrating financial management.
Free with trial Illustration of a policy debate with two speakers at PRO and CON podiums standing on a balanced scale labeled POLICY DEBATE. One side highlights COST SPENDING with dollar signs, upward arrows and factory icons, while the other emphasizes ECONOMIC GROWTH and BENEFITS with city buildings, trains, buses and rising charts. Arrows, gears and graphs symbolize analysis and tradeoffs. Ideal for articles on politics, economics, public policy, elections, infrastructure investment and decision-making. Decrease growth arrow vectors Policy Debate Balancing Cost Versus Economic Benefits. Illustration of a policy debate with two speakers at PRO and CON podiums standing on a balanced scale. Illustration of a policy debate with two speakers at PRO and CON podiums standing on a balanced scale labeled POLICY DEBATE. One side highlights COST SPENDING with dollar signs, upward arrows and factory icons, while the other emphasizes ECONOMIC GROWTH and BENEFITS with city buildings, trains, buses and rising charts. Arrows, gears and graphs symbolize analysis and tradeoffs. Ideal for articles on politics, economics, public policy, elections, infrastructure investment and decision-making.
Free with trial A collection of twenty-four colorful flat design business and marketing icons arranged in a grid on white background. Includes symbols for SWOT analysis, pie charts, sales funnel, SEO, social media, target audience, growth graphs, risk management, customer reviews, global expansion and financial success. Modern style in blue, green, orange and yellow tones. Ideal for presentations, websites, infographics, business reports, digital marketing and strategic planning illustrations. Decrease growth arrow vectors Colorful Business Marketing Strategy Flat Icons Set. A collection of twenty-four colorful flat design business and marketing icons arranged in a grid on white. A collection of twenty-four colorful flat design business and marketing icons arranged in a grid on white background. Includes symbols for SWOT analysis, pie charts, sales funnel, SEO, social media, target audience, growth graphs, risk management, customer reviews, global expansion and financial success. Modern style in blue, green, orange and yellow tones. Ideal for presentations, websites, infographics, business reports, digital marketing and strategic planning illustrations.
Free with trial This image was created using Generative AI. A minimalist financial bar chart icon featuring a downward pointing arrow and a money bag symbol, representing business loss, economic recession, and budget cuts. Decrease growth arrow vectors Financial Bar Chart Showing Declining Profits and Decreasing Revenue Growth Rate. This image was created using Generative AI. A minimalist financial bar chart. This image was created using Generative AI. A minimalist financial bar chart icon featuring a downward pointing arrow and a money bag symbol, representing business loss, economic recession, and budget cuts
Free with trial Three glass arrows pointing directions on light surface. 3D arrows representing business growth and directional trends. Decrease growth arrow illustrations Three glass arrows pointing directions on light surface. 3D arrows representing business growth and directional trends
Free with trial Vector of an unbalanced justice scale comparing allowance versus cost. Left pan holds money bills and coins labeled allowance with downward arrow. Right pan holds diverse business people labeled cost with upward spiral arrow labeled rising costs pointing to transportation icons including bus, car, train and fuel pump. Concept of inflation, commuting expenses, budget imbalance. Ideal for finance, economy, HR and business articles. Decrease growth arrow vectors Unbalanced Scale Showing Rising Costs Versus Allowance. Vector of an unbalanced justice scale comparing allowance versus cost. Left pan holds money bills and. Vector of an unbalanced justice scale comparing allowance versus cost. Left pan holds money bills and coins labeled allowance with downward arrow. Right pan holds diverse business people labeled cost with upward spiral arrow labeled rising costs pointing to transportation icons including bus, car, train and fuel pump. Concept of inflation, commuting expenses, budget imbalance. Ideal for finance, economy, HR and business articles.
Free with trial A bustling market scene with stalls displaying upward and downward financial trends represented by glowing green and red arrows, symbolizing economic activity. Decrease growth arrow illustrations Market stalls with financial growth and decline indicators. A bustling market scene with stalls displaying upward and downward financial trends represented by. A bustling market scene with stalls displaying upward and downward financial trends represented by glowing green and red arrows, symbolizing economic activity
Free with trial Flat depicting the rising cost of commuting in a modern city. Shows a city bus, car, cyclist and stressed businessman surrounded by stacks of coins, fuel pump, currency symbols, percentage signs and downward red arrow. Includes time clocks, upward graphs and urban skyline background. Concept of inflation, transportation expenses, fuel prices and travel time. Ideal for finance, economy, urban planning and lifestyle articles. Decrease growth arrow vectors Rising Cost of Commuting Transportation Illustration. Flat depicting the rising cost of commuting in a modern city. Shows a city bus, car, cyclist and stressed. Flat depicting the rising cost of commuting in a modern city. Shows a city bus, car, cyclist and stressed businessman surrounded by stacks of coins, fuel pump, currency symbols, percentage signs and downward red arrow. Includes time clocks, upward graphs and urban skyline background. Concept of inflation, transportation expenses, fuel prices and travel time. Ideal for finance, economy, urban planning and lifestyle articles.
Free with trial Business finance chart illustrating decline. Red arrow points down, indicating loss or recession. Dollar symbol beside bars. Decrease growth arrow vectors Financial graph showing downward trend with dollar sign. Business finance chart illustrating decline. Red arrow points down, indicating loss or recession. Dollar. Business finance chart illustrating decline. Red arrow points down, indicating loss or recession. Dollar symbol beside bars
Free with trial A dynamic black and white background pattern featuring a collection of hand-drawn financial and economic elements. The design includes various currency symbols like the Dollar, Euro, and Yen, alongside upward and downward arrows, zig-zag lines representing market volatility, and simple bar charts indicating growth or decline. Scattered ink splatters add a grunge, artistic touch to the overall composition. This versatile illustration is ideal for conveying concepts related to global finance, business trends, investment, stock market fluctuations, economic data, and wealth management in a creative and engaging way. Decrease growth arrow vectors Hand Drawn Financial Market Elements Background Pattern. A dynamic black and white background pattern featuring a collection of hand-drawn financial and economic. A dynamic black and white background pattern featuring a collection of hand-drawn financial and economic elements. The design includes various currency symbols like the Dollar, Euro, and Yen, alongside upward and downward arrows, zig-zag lines representing market volatility, and simple bar charts indicating growth or decline. Scattered ink splatters add a grunge, artistic touch to the overall composition. This versatile illustration is ideal for conveying concepts related to global finance, business trends, investment, stock market fluctuations, economic data, and wealth management in a creative and engaging way.
Free with trial Red arrows indicate business growth and decline, along with percentage symbols for financial data and market trends. Decrease growth arrow vectors Up and down arrows with percentage symbol business icon. Red arrows indicate business growth and decline, along with percentage symbols for financial data and. Red arrows indicate business growth and decline, along with percentage symbols for financial data and market trends
Free with trial Four icons depict bar charts with line graphs and arrows. Each icon features three bars in different colors—blue, red, green, and yellow. Arrows indicate upward and downward trends. Two icons use color while the other two are in black and white. These symbols represent financial or data analysis concepts, illustrating fluctuations or comparisons within datasets through simple, clear visual representations. Decrease growth arrow vectors Four Profit Growth and Decline Icons Line and Silhouette Set. Four icons depict bar charts with line graphs and arrows. Each icon features three bars in. Four icons depict bar charts with line graphs and arrows. Each icon features three bars in different colors—blue, red, green, and yellow. Arrows indicate upward and downward trends. Two icons use color while the other two are in black and white. These symbols represent financial or data analysis concepts, illustrating fluctuations or comparisons within datasets through simple, clear visual representations.
Free with trial A collection of financial icons is presented in a 3D render on a white background. A large blue dollar sign is on the left. To its right, a green upward arrow and a red downward arrow intersect, with a purple coin featuring a white dollar sign in the center. On the far right, a white smartphone displays a yellow coin with a white dollar sign on its screen. Decrease growth arrow illustrations Financial Icons: Dollar Sign, Up and Down Arrows, Coin, and Smartphone on White Background. A collection of financial icons is presented in a 3D render on a. A collection of financial icons is presented in a 3D render on a white background. A large blue dollar sign is on the left. To its right, a green upward arrow and a red downward arrow intersect, with a purple coin featuring a white dollar sign in the center. On the far right, a white smartphone displays a yellow coin with a white dollar sign on its screen
Free with trial Flat depicting energy market volatility with oil barrels, gasoline pumps, electric vehicle charging stations, gas pipelines, power transmission towers, fuel tanker trucks, money bags, and fluctuating arrow charts. Orange, black and gray icons on white background symbolize price instability, supply crisis, inflation and global demand. Ideal for financial reports, news articles, presentations and educational materials about oil, gas, electricity and economic trends. Decrease growth arrow vectors Energy Market Volatility with Oil Gas Electricity Icons. Flat depicting energy market volatility with oil barrels, gasoline pumps, electric vehicle charging. Flat depicting energy market volatility with oil barrels, gasoline pumps, electric vehicle charging stations, gas pipelines, power transmission towers, fuel tanker trucks, money bags, and fluctuating arrow charts. Orange, black and gray icons on white background symbolize price instability, supply crisis, inflation and global demand. Ideal for financial reports, news articles, presentations and educational materials about oil, gas, electricity and economic trends.
Free with trial Colorful infographic showing how inflation erodes business profits. A red flame monster labeled inflation devours blocks representing operational costs, while factory workers handle fuel and labor expenses. Blue bar charts labeled profits rise then crumble, with a red downward arrow indicating profit erosion and a worried worker. Ideal for articles on economics, manufacturing challenges, rising costs, financial crisis, and business strategy presentations. Decrease growth arrow vectors Inflation Causing Profit Erosion in Industrial Business. Colorful infographic showing how inflation erodes business profits. A red flame monster labeled. Colorful infographic showing how inflation erodes business profits. A red flame monster labeled inflation devours blocks representing operational costs, while factory workers handle fuel and labor expenses. Blue bar charts labeled profits rise then crumble, with a red downward arrow indicating profit erosion and a worried worker. Ideal for articles on economics, manufacturing challenges, rising costs, financial crisis, and business strategy presentations.
Free with trial Green up arrow and red down arrow pointing opposite directions. 3D arrows in green and red showing opposite directions for growth and decline concepts. Decrease growth arrow illustrations Green up arrow and red down arrow pointing opposite directions. 3D arrows in green and red showing opposite directions for growth and decline concepts
Free with trial Red percentage symbols and arrows indicate financial growth and decline. Abstract concept for sales, discounts, or market fluctuations. Decrease growth arrow vectors Red percentage signs and arrows pointing up and down upwards. Red percentage symbols and arrows indicate financial growth and decline. Abstract concept for sales. Red percentage symbols and arrows indicate financial growth and decline. Abstract concept for sales, discounts, or market fluctuations
Free with trial A flat graphic design featuring two vertical double-headed arrows side by side. The left arrow is colored blue, and the right arrow is colored red. Both arrows feature triangular heads at both the top and bottom, indicating bidirectional movement, vertical scaling, or opposite directions. The design is clean, minimalist, and isolated on a white background, making it suitable for user interface elements, infographics, or conceptual business presentations regarding growth, decline, or comparative analysis. Decrease growth arrow illustrations Blue and Red Vertical Double Headed Arrows Pointing Up and Down. A flat graphic design featuring two vertical double-headed arrows side by side. The left arrow. A flat graphic design featuring two vertical double-headed arrows side by side. The left arrow is colored blue, and the right arrow is colored red. Both arrows feature triangular heads at both the top and bottom, indicating bidirectional movement, vertical scaling, or opposite directions. The design is clean, minimalist, and isolated on a white background, making it suitable for user interface elements, infographics, or conceptual business presentations regarding growth, decline, or comparative analysis.
Free with trial Flat showing the economic impact of rising fuel prices on logistics and retail. Features gas pump icons, upward cost arrows, a large red downward arrow, delivery truck, cargo ship, shopping cart, cash register, coins and percentage symbols. Concept visualizes supply chain costs, inflation, and declining retail profit in euros. Isolated on white background, ideal for business, finance, energy crisis, and economic articles, presentations, and reports. Decrease growth arrow vectors Rising Fuel Costs Impacting Retail Profit Illustration. Flat showing the economic impact of rising fuel prices on logistics and retail. Features gas pump icons. Flat showing the economic impact of rising fuel prices on logistics and retail. Features gas pump icons, upward cost arrows, a large red downward arrow, delivery truck, cargo ship, shopping cart, cash register, coins and percentage symbols. Concept visualizes supply chain costs, inflation, and declining retail profit in euros. Isolated on white background, ideal for business, finance, energy crisis, and economic articles, presentations, and reports.
 Sign in