Free with trial Wooden blocks spelling COST sit atop decreasing stacks of coins with downward arrows. Decrease growth arrow illustrations Wooden Blocks Spell COST Above Stacks of Coins with Downward Arrows cost reduction. Wooden blocks spelling COST sit atop decreasing stacks of coins with downward. Wooden blocks spelling COST sit atop decreasing stacks of coins with downward arrows
Free with trial Wooden blocks spelling COST sit atop decreasing stacks of coins with downward arrows. Decrease growth arrow illustrations Wooden Blocks Spell COST Above Stacks of Coins with Downward Arrows cost reduction. Wooden blocks spelling COST sit atop decreasing stacks of coins with downward. Wooden blocks spelling COST sit atop decreasing stacks of coins with downward arrows
Free with trial Wooden blocks spelling COST sit atop decreasing stacks of coins with downward arrows. Decrease growth arrow illustrations Wooden Blocks Spell COST Above Stacks of Coins with Downward Arrows cost reduction. Wooden blocks spelling COST sit atop decreasing stacks of coins with downward. Wooden blocks spelling COST sit atop decreasing stacks of coins with downward arrows
Free with trial Wooden blocks spelling COST sit atop decreasing stacks of coins with downward arrows. Decrease growth arrow illustrations Wooden Blocks Spell COST Above Stacks of Coins with Downward Arrows cost reduction. Wooden blocks spelling COST sit atop decreasing stacks of coins with downward. Wooden blocks spelling COST sit atop decreasing stacks of coins with downward arrows
Free with trial A clean and modern abstract logo featuring three overlapping blue chevrons pointing downwards. The chevrons are layered with subtle shadows, creating a sense of depth and dimension. The design is minimalist and geometric, rendered on a white background. This versatile graphic is ideal for technology companies, financial services, data analysis, or any business emphasizing progress, direction, or efficiency. Decrease growth arrow illustrations Abstract Blue Chevron Layers Logo. A clean and modern abstract logo featuring three overlapping blue chevrons pointing downwards. The chevrons are layered with. A clean and modern abstract logo featuring three overlapping blue chevrons pointing downwards. The chevrons are layered with subtle shadows, creating a sense of depth and dimension. The design is minimalist and geometric, rendered on a white background. This versatile graphic is ideal for technology companies, financial services, data analysis, or any business emphasizing progress, direction, or efficiency.
Free with trial Hand-drawn graph of business progress, with upward and downward arrows. AI generated. Decrease growth arrow vectors Hand-drawn graph of business progress, with upward and downward arrows. AI generated
Free with trial Declining bar graph illustration, business, financial, and economic data. AI generated. Decrease growth arrow vectors Declining bar graph illustration, business, financial, and economic data. AI generated
Free with trial The image depicts a financial graph with a downward trend, represented by red and blue neon lines against a dark, textured concrete wall and floor. the graph starts high on the left and sharply declines towards the lower right, ending with a prominent red arrow pointing downwards. a spotlight from above illuminates the graph, casting shadows and highlighting the rough texture of the concrete, creating a dramatic and somber mood. the overall composition conveys a sense of economic downturn or financial loss. Decrease growth arrow illustrations Descending financial graph on dark concrete wall. The image depicts a financial graph with a downward trend, represented by red and blue neon lines against a. the image depicts a financial graph with a downward trend, represented by red and blue neon lines against a dark, textured concrete wall and floor. the graph starts high on the left and sharply declines towards the lower right, ending with a prominent red arrow pointing downwards. a spotlight from above illuminates the graph, casting shadows and highlighting the rough texture of the concrete, creating a dramatic and somber mood. the overall composition conveys a sense of economic downturn or financial loss.
Free with trial Up and Down Arrows Inside Target Graphic Illustration Representing Directional Motion and Strategy. AI generated. Decrease growth arrow vectors Up and Down Arrows Inside Target Graphic Illustration Representing Directional Motion and Strategy. AI generated
Free with trial Flat depicting rising fuel prices and energy crisis concept with central gas pump nozzle, wallet with money, euro and dollar coins, factory emissions, cars, oil pipeline, electricity pylons, house, shopping basket, price tags, upward and downward arrows, bar charts, pie charts and broken supply chains. Orange, brown and black color scheme. Ideal for articles about inflation, gasoline costs, economy, cost of living and power industry. Decrease growth arrow vectors Rising Fuel Prices and Energy Cost Inflation Illustration. Flat depicting rising fuel prices and energy crisis concept with central gas pump nozzle, wallet with. Flat depicting rising fuel prices and energy crisis concept with central gas pump nozzle, wallet with money, euro and dollar coins, factory emissions, cars, oil pipeline, electricity pylons, house, shopping basket, price tags, upward and downward arrows, bar charts, pie charts and broken supply chains. Orange, brown and black color scheme. Ideal for articles about inflation, gasoline costs, economy, cost of living and power industry.
Free with trial A man in a suit holds a phone and a stylus, interacting with a projected bar graph showing a downward trend in profits and an upward trend in costs. Decrease growth arrow illustrations Businessman analyzes declining profits and rising costs using digital graph on a dark background. A man in a suit holds a phone and a stylus, interacting with a. A man in a suit holds a phone and a stylus, interacting with a projected bar graph showing a downward trend in profits and an upward trend in costs
Free with trial A stark, neon yellow line graph depicts a sharp downward trend on a dark, grid-lined background, symbolizing economic recession. Decrease growth arrow illustrations Neon yellow downward trending graph illustrating financial decline against a dark grid background. A stark, neon yellow line graph depicts a sharp downward trend. A stark, neon yellow line graph depicts a sharp downward trend on a dark, grid-lined background, symbolizing economic recession
Free with trial Flat depicting rising public transportation costs and declining service quality. Shows crowded bus and modern train with passengers, upward trending bar graphs and arrows, money, coins, fuel pump prices, broken railway tracks and roads, ticket icons, service cut symbols and maintenance gears. Concept of inflation, fare hike, budget crisis, infrastructure failure. Ideal for articles on economy, transit policy, urban commuting and financial planning. Decrease growth arrow vectors Rising Public Transport Costs and Service Cuts Illustration. Flat depicting rising public transportation costs and declining service quality. Shows crowded bus. Flat depicting rising public transportation costs and declining service quality. Shows crowded bus and modern train with passengers, upward trending bar graphs and arrows, money, coins, fuel pump prices, broken railway tracks and roads, ticket icons, service cut symbols and maintenance gears. Concept of inflation, fare hike, budget crisis, infrastructure failure. Ideal for articles on economy, transit policy, urban commuting and financial planning.
Free with trial A person's open palm supports a glowing neon graph illustrating the relationship between cost and quality with upward and downward arrows. Decrease growth arrow illustrations Hand holding glowing cost quality graph palm open. A person's open palm supports a glowing neon graph illustrating the relationship between cost and quality with. A person's open palm supports a glowing neon graph illustrating the relationship between cost and quality with upward and downward arrows
Free with trial A collection of twenty-four minimalist black line icons related to money and finance on a white background, including cash stacks, dollar bills, money bag, wallet, piggy bank, bank building, invoice, ATM, charts and arrows. Clean outline style symbols represent banking, saving, investment, payment, security and cash flow concepts. Ideal for financial presentations, websites, apps, infographics and business marketing materials requiring simple economic illustrations. Decrease growth arrow vectors Set of Money and Finance Line Icons. A collection of twenty-four minimalist black line icons related to money and finance on a white background, including cash. A collection of twenty-four minimalist black line icons related to money and finance on a white background, including cash stacks, dollar bills, money bag, wallet, piggy bank, bank building, invoice, ATM, charts and arrows. Clean outline style symbols represent banking, saving, investment, payment, security and cash flow concepts. Ideal for financial presentations, websites, apps, infographics and business marketing materials requiring simple economic illustrations.
Free with trial Green chart visualizing a downward trend, indicating a decline in values ,Generative ai. Decrease growth arrow illustrations Declining values, green chart depicts a downward trend and financial analysis green. Green chart visualizing a downward trend, indicating a decline in values. Green chart visualizing a downward trend, indicating a decline in values ,Generative ai
Free with trial A businessman in a suit is drawing a downward sloping graph illustrating the decline of profits against the rise of costs the image represents financial challenges business downturns and the need for cost reduction strategies for improved profitability. Decrease growth arrow illustrations Business person drawing a graph representing financial decline and reduced profits due to cost. A businessman in a suit is drawing a downward sloping graph. A businessman in a suit is drawing a downward sloping graph illustrating the decline of profits against the rise of costs the image represents financial challenges business downturns and the need for cost reduction strategies for improved profitability
Free with trial A set of black glyph icons representing business, finance, and economic concepts on a white background. Decrease growth arrow vectors Collection of black business and finance icons on a white background design. A set of black glyph icons representing business, finance, and economic concepts on. a set of black glyph icons representing business, finance, and economic concepts on a white background
Free with trial Wooden blocks spelling TAX with the last block showing up and down arrows, illustrating the concept of tax changes, fluctuations, and economic uncertainty. The image conveys the dynamic nature of taxation and its potential impact. Decrease growth arrow illustrations Tax concept wooden blocks illustrating changes fluctuations and uncertainty. Wooden blocks spelling TAX with the last block showing up and down arrows. Wooden blocks spelling TAX with the last block showing up and down arrows, illustrating the concept of tax changes, fluctuations, and economic uncertainty. The image conveys the dynamic nature of taxation and its potential impact
Free with trial Red downward and green upward percentage-marked arrows. Three-dimensional visual graphs for discounts, interest rates, stock market changes, and economic data. Decrease growth arrow illustrations Red downward and green upward percentage-marked arrows. Three-dimensional visual graphs for discounts, interest rates, stock. Market changes, and economic data
Free with trial Up Down Pointer Icon Scroll Gesture Point Pointing Page Upward Downward Navigation Direction Swipe North South. Sign Symbol Graphic Illustration Path. Decrease growth arrow vectors Up Down Pointer Icon Scroll Gesture Point Pointing Page Upward Downward Navigation Direction Swipe North South. Sign Symbol Graphic Illustration Path
Free with trial Fuel Pump Nozzle With Glowing Gasoline Drop and Market Chart. AI generated. Decrease growth arrow illustrations Fuel Pump Nozzle With Glowing Gasoline Drop and Market Chart. AI generated
Free with trial A hand interacting with a graph showing quality increasing and cost decreasing. it represents business success, improvement, and strategic financial planning. Decrease growth arrow illustrations Hand interacting with a quality and cost graph showing increasing quality and decreasing cost. A hand interacting with a graph showing quality increasing and. a hand interacting with a graph showing quality increasing and cost decreasing. it represents business success, improvement, and strategic financial planning.
Free with trial A bold outline illustration of a computer screen displaying a downward trending line, representing financial loss or negative growth. Decrease growth arrow vectors Bold Outline Computer Screen with Falling Trend Line Icon Illustration. A bold outline illustration of a computer screen displaying a downward trending line. A bold outline illustration of a computer screen displaying a downward trending line, representing financial loss or negative growth.
Free with trial Illustration depicting india's economy facing a downturn, with a graph showing a downward trend. This image represents a financial crisis, stock market crash, or economic recession in india. 200. Decrease growth arrow illustrations India economy crisis financial market stock market crash recession economic downturn graph chart down 100. Illustration depicting india's economy facing a. illustration depicting india's economy facing a downturn, with a graph showing a downward trend. This image represents a financial crisis, stock market crash, or economic recession in india. 200
Free with trial Abstract graphic showing currency symbols and arrows to visually represent financial market changes and exchange rate fluctuations Ideal for illustrating finance topics. Decrease growth arrow illustrations Currency Exchange Rate Fluctuations Abstract Graphic. Abstract graphic showing currency symbols and arrows to visually represent financial market changes and. Abstract graphic showing currency symbols and arrows to visually represent financial market changes and exchange rate fluctuations Ideal for illustrating finance topics
Free with trial This image features a set of up and down arrows in three color variations (black, red, and a gradient from red to blue). Decrease growth arrow vectors Up and Down Arrows in Black, Red, and Blue. This image features a set of up and down arrows in three color variations (black, red, and a gradient from red to. This image features a set of up and down arrows in three color variations (black, red, and a gradient from red to blue).
Free with trial Computer with Candlestick Chart vector Crypto Investment concept icon or design element. Decrease growth arrow vectors Computer with Candlestick Chart vector Crypto Investment icon or design element. Computer with Candlestick Chart vector Crypto Investment concept icon or design. Computer with Candlestick Chart vector Crypto Investment concept icon or design element
Free with trial Financial Downward Trend Bar Chart Icon. A flat icon showing a blue bar chart with a downward trend arrow representing financial decline or economic loss. Decrease growth arrow vectors Financial Downward Trend Bar Chart Icon. A flat icon showing a blue bar chart with a downward trend arrow representing financial decline or economic loss
Free with trial Cubes form the German expression 'Leitzins 0. 25 percent' (key interest rate 0. 25 percent). Symbol for the increase or decrease of the key interest rate by the European central bank. Decrease growth arrow illustrations Cubes form the German expression \'Leitzins 0.25 percent\' (key interest rate 0.25 percent). Cubes form the German expression 'Leitzins 0.25 percent' (key. Cubes form the German expression 'Leitzins 0.25 percent' (key interest rate 0.25 percent). Symbol for the increase or decrease of the key interest rate by the European central bank.
Free with trial Neon percentage signs around umbrella. Glowing neon percentage signs surround colorful umbrella. Generative AI. Decrease growth arrow illustrations Neon percentage signs around umbrella. Glowing neon percentage signs surround colorful umbrella. Generative AI
Free with trial Report line icon. Continuous line with share plane. Column graph, pie chart sign. Market analytics symbol. 3d heart in speech bubble. Report single line ribbon. Loop curve pattern. Vector. Decrease growth arrow vectors Report line icon. Column graph, pie chart sign. Continuous line with plane. Vector. Report line icon. Continuous line with share plane. Column graph, pie chart. Report line icon. Continuous line with share plane. Column graph, pie chart sign. Market analytics symbol. 3d heart in speech bubble. Report single line ribbon. Loop curve pattern. Vector
Free with trial Charts and Diagrams line icons. Interest rate, AI generate, Inflation icons. Report, 3D Chart, Block diagram and Dot Plot graph linear icons. Trend, Pyramid and Pie chart report symbols. Vector. Decrease growth arrow vectors Charts and Diagrams line icons. Set of 3D Chart, Block diagram and Dot Plot graph icons. App line icons. Vector. Charts and Diagrams line icons. Interest rate. Charts and Diagrams line icons. Interest rate, AI generate, Inflation icons. Report, 3D Chart, Block diagram and Dot Plot graph linear icons. Trend, Pyramid and Pie chart report symbols. Vector
Free with trial This minimalist vector illustration depicts a financial chart with a prominent red arrow pointing downwards, symbolizing a significant decline in value or performance. The graphic features clean lines and a simple color palette, emphasizing the negative trend against a neutral backdrop. Below the chart, numerical data points are displayed in a rectangular box, highlighting the extent of the loss. Decrease growth arrow vectors A red line graph showing a sharp downward trend on a white background. This minimalist vector illustration depicts a financial chart with a prominent red arrow. This minimalist vector illustration depicts a financial chart with a prominent red arrow pointing downwards, symbolizing a significant decline in value or performance. The graphic features clean lines and a simple color palette, emphasizing the negative trend against a neutral backdrop. Below the chart, numerical data points are displayed in a rectangular box, highlighting the extent of the loss.
Free with trial 3d rendering of the word "SHRINKFLATION. " It this tactic used by manufacturers to increase prices without explicitly raising them on the label. Decrease growth arrow illustrations 3d rendering of the word \'SHRINKFLATION.\'. 3d rendering of the word 'SHRINKFLATION.' It this tactic used by manufacturers to increase prices without explicitly. 3d rendering of the word "SHRINKFLATION." It this tactic used by manufacturers to increase prices without explicitly raising them on the label
Free with trial Woman seated while pointing upward beside a small house and upward-downward arrows. Ideal for real estate, trends, investment, housing market, decision-making, planning, simplified data, simple flat. Decrease growth arrow illustrations Woman Pointing Upward with House and Directional Arrows Indicating Real Estate Trends. Woman seated while pointing upward beside a small house and upward. Woman seated while pointing upward beside a small house and upward-downward arrows. Ideal for real estate, trends, investment, housing market, decision-making, planning, simplified data, simple flat
Free with trial White jigsaw puzzle with missing piece showing the word 'DEPRECIATION' on a black leather textured background. Decrease growth arrow illustrations White jigsaw puzzle with missing piece showing the word \'DEPRECIATION\'. White jigsaw puzzle with missing piece showing the word 'DEPRECIATION' on a black. White jigsaw puzzle with missing piece showing the word 'DEPRECIATION' on a black leather textured background.
Free with trial Doodle portrait woman with direction arrows pointing up and down in circle. AI generated. Decrease growth arrow vectors Doodle portrait woman with direction arrows pointing up and down in circle. AI generated
Free with trial A stylized stock market chart showing a downward trend with blue and orange bars on white. Generative AI. Decrease growth arrow illustrations A stylized stock market chart showing a downward trend with blue and orange bars on white. Generative AI
Free with trial A colorful flat icon set illustrating inflation, rising prices and economic instability, arranged in a grid on white background. Includes symbols like shopping cart, gas pump, housing cost, calculator, piggy bank, thermometer, charts, graphs, cargo ship, trucks, warehouse, robot, satellite and global map. Red and blue arrows show increase, crash and volatility. Ideal for financial articles, business presentations, economic reports, marketing materials about budgeting, cost of living, recession and market trends. Decrease growth arrow vectors Set of inflation and rising cost icons. A colorful flat icon set illustrating inflation, rising prices and economic instability, arranged in a grid on white. A colorful flat icon set illustrating inflation, rising prices and economic instability, arranged in a grid on white background. Includes symbols like shopping cart, gas pump, housing cost, calculator, piggy bank, thermometer, charts, graphs, cargo ship, trucks, warehouse, robot, satellite and global map. Red and blue arrows show increase, crash and volatility. Ideal for financial articles, business presentations, economic reports, marketing materials about budgeting, cost of living, recession and market trends.
Free with trial Diagram chart line icon. Neumorphic, Flat shadow, 3d buttons. Column graph sign. Market analytics symbol. Line diagram chart icon. Social media icons. Vector. Decrease growth arrow vectors Diagram chart line icon. Column graph sign. Neumorphic buttons. Vector. Diagram chart line icon. Neumorphic, Flat shadow, 3d buttons. Column graph sign. Market. Diagram chart line icon. Neumorphic, Flat shadow, 3d buttons. Column graph sign. Market analytics symbol. Line diagram chart icon. Social media icons. Vector
Free with trial A collection of hand-drawn arrows in various styles and directions. Includes straight, curved, spiral, zigzag, and looping arrows in black ink on a white background. content. Decrease growth arrow vectors Hand drawn arrow collection set AI generated. A collection of hand-drawn arrows in various styles and directions. Includes straight, curved, spiral, zigzag, and. A collection of hand-drawn arrows in various styles and directions. Includes straight, curved, spiral, zigzag, and looping arrows in black ink on a white background. content.
Free with trial A collection of twenty-four minimalist black line icons featuring glass savings jars with various financial symbols including coins, arrows, targets, locks, wallets, charts, shields, and clocks arranged in a clean grid on white background. Perfect for illustrating saving, budgeting, investing, banking, and financial planning concepts in presentations, websites, apps, infographics, and educational materials about personal finance and money management. Decrease growth arrow vectors Set of Savings Jar Line Icons Collection. A collection of twenty-four minimalist black line icons featuring glass savings jars with various financial symbols. A collection of twenty-four minimalist black line icons featuring glass savings jars with various financial symbols including coins, arrows, targets, locks, wallets, charts, shields, and clocks arranged in a clean grid on white background. Perfect for illustrating saving, budgeting, investing, banking, and financial planning concepts in presentations, websites, apps, infographics, and educational materials about personal finance and money management.
Free with trial Collection of twenty-four colorful line icons related to oil industry economics and fuel market trading on white background. Includes symbols of barrels, gas pumps, tanker trucks, cargo ships, pipelines, money bags, dollar coins, charts, arrows, graphs, handshake deals and global trade. Flat outline style in orange, brown and black colors. Ideal for financial reports, energy business presentations, infographics, websites and articles about petroleum prices, investment and logistics. Decrease growth arrow vectors Oil Price Market Icons Set Illustration. Collection of twenty-four colorful line icons related to oil industry economics and fuel market trading on white. Collection of twenty-four colorful line icons related to oil industry economics and fuel market trading on white background. Includes symbols of barrels, gas pumps, tanker trucks, cargo ships, pipelines, money bags, dollar coins, charts, arrows, graphs, handshake deals and global trade. Flat outline style in orange, brown and black colors. Ideal for financial reports, energy business presentations, infographics, websites and articles about petroleum prices, investment and logistics.
Free with trial Financial success and loss, currency value change, stock market fluctuation, investment profit risk, economic business analysis. Decrease growth arrow vectors Gold coins with dollar sign showing market trend up and down arrows. Financial success and loss, currency value change, stock market fluctuation, investment. Financial success and loss, currency value change, stock market fluctuation, investment profit risk, economic business analysis
Free with trial Hands supporting percentage symbols, graphically representing the concept of increasing or decreasing financial indicators like interest rates and profit. Decrease growth arrow vectors Hands holding percentage symbols in front of a graph symbolizing fluctuations in financial indicators such as interest rates and. Hands supporting percentage. Hands supporting percentage symbols, graphically representing the concept of increasing or decreasing financial indicators like interest rates and profit
Free with trial Market Data Analysis with Candlestick Chart vector concept colored icon or design element. Decrease growth arrow vectors Market Data Analysis with Candlestick Chart vector colored icon or design element. Market Data Analysis with Candlestick Chart vector concept colored icon or. Market Data Analysis with Candlestick Chart vector concept colored icon or design element
Free with trial Two different graphs with a downward trend. One is red and the other is white. Decrease growth arrow illustrations Two different graphs with a downward trend. One is red and the other is white
Free with trial Symbolic up and down arrows displayed on a green circular button suggest transfer or movement between options Use for website design or application interface. Decrease growth arrow illustrations Up and Down Arrows on Green Circle Button Illustration. Symbolic up and down arrows displayed on a green circular button suggest transfer or movement between. Symbolic up and down arrows displayed on a green circular button suggest transfer or movement between options Use for website design or application interface
Free with trial Business data analysis and statistics icons. Collection of business data analysis icons including graphs, charts, and a stopwatch on white background. Decrease growth arrow illustrations Business data analysis and statistics icons. Collection of business data analysis icons including graphs, charts, and a stopwatch on white background
Free with trial Image is a conceptual photograph featuring a close-up view of four wooden blocks arranged in a row, each with a letter printed in black, spelling out the word 'COST'. On top of each block, there is a stack of coins, with the number of coins decreasing from left to right. Above the blocks, a white zigzag arrow points downward, symbolizing a reduction or decrease. The background is blurred, with a. Decrease growth arrow illustrations Cost reduction concept with coins and blocks. Image is a conceptual photograph featuring a close-up view of four wooden blocks arranged in a row, each with a. Image is a conceptual photograph featuring a close-up view of four wooden blocks arranged in a row, each with a letter printed in black, spelling out the word 'COST'. On top of each block, there is a stack of coins, with the number of coins decreasing from left to right. Above the blocks, a white zigzag arrow points downward, symbolizing a reduction or decrease. The background is blurred, with a
Free with trial A comprehensive collection of colorful flat line icons illustrating motorcycle fuel expenses, savings, and budgeting concepts on a white background. Includes symbols of motorbikes, gas pumps, price charts, wallets, piggy banks, oil barrels, world map, and riders. Perfect for articles, presentations, apps, and marketing materials about transportation costs, fuel economy, energy prices, delivery business, and personal finance management for motorcyclists. Decrease growth arrow vectors Motorcycle Fuel Cost and Savings Icon Set. A comprehensive collection of colorful flat line icons illustrating motorcycle fuel expenses, savings, and budgeting. A comprehensive collection of colorful flat line icons illustrating motorcycle fuel expenses, savings, and budgeting concepts on a white background. Includes symbols of motorbikes, gas pumps, price charts, wallets, piggy banks, oil barrels, world map, and riders. Perfect for articles, presentations, apps, and marketing materials about transportation costs, fuel economy, energy prices, delivery business, and personal finance management for motorcyclists.
Free with trial Set of 28 thin line icons related to financial reporting, accounting and data analysis on white background. Includes bar charts, line graphs, pie charts, tax documents, calculators, money bags, magnifying glass, folders, checkmarks, printers and cloud symbols. Minimalist outline style in dark blue. Ideal for business presentations, finance websites, infographics, mobile apps and annual report design elements. Decrease growth arrow vectors Financial Report Line Icons Set Collection. Set of 28 thin line icons related to financial reporting, accounting and data analysis on white background. Includes. Set of 28 thin line icons related to financial reporting, accounting and data analysis on white background. Includes bar charts, line graphs, pie charts, tax documents, calculators, money bags, magnifying glass, folders, checkmarks, printers and cloud symbols. Minimalist outline style in dark blue. Ideal for business presentations, finance websites, infographics, mobile apps and annual report design elements.
Free with trial A collection of 28 colorful flat outline icons on white background illustrating inflation, rising prices and cost of living crisis. Includes symbols like wallet, piggy bank, money bag, coins, dollar, price tag, shopping cart, receipt, grocery, housing, gas pump, electricity bill, water tap, bank, calculator, graphs with up and down arrows. Perfect for financial articles, economic reports, business presentations, educational materials and infographics about economy. Decrease growth arrow vectors Inflation Economy Icons Set Rising Prices. A collection of 28 colorful flat outline icons on white background illustrating inflation, rising prices and cost of. A collection of 28 colorful flat outline icons on white background illustrating inflation, rising prices and cost of living crisis. Includes symbols like wallet, piggy bank, money bag, coins, dollar, price tag, shopping cart, receipt, grocery, housing, gas pump, electricity bill, water tap, bank, calculator, graphs with up and down arrows. Perfect for financial articles, economic reports, business presentations, educational materials and infographics about economy.
Free with trial Up and down percentage change blocks. Three wooden blocks showing upward, stable, and downward percentage change arrows. Decrease growth arrow illustrations Up and down percentage change blocks. Three wooden blocks showing upward, stable, and downward percentage change arrows
Free with trial Illustration of a business activities,. Decrease growth arrow vectors Illustration of a business activities,. Illustration of a business activities
Free with trial Illustration of a business activities,. Decrease growth arrow vectors Illustration of a business activities,. Illustration of a business activities
Free with trial Illustration of a business activities,. Decrease growth arrow vectors Illustration of a business activities,. Illustration of a business activities
Free with trial A comprehensive collection of flat design icons focused on data analysis, statistics, and business metrics. The set features a variety of colorful pictograms including bar charts, line graphs, scatter plots, and neural networks. Additional symbols represent gears for processing, compasses for navigation, and crystal balls for forecasting. These are ideal for use in dashboards, financial reports, marketing presentations, and web design, providing clear visual representations of data trends and statistical concepts. Decrease growth arrow vectors Colorful Data Analysis and Statistics Icon Set. A comprehensive collection of flat design icons focused on data analysis, statistics, and business metrics. The. A comprehensive collection of flat design icons focused on data analysis, statistics, and business metrics. The set features a variety of colorful pictograms including bar charts, line graphs, scatter plots, and neural networks. Additional symbols represent gears for processing, compasses for navigation, and crystal balls for forecasting. These are ideal for use in dashboards, financial reports, marketing presentations, and web design, providing clear visual representations of data trends and statistical concepts.
Free with trial Four blue square icons with arrows indicating percentage changes, two with upward green arrows and two with downward red arrows. Decrease growth arrow illustrations Set of four icons showing percentage changes. Four blue square icons with arrows indicating percentage changes, two with upward green arrows and two with. Four blue square icons with arrows indicating percentage changes, two with upward green arrows and two with downward red arrows
Free with trial This 3D illustration depicts a financial report represented by a document with a bar chart and a line graph. The bar chart shows alternating red and blue bars, while a blue line graph with an upward arrow indicates a positive trend. A yellow and purple magnifying glass is positioned over the chart, suggesting analysis and scrutiny. The artwork is set against a subtle light purple background. Decrease growth arrow illustrations 3D illustration of a financial report with a magnifying glass and bar chart on a light purple background. This 3D illustration depicts a financial report. This 3D illustration depicts a financial report represented by a document with a bar chart and a line graph. The bar chart shows alternating red and blue bars, while a blue line graph with an upward arrow indicates a positive trend. A yellow and purple magnifying glass is positioned over the chart, suggesting analysis and scrutiny. The artwork is set against a subtle light purple background
Free with trial A collection of sixteen flat line icons arranged in a grid showing wooden crates filled with vegetables like carrots, tomatoes, broccoli, apples and lettuce combined with price tags, dollar coins, cash, percentage symbols and up and down arrows. Illustrates concepts of food pricing, inflation, grocery cost, market comparison and farm economy. Ideal for articles, presentations and infographics about agriculture, retail, budgeting and food inflation. Decrease growth arrow vectors Vegetable Crate Price Icons Set Illustration. A collection of sixteen flat line icons arranged in a grid showing wooden crates filled with vegetables like. A collection of sixteen flat line icons arranged in a grid showing wooden crates filled with vegetables like carrots, tomatoes, broccoli, apples and lettuce combined with price tags, dollar coins, cash, percentage symbols and up and down arrows. Illustrates concepts of food pricing, inflation, grocery cost, market comparison and farm economy. Ideal for articles, presentations and infographics about agriculture, retail, budgeting and food inflation.
Free with trial A set of hand-drawn sketch arrows in various styles including loops, curves, zigzags, and dashed lines. Black vector icons on a white background. content. Decrease growth arrow vectors Hand drawn sketch arrow collection AI generated. A set of hand-drawn sketch arrows in various styles including loops, curves, zigzags, and dashed lines. Black. A set of hand-drawn sketch arrows in various styles including loops, curves, zigzags, and dashed lines. Black vector icons on a white background. content.
Free with trial A set of hand drawn black and white graphs and charts for business analysis. Decrease growth arrow illustrations A collection of six hand drawn graphs and charts in black and white .ai generate. A set of hand drawn black and white graphs and charts for business analysis. a set of hand drawn black and white graphs and charts for business analysis.
Free with trial Diagram chart line icon. Halftone dotted pattern. Gradient icon with grain shadow. Column 3d graph sign. Market analytics symbol. Line 3d chart icon. Various designs. Vector. Decrease growth arrow vectors Diagram chart line icon. Column 3d graph sign. Halftone dotted pattern. Vector. Diagram chart line icon. Halftone dotted pattern. Gradient icon with grain shadow. Diagram chart line icon. Halftone dotted pattern. Gradient icon with grain shadow. Column 3d graph sign. Market analytics symbol. Line 3d chart icon. Various designs. Vector
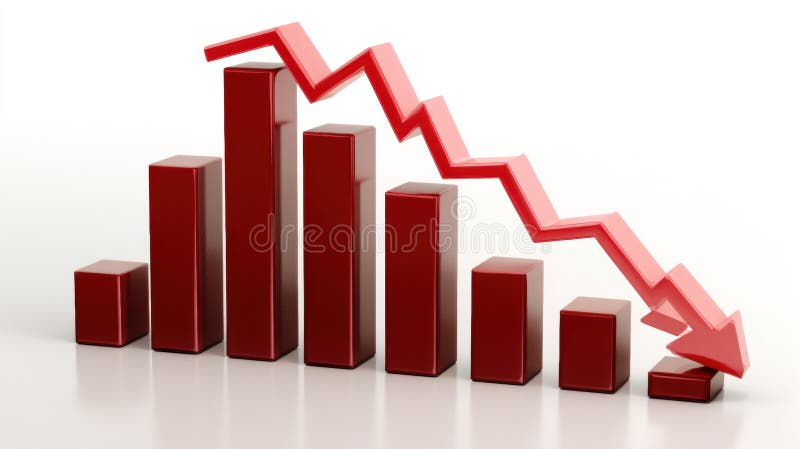
Free with trial This 3D rendering shows a bar graph with a sharp downward trend, symbolized by a large red arrow. The graph visually represents a significant decline or decrease in a particular metric. The dark red bars and bright red arrow create a strong visual impact. Decrease growth arrow illustrations Declining Bar Graph. This 3D rendering shows a bar graph with a sharp downward trend, symbolized by a large red arrow. The graph visually represents a. This 3D rendering shows a bar graph with a sharp downward trend, symbolized by a large red arrow. The graph visually represents a significant decline or decrease in a particular metric. The dark red bars and bright red arrow create a strong visual impact.
Free with trial A colorful flat line icon set illustrating money and finance concepts centered around a money blender metaphor. The central large icon shows a hand putting coins into a blender, surrounded by smaller icons of wallets, piggy banks, money bags, coins, arrows, kitchen appliances, washing machine, charts and financial documents. Perfect for banking, investment, budgeting, loss, savings and economic presentations, websites, apps and infographics. Decrease growth arrow vectors Money Finance Icons Set with Blender Concept. A colorful flat line icon set illustrating money and finance concepts centered around a money blender metaphor. The. A colorful flat line icon set illustrating money and finance concepts centered around a money blender metaphor. The central large icon shows a hand putting coins into a blender, surrounded by smaller icons of wallets, piggy banks, money bags, coins, arrows, kitchen appliances, washing machine, charts and financial documents. Perfect for banking, investment, budgeting, loss, savings and economic presentations, websites, apps and infographics.
Free with trial A collection of twenty-four colorful flat line icons arranged in a grid on white background, featuring finance, economy and logistics symbols including globe, delivery trucks, gas pump, charts, graphs, money, dollar coins, magnifying glass, money bag and clipboard. Green, blue and beige palette with dark outlines. Perfect for business presentations, financial reports, infographics, websites, apps and marketing materials related to banking, investment, trade, shipping and market analysis. Decrease growth arrow vectors Set of Financial Economy and Logistics Icons. A collection of twenty-four colorful flat line icons arranged in a grid on white background, featuring finance. A collection of twenty-four colorful flat line icons arranged in a grid on white background, featuring finance, economy and logistics symbols including globe, delivery trucks, gas pump, charts, graphs, money, dollar coins, magnifying glass, money bag and clipboard. Green, blue and beige palette with dark outlines. Perfect for business presentations, financial reports, infographics, websites, apps and marketing materials related to banking, investment, trade, shipping and market analysis.
Free with trial A stylized dollar sign and two downward pointing arrows are presented on a pink tiered podium against a solid pink background. Decrease growth arrow illustrations Dollar sign and downward arrows on a pink podium symbolizing financial decline. A stylized dollar sign and two downward pointing arrows are presented on a pink. A stylized dollar sign and two downward pointing arrows are presented on a pink tiered podium against a solid pink background
Free with trial Horizontal chart line icon. Neumorphic, Flat shadow, 3d buttons. Column graph sign. Market analytics symbol. Line horizontal chart icon. Social media icons. Vector. Decrease growth arrow illustrations Horizontal chart line icon. Column graph sign. Neumorphic buttons. Vector. Horizontal chart line icon. Neumorphic, Flat shadow, 3d buttons. Column graph sign. Horizontal chart line icon. Neumorphic, Flat shadow, 3d buttons. Column graph sign. Market analytics symbol. Line horizontal chart icon. Social media icons. Vector
Free with trial A visual representation of the indian economy facing a downturn, indicated by a falling graph and the rupee symbol, set against a dark background, highlighting the financial crisis and economic challenges. Decrease growth arrow illustrations Indian economy crisis concept with falling graph and rupee symbol on dark background illustration design. A visual representation of the indian economy facing a. a visual representation of the indian economy facing a downturn, indicated by a falling graph and the rupee symbol, set against a dark background, highlighting the financial crisis and economic challenges.
Free with trial Illustrative graphic showing a declining financial graph with a downward arrow alongside stacks of coins representing a fall in interest rates and market value. Decrease growth arrow illustrations Financial Crisis: Decreasing Interest Rates and Market Decline. Illustrative graphic showing a declining financial graph with a downward arrow alongside stacks. Illustrative graphic showing a declining financial graph with a downward arrow alongside stacks of coins representing a fall in interest rates and market value
Free with trial Diagram chart line icon. Neumorphic, Flat shadow, 3d buttons. Column 3d graph sign. Market analytics symbol. Line 3d chart icon. Social media icons. Vector. Decrease growth arrow vectors Diagram chart line icon. Column 3d graph sign. Neumorphic buttons. Vector. Diagram chart line icon. Neumorphic, Flat shadow, 3d buttons. Column 3d graph sign. Diagram chart line icon. Neumorphic, Flat shadow, 3d buttons. Column 3d graph sign. Market analytics symbol. Line 3d chart icon. Social media icons. Vector
Free with trial A colorful collection of flat line icons related to gasoline prices and fuel economy isolated on white background. Includes gas pumps, fuel nozzles, price displays, rising and falling arrows, cars, gauges, charts, money symbols, payment and eco fuel concepts. Perfect for illustrating articles about energy costs, inflation, transportation, oil market trends, and sustainability. Ideal for websites, presentations, infographics, apps, and financial reports on petrol pricing. Decrease growth arrow vectors Fuel Price Icons Set with Gas Station Symbols. A colorful collection of flat line icons related to gasoline prices and fuel economy isolated on white background. A colorful collection of flat line icons related to gasoline prices and fuel economy isolated on white background. Includes gas pumps, fuel nozzles, price displays, rising and falling arrows, cars, gauges, charts, money symbols, payment and eco fuel concepts. Perfect for illustrating articles about energy costs, inflation, transportation, oil market trends, and sustainability. Ideal for websites, presentations, infographics, apps, and financial reports on petrol pricing.
Free with trial Colorful flat depicting inflation and rising cost of living concept with bar graphs showing upward and downward trends, dollar symbols, balance scale with coins and cash, housing, transportation, fuel, grocery shopping, credit card icons, and stressed people analyzing finances. Includes pie charts, calculator, magnifying glass. Ideal for financial articles, economic reports, banking, budgeting, recession, investment and business presentations about price increases. Decrease growth arrow vectors Inflation and rising costs economic infographic. Colorful flat depicting inflation and rising cost of living concept with bar graphs showing upward and downward. Colorful flat depicting inflation and rising cost of living concept with bar graphs showing upward and downward trends, dollar symbols, balance scale with coins and cash, housing, transportation, fuel, grocery shopping, credit card icons, and stressed people analyzing finances. Includes pie charts, calculator, magnifying glass. Ideal for financial articles, economic reports, banking, budgeting, recession, investment and business presentations about price increases.
Free with trial Directional Arrows Up and Down Showing Contrast and Balance. AI generated. Decrease growth arrow vectors Directional Arrows Up and Down Showing Contrast and Balance. AI generated
Free with trial A colorful flat icon set illustrating business comparison, analysis and evaluation concepts on white background. Includes symbols for versus, charts, graphs, scales, pros and cons, reviews, ratings, feedback, shopping, value versus cost, filters and performance metrics in blue, green and yellow. Ideal for presentations, websites, marketing, finance, e-commerce and decision-making infographics requiring modern comparison visuals. Decrease growth arrow vectors Business Comparison Versus Analysis Icons Set. A colorful flat icon set illustrating business comparison, analysis and evaluation concepts on white background. A colorful flat icon set illustrating business comparison, analysis and evaluation concepts on white background. Includes symbols for versus, charts, graphs, scales, pros and cons, reviews, ratings, feedback, shopping, value versus cost, filters and performance metrics in blue, green and yellow. Ideal for presentations, websites, marketing, finance, e-commerce and decision-making infographics requiring modern comparison visuals.
Free with trial Flat of a couple with shopping cart and bags surrounded by symbols of rising expenses including house, fuel, electricity and groceries, with falling coins and up and down arrows with percentage signs representing inflation and interest rates. Concept of cost of living crisis, budgeting, economy and financial struggle. Ideal for articles, blogs and presentations about inflation, recession, consumer prices and household finance. Decrease growth arrow vectors Couple Facing Rising Living Costs and Inflation. Flat of a couple with shopping cart and bags surrounded by symbols of rising expenses including house, fuel. Flat of a couple with shopping cart and bags surrounded by symbols of rising expenses including house, fuel, electricity and groceries, with falling coins and up and down arrows with percentage signs representing inflation and interest rates. Concept of cost of living crisis, budgeting, economy and financial struggle. Ideal for articles, blogs and presentations about inflation, recession, consumer prices and household finance.
Free with trial A comprehensive collection of modern blue business and financial icons displayed on a grid background. Visual elements include increasing and decreasing bar graphs, currency symbols such as dollar and yen, secure bank vaults, security shields, wallets with money, pie charts, database storage, and business partnership handshakes. This versatile set is ideal for corporate infographics, financial presentations, website design, mobile banking applications, economic reports, and commercial accounting dashboards. Decrease growth arrow vectors Set of Blue Business and Finance Vector Icons. A comprehensive collection of modern blue business and financial icons displayed on a grid background. Visual. A comprehensive collection of modern blue business and financial icons displayed on a grid background. Visual elements include increasing and decreasing bar graphs, currency symbols such as dollar and yen, secure bank vaults, security shields, wallets with money, pie charts, database storage, and business partnership handshakes. This versatile set is ideal for corporate infographics, financial presentations, website design, mobile banking applications, economic reports, and commercial accounting dashboards.
Free with trial Blue letter s symbol indicating decline or financial loss. Glossy blue letter S symbol isolated on white background representing finance or a downward trend AI. Decrease growth arrow illustrations Blue letter s symbol indicating decline or financial loss. Glossy blue letter S symbol isolated on white background representing finance or a downward trend AI
 Sign in