Free with trial A hand-drawn graph displays a significant downturn, visually depicting economic decline or financial loss. This simplistic illustration can be used to represent business failure, market risk, or a negative trend in various financial and economic analyses. Decrease growth arrow illustrations Hand Drawn Graph Showing a Downturn Representing Economic Decline. A hand-drawn graph displays a significant downturn, visually depicting economic decline or. A hand-drawn graph displays a significant downturn, visually depicting economic decline or financial loss. This simplistic illustration can be used to represent business failure, market risk, or a negative trend in various financial and economic analyses
Free with trial Flat showing rising logistics and delivery costs impacting business profitability. A delivery worker pushes a truck up a rising cost graph with icons for fuel, maintenance and money. On the right, revenue from stacked parcels funnels down to small profit on a balance scale. Concept of inflation, supply chain expenses, e-commerce challenges. Ideal for business, finance, logistics articles, presentations and marketing about cost management. Decrease growth arrow vectors Rising Delivery Costs Reducing Business Profit Illustration. Flat showing rising logistics and delivery costs impacting business profitability. A delivery worker. Flat showing rising logistics and delivery costs impacting business profitability. A delivery worker pushes a truck up a rising cost graph with icons for fuel, maintenance and money. On the right, revenue from stacked parcels funnels down to small profit on a balance scale. Concept of inflation, supply chain expenses, e-commerce challenges. Ideal for business, finance, logistics articles, presentations and marketing about cost management.
Free with trial Vector depicting economic instability with upward and downward trend arrows. Includes icons of a house with coins and price tags, oil barrels, fuel pumps, steel beams, grain sacks, and a cargo ship with falling arrows on waves. Represents concepts of inflation, recession, rising commodity prices, housing costs, and declining trade. Isolated on white background. Ideal for financial articles, economic reports, business presentations, and news about global markets. Decrease growth arrow vectors Economic Downturn with Rising Commodity Prices Illustration. Vector depicting economic instability with upward and downward trend arrows. Includes icons of a. Vector depicting economic instability with upward and downward trend arrows. Includes icons of a house with coins and price tags, oil barrels, fuel pumps, steel beams, grain sacks, and a cargo ship with falling arrows on waves. Represents concepts of inflation, recession, rising commodity prices, housing costs, and declining trade. Isolated on white background. Ideal for financial articles, economic reports, business presentations, and news about global markets.
Free with trial Illustration of diverse group of people struggling to hold up a cracked government or bank building under pressure from large downward red arrows representing economic recession. Icons show rising costs for groceries, energy, water, transport, and falling housing market. Concept of inflation, cost of living crisis, financial burden on citizens, social support and resilience. Ideal for articles on economy, recession, public policy, taxation, and financial hardship. Decrease growth arrow vectors People Supporting Cracking Economy Under Inflation Pressure. Illustration of diverse group of people struggling to hold up a cracked government or bank building. Illustration of diverse group of people struggling to hold up a cracked government or bank building under pressure from large downward red arrows representing economic recession. Icons show rising costs for groceries, energy, water, transport, and falling housing market. Concept of inflation, cost of living crisis, financial burden on citizens, social support and resilience. Ideal for articles on economy, recession, public policy, taxation, and financial hardship.
Free with trial A clean, black and white representing climate forecasting and predictive analytics. The design features a stylized globe intertwined with upward-trending and downward-trending data graphs, economic arrows, and a small cloud symbol. This conceptual icon is perfect for use in environmental studies, corporate sustainability reports, financial forecasting presentations, weather analytics applications, and global data science projects requiring professional infographics and modern symbolic imagery. Decrease growth arrow illustrations Climate Forecasting and Predictive Analytics Concept Vector. A clean, black and white representing climate forecasting and predictive analytics. The design. A clean, black and white representing climate forecasting and predictive analytics. The design features a stylized globe intertwined with upward-trending and downward-trending data graphs, economic arrows, and a small cloud symbol. This conceptual icon is perfect for use in environmental studies, corporate sustainability reports, financial forecasting presentations, weather analytics applications, and global data science projects requiring professional infographics and modern symbolic imagery.
Free with trial Range Breakout vector Candlestick Chart icon or symbol. Decrease growth arrow vectors Range Breakout vector Candlestick Chart icon or symbol. Range Breakout vector Candlestick Chart concept icon or symbol
Free with trial Budget cut strategy cost reduction global finance graph rising. Generative AI. Decrease growth arrow illustrations Budget cut strategy cost reduction global finance graph rising. Generative AI
Free with trial Hand presents a declining bar graph illustrating cost reduction, creating a compelling business visual Perfect for presentations and financial analysis. Decrease growth arrow illustrations Presenting Cost Reduction with Graph and Hand. Hand presents a declining bar graph illustrating cost reduction, creating a compelling business visual Perfect for. Hand presents a declining bar graph illustrating cost reduction, creating a compelling business visual Perfect for presentations and financial analysis
Free with trial Vector of a stressed college student in graduation cap carrying a heavy platform with university tuition building, school bus, bicycle and train labeled transport costs. Surrounded by broken dollar coins, gears, bar charts and arrows symbolizing rising expenses and financial pressure. Isolated on white background. Ideal for education finance, student debt, budgeting, cost of living, and university affordability articles, blogs and presentations. Decrease growth arrow vectors Student Carrying Heavy Burden of Tuition and Transport Costs. Vector of a stressed college student in graduation cap carrying a heavy platform with university. Vector of a stressed college student in graduation cap carrying a heavy platform with university tuition building, school bus, bicycle and train labeled transport costs. Surrounded by broken dollar coins, gears, bar charts and arrows symbolizing rising expenses and financial pressure. Isolated on white background. Ideal for education finance, student debt, budgeting, cost of living, and university affordability articles, blogs and presentations.
Free with trial Gradient Level Indicator with Directional Arrows for Progress. Gradient level indicator showing upward and downward direction with a stable middle. Decrease growth arrow illustrations Gradient Level Indicator with Directional Arrows for Progress. Gradient level indicator showing upward and downward direction with a stable middle
Free with trial This infographic illustrates the industrial production and supply chain process. It features a factory emitting smoke, a large oil barrel, and circular icons representing raw materials like timber, labor, and packaged goods. Arrows depict the flow of materials from production to packaging and distribution. A downward-trending graph suggests economic or production metrics. The design uses a clean, flat style with a blue, orange, and grey color palette, suitable for presentations or reports on manufacturing, logistics, and industrial economics. Decrease growth arrow vectors Industrial Factory Supply Chain and Production Flow Infographic. This infographic illustrates the industrial production and supply chain process. It features a. This infographic illustrates the industrial production and supply chain process. It features a factory emitting smoke, a large oil barrel, and circular icons representing raw materials like timber, labor, and packaged goods. Arrows depict the flow of materials from production to packaging and distribution. A downward-trending graph suggests economic or production metrics. The design uses a clean, flat style with a blue, orange, and grey color palette, suitable for presentations or reports on manufacturing, logistics, and industrial economics.
Free with trial Shiny red and green arrows intersecting symbolize opposing directions or viewpoints This graphic is suitable for business presentations or conflict resolution materials. Decrease growth arrow illustrations Red and Green Arrows Pointing in Opposite Directions Symbolize Conflict. Shiny red and green arrows intersecting symbolize opposing directions or viewpoints This. Shiny red and green arrows intersecting symbolize opposing directions or viewpoints This graphic is suitable for business presentations or conflict resolution materials
Free with trial Business Down Icon - Percentage Rate Loss Icon. Sing symbol. Decrease growth arrow vectors Business Down Icon - Percentage Rate Loss Icon. Sing symbol
Free with trial A professional hand holding a transparent card illustrating increased quality and decreased cost, isolated on white background. Decrease growth arrow illustrations Hand showing quality up and cost down concept. A professional hand holding a transparent card illustrating increased quality and decreased cost, isolated on. A professional hand holding a transparent card illustrating increased quality and decreased cost, isolated on white background
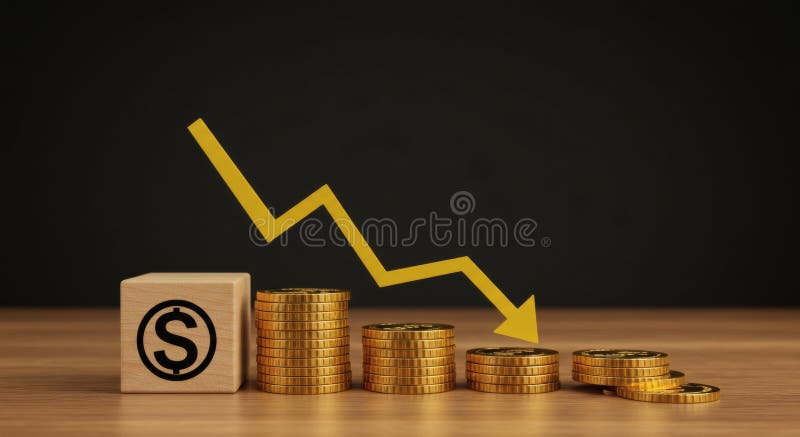
Free with trial Declining Dollar: Economic Downturn Visualized. Image depicting a downward trend in currency value, symbolized by stacks of gold coins and a falling arrow. Decrease growth arrow illustrations Declining Dollar: Economic Downturn Visualized. Image depicting a downward trend in currency value, symbolized by stacks of gold coins and a falling arrow
Free with trial A hand-drawn business graph showing a decreasing trend line. It represents a down market, financial loss, economic downturn, or a business crisis. This could be used to illustrate various business presentations or reports. Decrease growth arrow illustrations Hand Drawn Business Graph with Decreasing Trend Line on White Background. A hand-drawn business graph showing a decreasing trend line. It represents a down. A hand-drawn business graph showing a decreasing trend line. It represents a down market, financial loss, economic downturn, or a business crisis. This could be used to illustrate various business presentations or reports
Free with trial Split comparing expensive traditional yellow taxi service with affordable modern rideshare app. Top left shows unhappy passengers paying with large dollar coin in yellow cab with rising costs graph and coin stacks. Bottom right shows happy driver in blue car using smartphone navigation, cheap fare display, and falling costs graph. Ideal for articles about transportation economy, ride-hailing technology, urban mobility, pricing, and travel savings. Decrease growth arrow vectors Traditional Taxi Versus Rideshare Cost Comparison Illustration. Split comparing expensive traditional yellow taxi service with affordable modern rideshare app. Split comparing expensive traditional yellow taxi service with affordable modern rideshare app. Top left shows unhappy passengers paying with large dollar coin in yellow cab with rising costs graph and coin stacks. Bottom right shows happy driver in blue car using smartphone navigation, cheap fare display, and falling costs graph. Ideal for articles about transportation economy, ride-hailing technology, urban mobility, pricing, and travel savings.
Free with trial Colorful flat depicting rising logistics and transportation costs. A delivery worker pushes a falling dollar bar while a blue delivery truck is squeezed between large boxes symbolizing increasing fuel prices and operating expenses. Elements include a balance scale with packages, upward trend graph, city road and buildings. Perfect concept for inflation, supply chain crisis, e-commerce shipping, economic pressure. Ideal for business articles, finance blogs, and logistics presentations. Decrease growth arrow vectors Rising Delivery Costs Crushing Logistics Business Illustration. Colorful flat depicting rising logistics and transportation costs. A delivery worker pushes a. Colorful flat depicting rising logistics and transportation costs. A delivery worker pushes a falling dollar bar while a blue delivery truck is squeezed between large boxes symbolizing increasing fuel prices and operating expenses. Elements include a balance scale with packages, upward trend graph, city road and buildings. Perfect concept for inflation, supply chain crisis, e-commerce shipping, economic pressure. Ideal for business articles, finance blogs, and logistics presentations.
Free with trial Businessman in suit jumps between cliffs with red downward and green upward arrows, symbolizing market recovery and financial success. Decrease growth arrow illustrations Businessman jumping from financial crisis to success with red downward and green upward arrows. Businessman in suit jumps between cliffs with red downward and. Businessman in suit jumps between cliffs with red downward and green upward arrows, symbolizing market recovery and financial success
Free with trial Financial graph showing rise and fall with stacks of gold coins. Red arrows illustrate upward and downward trends among scattered gold coins and stacks. Decrease growth arrow vectors Financial graph showing rise and fall with stacks of gold coins. Red arrows illustrate upward and downward trends among scattered gold coins and stacks
Free with trial This image shows a balance scale with upward and downward arrows, symbolizing market trends, economic fluctuations, and financial equilibrium in the economy. Decrease growth arrow vectors Vector art of balance scale with upward and downward arrows, symbolizing market trends, economic fluctuations, and financial. This image shows a balance scale. This image shows a balance scale with upward and downward arrows, symbolizing market trends, economic fluctuations, and financial equilibrium in the economy
Free with trial Black and white line icons depicting various business finance and technology concepts including currency symbols credit cards security shields and more on white background , seamless texture. Decrease growth arrow vectors Collection of various business finance and technology icons such as currency symbols credit cards and security shie. Black and white line icons depicting various. Black and white line icons depicting various business finance and technology concepts including currency symbols credit cards security shields and more on white background , seamless texture
Free with trial Modern financial icon set featuring dollar sign symbols with upward and downward arrows for business and economic concepts. AI generated. Decrease growth arrow vectors Modern financial icon set featuring dollar sign symbols with upward and downward arrows for business and economic concepts. AI generated
Free with trial Pair of green arrows, one pointing up and other down, both adorned with intricate swirling patterns, symbolizing trends and directions on white background. Decrease growth arrow illustrations Up and down arrows in green swirling pattern on white background. Pair of green arrows, one pointing up and other down, both adorned with intricate swirling. Pair of green arrows, one pointing up and other down, both adorned with intricate swirling patterns, symbolizing trends and directions on white background
Free with trial This image was created using Generative AI. Black and white of percentage signs with up and down arrows. Decrease growth arrow vectors Percentage signs with up and down arrows indicating change rates. This image was created using Generative AI. Black and white of percentage signs with up and. This image was created using Generative AI. Black and white of percentage signs with up and down arrows
Free with trial This image was created using Generative AI. Black and white of percentage signs with up and down arrows. Decrease growth arrow vectors Percentage signs with up and down arrows indicating change rates. This image was created using Generative AI. Black and white of percentage signs with up and. This image was created using Generative AI. Black and white of percentage signs with up and down arrows
Free with trial Modern laptop shows real time financial data analytics with line graphs bar charts and a pie chart. Decrease growth arrow illustrations Laptop Screen Displaying Live Business Data Charts and Analytics. Modern laptop shows real time financial data analytics with line graphs bar charts and a pie. Modern laptop shows real time financial data analytics with line graphs bar charts and a pie chart
Free with trial The visual features a black line graph illustration showing a downward trend. Positioned on a light blue backdrop, the minimalist design may represent decline, loss or negative progression. The image suits presentations, reports, or articles related to finance, statistics, business, or economic subjects, for editorial or commercial use. Decrease growth arrow illustrations Decreasing trend line graph on blue background finance visual concept. The visual features a black line graph illustration showing a downward trend. Positioned. The visual features a black line graph illustration showing a downward trend. Positioned on a light blue backdrop, the minimalist design may represent decline, loss or negative progression. The image suits presentations, reports, or articles related to finance, statistics, business, or economic subjects, for editorial or commercial use
Free with trial A minimalist graphic featuring two bold blue arrows, one pointing upwards and the other downwards, symbolizing opposing directions or changes. Isolated on white. Decrease growth arrow illustrations Two blue arrows pointing up and down isolated on white background. A minimalist graphic featuring two bold blue arrows, one pointing upwards and the other. A minimalist graphic featuring two bold blue arrows, one pointing upwards and the other downwards, symbolizing opposing directions or changes. Isolated on white
Free with trial A businessman in a suit holds a digital display showing arrows and percentages, representing the concept of reducing costs while improving quality. The image portrays business strategy and efficiency. Decrease growth arrow illustrations Businessman presents cost reduction and quality improvement concept. A businessman in a suit holds a digital display showing arrows and percentages, representing. A businessman in a suit holds a digital display showing arrows and percentages, representing the concept of reducing costs while improving quality. The image portrays business strategy and efficiency
Free with trial Two bar chart icons with descending trend arrows. On the left, bars are solid with a zigzag arrow above, indicating fluctuation. On the right, bars are outlined with a straight arrow crossing diagonally, signifying a steady decline. Both are black and white, using simple line art style. These icons typically represent a decrease or negative trend in statistics, finance, or sales data. Decrease growth arrow illustrations PrintFinancial downturn icons declining charts and market recession. Two bar chart icons with descending trend arrows. On the left, bars are solid with a zigzag. Two bar chart icons with descending trend arrows. On the left, bars are solid with a zigzag arrow above, indicating fluctuation. On the right, bars are outlined with a straight arrow crossing diagonally, signifying a steady decline. Both are black and white, using simple line art style. These icons typically represent a decrease or negative trend in statistics, finance, or sales data.
Free with trial A close-up shot of a hand moving wooden blocks, one with a percentage symbol and the other with up and down arrows, symbolizing financial changes. Decrease growth arrow illustrations Hand Adjusting Wooden Blocks Showing Percentage and UpDown Arrows. A close-up shot of a hand moving wooden blocks, one with a percentage symbol and the other. A close-up shot of a hand moving wooden blocks, one with a percentage symbol and the other with up and down arrows, symbolizing financial changes
Free with trial Time management and process flow concept with hourglass and arrows icon. AI generated. Decrease growth arrow vectors Time management and process flow concept with hourglass and arrows icon. AI generated
Free with trial A person in a suit points a finger at a percentage symbol. The symbol is surrounded by red and green arrows on a dark background. The composition is close-up. Decrease growth arrow illustrations Businessman pointing at percentage symbol with red and green arrows on a dark background finance. A person in a suit points a finger at a percentage symbol. The. A person in a suit points a finger at a percentage symbol. The symbol is surrounded by red and green arrows on a dark background. The composition is close-up
Free with trial This image showcases data analysis icons, representing data processing, visualization, and interpretation, which are crucial for gaining valuable insights. Decrease growth arrow vectors Vector art of data analysis icons representing various aspects of data processing, visualization, and interpretation for insights. This image showcases data. This image showcases data analysis icons, representing data processing, visualization, and interpretation, which are crucial for gaining valuable insights
Free with trial Nine colorful arrows, pointing up, down, left, and right, are displayed against a white background, each casting a subtle drop shadow, creating a vibrant and directional visual element. Decrease growth arrow illustrations Colorful arrows pointing in different directions with drop shadow. Nine colorful arrows, pointing up, down, left, and right, are displayed against a white. Nine colorful arrows, pointing up, down, left, and right, are displayed against a white background, each casting a subtle drop shadow, creating a vibrant and directional visual element
Free with trial Report line icon. Neumorphic, Flat shadow, 3d buttons. Column graph, pie chart sign. Market analytics symbol. Line report icon. Social media icons. Vector. Decrease growth arrow vectors Report line icon. Column graph, pie chart sign. Neumorphic buttons. Vector. Report line icon. Neumorphic, Flat shadow, 3d buttons. Column graph, pie chart sign. Report line icon. Neumorphic, Flat shadow, 3d buttons. Column graph, pie chart sign. Market analytics symbol. Line report icon. Social media icons. Vector
Free with trial Comprehensive set of green and black business, finance, management, and data analysis line art icons featuring charts, graphs, metrics, gears, folders, search tools, calendars, and indicators designed in a modern minimalist style suitable for corporate interfaces and dashboards. Decrease growth arrow illustrations Set of green and black business and finance data analysis line art icons. Comprehensive set of green and black business, finance, management, and data analysis. Comprehensive set of green and black business, finance, management, and data analysis line art icons featuring charts, graphs, metrics, gears, folders, search tools, calendars, and indicators designed in a modern minimalist style suitable for corporate interfaces and dashboards.
Free with trial That US economy is changing the trend and goes up instead of down (or vice versa). Supports PNG files with transparent backgrounds. Decrease growth arrow vectors That US economy is changing the trend and goes up instead of down (or vice versa). Supports PNG files with transparent backgrounds
Free with trial Four 3D bar graphs with arrows indicating upward and downward trends on white. Clear details and vibrant colors enhance visual. Decrease growth arrow illustrations Four 3D Bar Graphs Showing Upward and Downward Trends with Arrows on White Keywords: bar graph, chart, data, statistics, analysis. Four 3D bar graphs with arrows. Four 3D bar graphs with arrows indicating upward and downward trends on white. Clear details and vibrant colors enhance visual
Free with trial Decreasing bar chart graph showing downward trend and financial loss. AI generated detailed line icon of a declining bar chart graph representing economic loss. Decrease growth arrow vectors Decreasing bar chart graph showing downward trend and financial loss. AI generated detailed line icon of a declining bar chart graph representing economic loss
Free with trial Bull Market, Bull or bullish run Bear or bearish market trend in stocks. Trade exchange, green up or red down arrows graph. Cryptocurrency price chart. Global economy crash or boom. Decrease growth arrow vectors Bull Market. Bull or bullish run Bear or bearish market trend in stocks. Trade exchange, green up or red down arrows graph. Cryptocurrency price chart. Global
Free with trial Indian economy recession concept with a falling graph and chart. financial crisis and market crash. business downturn and economic decline. india rupee symbol. investment loss and risk. Decrease growth arrow illustrations India economy recession concept falling graph chart indian rupee symbol financial crisis market crash business down turn. Indian economy recession concept with a. indian economy recession concept with a falling graph and chart. financial crisis and market crash. business downturn and economic decline. india rupee symbol. investment loss and risk
Free with trial Stacks of coins decreasing in size with red arrows pointing down on a light background. Concept of financial crisis, bankruptcy, and falling economy. 3D Rendering. Decrease growth arrow illustrations Stacks of coins decreasing in height with red downward arrows on a light background. Concept of financial crisis, bankruptcy, or. Stacks of coins decreasing in. Stacks of coins decreasing in size with red arrows pointing down on a light background. Concept of financial crisis, bankruptcy, and falling economy. 3D Rendering
Free with trial A stock market icon set featuring stock market, trading, bull and bear markets, charts, graphs and investing. these solid black glyph silhouette vector icons are clean, sharp and fully scalable without losing quality. ideal for websites, mobile apps, infographics, presentations, posters, print design and many other creative projects. Decrease growth arrow vectors Stock market solid icon pack, shares, money and more black glyph symbols. A stock market icon set featuring stock market, trading, bull and bear markets, charts. A stock market icon set featuring stock market, trading, bull and bear markets, charts, graphs and investing. these solid black glyph silhouette vector icons are clean, sharp and fully scalable without losing quality. ideal for websites, mobile apps, infographics, presentations, posters, print design and many other creative projects.
Free with trial A visual representation of falling prices or discounts. Six bright red arrows, each featuring a white percentage sign, point downwards, signifying economic changes or promotional offers. Decrease growth arrow illustrations Six red downward pointing arrows with percentage symbols indicating sales or price reductions. A visual representation of falling prices or discounts. Six bright. A visual representation of falling prices or discounts. Six bright red arrows, each featuring a white percentage sign, point downwards, signifying economic changes or promotional offers
Free with trial Graph chart going up and down sign arrows flat design vector illustration. On white background. Decrease growth arrow vectors Graph chart going up and down sign arrows flat design vector illustration. On white background
Free with trial The image depicts a business professional in a suit interacting with a transparent digital chart displaying a declining trend in business performance. The visualization includes green bar charts and a line graph, complemented by a prominent downward arrow and percentage symbol indicating a decrease. This modern digital interface symbolizes data-driven decision-making, financial analysis, and real-time monitoring of business metrics for strategic planning. Decrease growth arrow illustrations Business Performance Decline Visualization with Interactive Data Analytics and Percentage Drop Indicator. The image depicts a business professional in a suit. The image depicts a business professional in a suit interacting with a transparent digital chart displaying a declining trend in business performance. The visualization includes green bar charts and a line graph, complemented by a prominent downward arrow and percentage symbol indicating a decrease. This modern digital interface symbolizes data-driven decision-making, financial analysis, and real-time monitoring of business metrics for strategic planning.
Free with trial Real-Time Market Data Analysis with Candlestick Chart vector icon or symbol. Decrease growth arrow vectors Real-Time Market Data Analysis with Candlestick Chart vector icon or symbol. Real-Time Market Data Analysis with Candlestick Chart vector concept icon or symbol
Free with trial This image presents a grid of black and white icons, each representing various aspects of energy conservation, environmental awareness, and smart living. Icons include elements like power buttons, AC units, light bulbs, thermostats, meters, doors, windows, and gears, symbolizing efficiency, savings, and eco-friendly practices. The collection is ideal for illustrating concepts related to sustainability, resource management, smart homes, policy notices, and workplace environmental initiatives. The clean, minimalist design makes these icons versatile for use in presentations, websites, apps, and educational materials. Decrease growth arrow vectors Collection of Icons for Energy Saving and Eco-Friendly Concepts. This image presents a grid of black and white icons, each representing various aspects of energy. This image presents a grid of black and white icons, each representing various aspects of energy conservation, environmental awareness, and smart living. Icons include elements like power buttons, AC units, light bulbs, thermostats, meters, doors, windows, and gears, symbolizing efficiency, savings, and eco-friendly practices. The collection is ideal for illustrating concepts related to sustainability, resource management, smart homes, policy notices, and workplace environmental initiatives. The clean, minimalist design makes these icons versatile for use in presentations, websites, apps, and educational materials.
Free with trial A grid of black and white icons depicting financial charts with rising and falling trends, magnifying glasses with download arrows, and dollar signs. Decrease growth arrow vectors Collection of black and white icons representing financial charts and data analysis graph bar chart. A grid of black and white icons depicting financial charts. A grid of black and white icons depicting financial charts with rising and falling trends, magnifying glasses with download arrows, and dollar signs
Free with trial Visualizes indian rupee devaluation with a falling graph over india's map, symbolizing financial crisis and economic downturn. It represents market decline and investment risk, showing currency loss. Decrease growth arrow illustrations Indian rupee devaluation concept with falling graph and india map for financial crisis analysis. Visualizes indian rupee devaluation with a falling graph over. visualizes indian rupee devaluation with a falling graph over india's map, symbolizing financial crisis and economic downturn. It represents market decline and investment risk, showing currency loss.
Free with trial A set of eight black and white line art icons depicting sales and discount themes, including a gift box, scissors cutting a dollar sign, and a mobile phone with a percentage symbol. Decrease growth arrow vectors Sale Discount Shopping Icons Gift Box Scissors Phone Percentage vector illustration. A set of eight black and white line art icons depicting sales and discount. A set of eight black and white line art icons depicting sales and discount themes, including a gift box, scissors cutting a dollar sign, and a mobile phone with a percentage symbol
Free with trial A 3D bar chart with a red line graph indicating a significant decline, isolated on a white background. Decrease growth arrow illustrations Financial bar chart showing downward trend isolated on white background. A 3D bar chart with a red line graph indicating a significant decline, isolated on a. A 3D bar chart with a red line graph indicating a significant decline, isolated on a white background
Free with trial Black piggy bank with falling coin stacks and red down arrows on light background. Concept of financial crisis, bankruptcy, and economic decline. 3D Rendering. Decrease growth arrow illustrations Financial crisis concept with black piggy bank and decreasing stacks of coins. Red arrows indicate economic downturn on light. Black piggy bank with falling coin. Black piggy bank with falling coin stacks and red down arrows on light background. Concept of financial crisis, bankruptcy, and economic decline. 3D Rendering
Free with trial A hand holds glowing particles with text comparing quality versus cost. Up and down arrows indicate opposite trends. Decrease growth arrow illustrations Hand holding quality versus cost comparison with up and down arrows image. A hand holds glowing particles with text comparing quality versus cost. Up and down. A hand holds glowing particles with text comparing quality versus cost. Up and down arrows indicate opposite trends
Free with trial Simple graphic illustration of a dollar coin and financial arrows depicting market fluctuations for business and finance concepts. AI generated. Decrease growth arrow vectors Simple graphic illustration of a dollar coin and financial arrows depicting market fluctuations for business and finance concepts. AI generated
Free with trial This vector file contains business chart icons including rising bar graphs, falling graphs, and pie chart symbols illustrating data trends in a simple style professional and clear mood. Generative AI. Decrease growth arrow vectors Business chart icons set with rising and falling graphs pie chart symbols vector illustration. This vector file contains business chart icons including rising. This vector file contains business chart icons including rising bar graphs, falling graphs, and pie chart symbols illustrating data trends in a simple style professional and clear mood. Generative AI
Free with trial Real estate market crash concept shows property value drop. Finance disaster destroys home investment. Business recession. Decrease growth arrow illustrations Real estate market crash concept shows property value drop. Finance disaster destroys home investment. Business recession
Free with trial Real-Time Market Data Analysis with Candlestick Chart vector concept seamless pattern. Decrease growth arrow vectors Real-Time Market Data Analysis with Candlestick Chart vector seamless pattern. Real-Time Market Data Analysis with Candlestick Chart vector concept seamless. Real-Time Market Data Analysis with Candlestick Chart vector concept seamless pattern
Free with trial A visual representation of cost reduction, featuring stacks of coins diminishing in height and wooden blocks spelling out COST. Decrease growth arrow illustrations Decreasing Cost Concept Illustrated with Stacks of Coins and Wooden Blocks. A visual representation of cost reduction, featuring stacks of coins diminishing in. A visual representation of cost reduction, featuring stacks of coins diminishing in height and wooden blocks spelling out COST
Free with trial Silhouettes depict male figures interacting with downward-pointing arrows, symbolizing business loss or decline. One figure gestures towards a large arrow, another walks alongside it. The minimalist design uses solid black on a white background, emphasizing the concept of financial reduction or setbacks. Arrow sizes vary, enhancing the visual representation of movement or direction. Decrease growth arrow vectors A set of Business Loss Concept with Male Figure. Silhouettes depict male figures interacting with downward-pointing arrows, symbolizing business loss or decline. Silhouettes depict male figures interacting with downward-pointing arrows, symbolizing business loss or decline. One figure gestures towards a large arrow, another walks alongside it. The minimalist design uses solid black on a white background, emphasizing the concept of financial reduction or setbacks. Arrow sizes vary, enhancing the visual representation of movement or direction.
Free with trial Silhouettes depict male figures interacting with downward-pointing arrows, symbolizing business loss or decline. One figure gestures towards a large arrow, another walks alongside it. The minimalist design uses solid black on a white background, emphasizing the concept of financial reduction or setbacks. Arrow sizes vary, enhancing the visual representation of movement or direction. Decrease growth arrow vectors A set of Business Loss Concept with Male Figure. Silhouettes depict male figures interacting with downward-pointing arrows, symbolizing business loss or decline. Silhouettes depict male figures interacting with downward-pointing arrows, symbolizing business loss or decline. One figure gestures towards a large arrow, another walks alongside it. The minimalist design uses solid black on a white background, emphasizing the concept of financial reduction or setbacks. Arrow sizes vary, enhancing the visual representation of movement or direction.
Free with trial Silhouettes depict male figures interacting with downward-pointing arrows, symbolizing business loss or decline. One figure gestures towards a large arrow, another walks alongside it. The minimalist design uses solid black on a white background, emphasizing the concept of financial reduction or setbacks. Arrow sizes vary, enhancing the visual representation of movement or direction. Decrease growth arrow vectors A set of Business Loss Concept with Male Figure. Silhouettes depict male figures interacting with downward-pointing arrows, symbolizing business loss or decline. Silhouettes depict male figures interacting with downward-pointing arrows, symbolizing business loss or decline. One figure gestures towards a large arrow, another walks alongside it. The minimalist design uses solid black on a white background, emphasizing the concept of financial reduction or setbacks. Arrow sizes vary, enhancing the visual representation of movement or direction.
Free with trial Silhouettes depict male figures interacting with downward-pointing arrows, symbolizing business loss or decline. One figure gestures towards a large arrow, another walks alongside it. The minimalist design uses solid black on a white background, emphasizing the concept of financial reduction or setbacks. Arrow sizes vary, enhancing the visual representation of movement or direction. Decrease growth arrow vectors A set of Business Loss Concept with Male Figure. Silhouettes depict male figures interacting with downward-pointing arrows, symbolizing business loss or decline. Silhouettes depict male figures interacting with downward-pointing arrows, symbolizing business loss or decline. One figure gestures towards a large arrow, another walks alongside it. The minimalist design uses solid black on a white background, emphasizing the concept of financial reduction or setbacks. Arrow sizes vary, enhancing the visual representation of movement or direction.
Free with trial This image captures a conceptual business planning session, suggesting a focus on market trend analysis, charting of progress and addressing potential declines. Decrease growth arrow illustrations Conceptual business strategy session with downward trend and coffee break. This image captures a conceptual business planning session, suggesting a focus on. This image captures a conceptual business planning session, suggesting a focus on market trend analysis, charting of progress and addressing potential declines
Free with trial A black outline icon showing a bar chart with an exclamation mark warning triangle and arrows. The graphic represents data analysis risk and. Decrease growth arrow vectors Risk analysis chart icon outline graphic symbol for business finance and data. A black outline icon showing a bar chart with an exclamation mark warning triangle. A black outline icon showing a bar chart with an exclamation mark warning triangle and arrows. The graphic represents data analysis risk and
Free with trial A red pen sitting on top of a paper with a graph on it. A red pen with a silver tip is resting on a piece of paper with a graph AI generated. Decrease growth arrow illustrations A red pen sitting on top of a paper with a graph on it. A red pen with a silver tip is resting on a piece of paper with a graph AI generated
Free with trial Vector icon of percentage change with up and down arrows. Interest rate and discount fluctuation concept. AI generated. Decrease growth arrow vectors Vector icon of percentage change with up and down arrows. Interest rate and discount fluctuation concept. AI generated
Free with trial Business decline concept showing a decreasing financial trend with wooden blocks and red downward arrows. Vibrant yellow background provides ample copy space image features clean, natural light. Ideal for financial reports, web banners, presentations, or marketing collateral. Decrease growth arrow illustrations Business Decline Trend Blocks with Red Arrows on Yellow Background Copy Space. Business decline concept showing a decreasing financial trend with wooden blocks. Business decline concept showing a decreasing financial trend with wooden blocks and red downward arrows. Vibrant yellow background provides ample copy space image features clean, natural light. Ideal for financial reports, web banners, presentations, or marketing collateral.
Free with trial A dramatic red stock market chart showing a significant downturn. it illustrates a financial crisis, economic recession, or a major market crash. a visual representation of loss and investment risk. Decrease growth arrow illustrations Stock market crash financial crisis economic recession downtrend chart red graph business loss investment. A dramatic red stock market chart showing a. a dramatic red stock market chart showing a significant downturn. it illustrates a financial crisis, economic recession, or a major market crash. a visual representation of loss and investment risk.
Free with trial This image shows a calculator with a dollar coin and arrows, symbolizing financial calculations, investments, and accounting on a blue background. Decrease growth arrow vectors Vector art of calculator with dollar coin and arrows indicating financial calculation, isolated on blue background it represents. This image shows a calculator. This image shows a calculator with a dollar coin and arrows, symbolizing financial calculations, investments, and accounting on a blue background
Free with trial A stylized stock market chart showing a downward trend with blue and orange bars on white. Generative AI. Decrease growth arrow illustrations A stylized stock market chart showing a downward trend with blue and orange bars on white. Generative AI
Free with trial 3D illustration showing falling interest rates and their impact on savings and investments. Red arrow pointing down showing negative trend. Decrease growth arrow illustrations Interest Rates Decline: Impact on Savings and Investments. 3D illustration showing falling interest rates and their impact on savings and investments. Red arrow. 3D illustration showing falling interest rates and their impact on savings and investments. Red arrow pointing down showing negative trend
Free with trial Set of four red 3d icons showing percentage increase and decrease. Versatile graphic symbols for displaying interest rate changes discount offers or economic trends and statistics. Decrease growth arrow illustrations Red percent sign icons with upward and downward arrows for market fluctuations. Set of four red 3d icons showing percentage increase and decrease. Versatile. Set of four red 3d icons showing percentage increase and decrease. Versatile graphic symbols for displaying interest rate changes discount offers or economic trends and statistics
Free with trial This is an detailed collection of minimalist line icons representing various business graphs and data trends. Decrease growth arrow vectors Professional business graph and data visualization line icon set for reports. This is an ai generated detailed collection of minimalist line icons representing. This is an detailed collection of minimalist line icons representing various business graphs and data trends
Free with trial Price low down and up icon concept. Interest low price 3d percent discount vector icon. Percentage with arrow up and down. 3D Web Vector Illustrations. Decrease growth arrow vectors 3D Price low down and up icon concept. Price low down and up icon concept. Interest low price 3d percent discount vector icon. Percentage with arrow up and down. Price low down and up icon concept. Interest low price 3d percent discount vector icon. Percentage with arrow up and down. 3D Web Vector Illustrations.
Free with trial A simple black graphic showing a bar chart with a downward trend line indicating financial loss. Decrease growth arrow illustrations Black bar chart with downward arrow showing negative business financial growth. A simple black graphic showing a bar chart with a downward trend line indicating. A simple black graphic showing a bar chart with a downward trend line indicating financial loss
Free with trial A 3D illustration of four golden coins with dollar signs, arranged above three red downward-pointing arrows, symbolizing financial decline or loss, isolated on a white background. Decrease growth arrow illustrations Four yellow coins with dollar signs and three red arrows pointing down, isolated on white background. A 3D illustration of four golden coins with dollar signs. A 3D illustration of four golden coins with dollar signs, arranged above three red downward-pointing arrows, symbolizing financial decline or loss, isolated on a white background
 Sign in