Free with trial Reduction chart icon vector icon on white background. EPS10. Decrease line graph vectors Reduction chartline in Thin line black color. flat simple vector symbols illustration. Reduction chart icon vector icon on white background. EPS10
Free with trial Discount percentage icon continuous outline drawing simple style finance vector art. Decrease line graph vectors Discount percentage icon continuous outline drawing simple style finance
Free with trial Reduction chart icon Vector symbol or sign set collection in black and white outline. Decrease line graph vectors Reduction chart icon Symbol mark in filled style. Reduction chart icon Vector symbol or sign set collection in black and white outline
Free with trial Reduction chart icon vector icon on white background. EPS10. Decrease line graph vectors Reduction chartline in Thin line black color. flat simple vector symbols illustration. Reduction chart icon vector icon on white background. EPS10
Free with trial Reduction chart icon vector icon on white background. EPS10. Decrease line graph vectors Reduction chartline in Thin line black color. flat simple vector symbols illustration. Reduction chart icon vector icon on white background. EPS10
Free with trial Reduction chart icon vector icon on white background. EPS10. Decrease line graph vectors Reduction chartline in Thin line black color. flat simple vector symbols illustration. Reduction chart icon vector icon on white background. EPS10
Free with trial Reduction chart icon vector icon on white background. EPS10. Decrease line graph vectors Reduction chartline in Thin line black color. flat simple vector symbols illustration. Reduction chart icon vector icon on white background. EPS10
Free with trial This 3d illustration of a floating dollar coin with a flying downward arrow line represents signs of market decline loss in value and financial downturn in a visual economic concept. Decrease line graph illustrations A floating dollar coin with a purple down arrow shows flying signs of financial loss and currency devaluation in 3d design. this 3d illustration of a floating dollar coin with a flying downward arrow line represents signs of market decline loss in value and financial downturn in a visual economic concept
Free with trial Red arrow going down stock icon on white background. Bankruptcy, financial market crash icon for your web site design, logo, app, UI. graph chart down trend symbol. chart going down sign. Decrease line graph vectors Red arrow going down stock icon on white background. Bankruptcy, financial market crash icon for your web site design
Free with trial Red arrow going down stock icon on white background. Bankruptcy, financial market crash icon for your web site design, logo, app, UI. graph chart down trend symbol. chart going down sign. Decrease line graph vectors Red arrow going down stock icon on white background. Bankruptcy, financial market crash icon for your web site design
Free with trial Multiple US dollar bills falling down like rain near a tattered American flag over a black background. A red downward trending stock market graph line shows economic instability, market decline. Generative Ai. Decrease line graph illustrations Multiple US dollar bills falling down like rain near a tattered American flag over a black background. A red downward trending
Free with trial Red 3d arrow going down stock icon on white background. Bankruptcy, financial market crash icon for your web site design, logo, app, UI. graph chart downtrend symbol. chart going down sign. Decrease line graph vectors Red 3d arrow going down stock icon on white background. Bankruptcy, financial market crash icon for your web site design. Red 3d arrow going down stock icon on white background. Bankruptcy, financial market crash icon for your web site design, logo, app, UI. graph chart downtrend symbol.chart going down sign.
Free with trial Realistic financial graphs index number analysis business investment market economy and trading concept. Generative AI glowing lines and diagram on digital screen charts crypto data blur light line. Decrease line graph illustrations Trading market financial graphs and glowing lines diagram on digital neural network AI generated art. Realistic financial graphs index number analysis business investment market economy and trading concept. Generative AI glowing lines and diagram on digital screen charts crypto data blur light line
Free with trial Realistic financial graphs index number analysis business investment market economy and trading concept. Generative AI glowing lines and diagram on digital screen charts crypto data blur light line. Decrease line graph illustrations Trading market financial graphs and glowing lines diagram on digital neural network AI generated art. Realistic financial graphs index number analysis business investment market economy and trading concept. Generative AI glowing lines and diagram on digital screen charts crypto data blur light line
Free with trial Realistic financial graphs index number analysis business investment market economy and trading concept. Generative AI glowing lines and diagram on digital screen charts crypto data blur light line. Decrease line graph illustrations Trading market financial graphs and glowing lines diagram on digital neural network AI generated art. Realistic financial graphs index number analysis business investment market economy and trading concept. Generative AI glowing lines and diagram on digital screen charts crypto data blur light line
Free with trial Realistic financial graphs index number analysis business investment market economy and trading concept. Generative AI glowing lines and diagram on digital screen charts crypto data blur light line. Decrease line graph illustrations Trading market financial graphs and glowing lines diagram on digital neural network AI generated art. Realistic financial graphs index number analysis business investment market economy and trading concept. Generative AI glowing lines and diagram on digital screen charts crypto data blur light line
Free with trial Realistic financial graphs index number analysis business investment market economy and trading concept. Generative AI glowing lines and diagram on digital screen charts crypto data blur light line. Decrease line graph illustrations Trading market financial graphs and glowing lines diagram on digital neural network AI generated art. Realistic financial graphs index number analysis business investment market economy and trading concept. Generative AI glowing lines and diagram on digital screen charts crypto data blur light line
Free with trial Realistic financial graphs index number analysis business investment market economy and trading concept. Generative AI glowing lines and diagram on digital screen charts crypto data blur light line. Decrease line graph illustrations Trading market financial graphs and glowing lines diagram on digital neural network AI generated art. Realistic financial graphs index number analysis business investment market economy and trading concept. Generative AI glowing lines and diagram on digital screen charts crypto data blur light line
Free with trial Realistic financial graphs index number analysis business investment market economy and trading concept. Generative AI glowing lines and diagram on digital screen charts crypto data blur light line. Decrease line graph illustrations Trading market financial graphs and glowing lines diagram on digital neural network AI generated art. Realistic financial graphs index number analysis business investment market economy and trading concept. Generative AI glowing lines and diagram on digital screen charts crypto data blur light line
Free with trial Realistic financial graphs index number analysis business investment market economy and trading concept. Generative AI glowing lines and diagram on digital screen charts crypto data blur light line. Decrease line graph illustrations Trading market financial graphs and glowing lines diagram on digital neural network AI generated art. Realistic financial graphs index number analysis business investment market economy and trading concept. Generative AI glowing lines and diagram on digital screen charts crypto data blur light line
Free with trial Illustrates a stock market crash with declining graphs and red arrows. Represents economic downturn, financial crisis, and recession. Symbolizes loss, risk, and negative trends in business. Decrease line graph illustrations Stock market crash financial crisis recession economic downturn red arrow graph chart diagram decline 2024. Illustrates a stock market crash with declining graphs and red arrows. Represents economic downturn, financial crisis, and recession. Symbolizes loss, risk, and negative trends in business.
Free with trial Reduction chart icon isolated on white background. Eps 10. Decrease line graph vectors Reduction Chart Icon Set. Downward graph vector symbol in a black filled and outlined style. Decline Trend Sign. Reduction chart icon isolated on white background. Eps 10
Free with trial Chat arrow down icon Vector set on white background. EPS 10. Decrease line graph vectors Chart arrow down icon set. decline downward chart vector symbol. stock trend downturn graph sign. negative economy bar Chart. Chat arrow down icon Vector set on white background. EPS 10
Free with trial Chat arrow down icon Vector set on white background. EPS 10. Decrease line graph vectors Chart arrow down icon set. decline downward chart vector symbol. stock trend downturn graph sign. negative economy bar Chart. Chat arrow down icon Vector set on white background. EPS 10
Free with trial Chat arrow down icon Vector set on white background. EPS 10. Decrease line graph vectors Chart arrow down icon set. decline downward chart vector symbol. stock trend downturn graph sign. negative economy bar Chart. Chat arrow down icon Vector set on white background. EPS 10
Free with trial Chat arrow down icon Vector set on white background. EPS 10. Decrease line graph vectors Chart arrow down icon set. decline downward chart vector symbol. stock trend downturn graph sign. negative economy bar Chart. Chat arrow down icon Vector set on white background. EPS 10
Free with trial Graph with financial data, line charts, and growth arrows on a grid background, indicating future trends for 2024 and 2025. 3D Rendering. Decrease line graph illustrations Financial Data Analysis with Growth Arrows and Global Map. 3D Rendering. Graph with financial data, line charts, and growth arrows on a grid background, indicating future trends for 2024 and 2025. 3D Rendering
Free with trial Set of vector solid icons related to loan, bank credit rate, finance and investment. Symbols for website or app ui, logo design, illustration. Decrease line graph vectors Vector solid icons of money credit and loan. Set of vector solid icons related to loan, bank credit rate, finance and investment. Symbols for website or app ui, logo design, illustration
Free with trial Isolated orange basketballs are stacked in descending vertical columns. 3D Rendering. Decrease line graph illustrations Isolated orange basketballs are stacked in descending vertical columns. 3D Rendering.
Free with trial Two drop and growth technology icon with gear. outline simple trend stats logotype graphic stroke art web design isolated on white. concept of key performance indicator or operation strategy symbol. Decrease line graph vectors Two drop and growth technology icon with gear
Free with trial Outline down chart icon isolated flat style design vector illustration on white background. Decrease line graph vectors Outline down chart icon isolated
Free with trial Minimalist vector illustration showing a black diagram with a downward arrow symbolizing economic decline, financial loss, recession, or negative business performance. Clean and modern design isolated on a white background, ideal for business presentations, financial reports, infographics, websites, mobile apps, and marketing materials related to economics, finance, investment, and analytics. Decrease line graph vectors . Minimalist vector illustration showing a black diagram with a downward arrow symbolizing economic decline, financial loss, recession, or negative business performance. Clean and modern design isolated on a white background, ideal for business presentations, financial reports, infographics, websites, mobile apps, and marketing materials related to economics, finance, investment, and analytics.
Free with trial Line and Glyph Vector Icons. Chart, Down Arrow, and Price Tag. Deflation, Price Drop for a Product or Service. Price Concept. Decrease line graph vectors Price Drop Icons. Line and Glyph Vector Icons. Chart, Down Arrow, and Price Tag. Deflation, Price Drop for a Product or Service. Price Concept
Free with trial Supply and demand chart drawn by businessman on the blackboard, eps10. Decrease line graph vectors Supply and demand chart drawn by businessman on the blackboard. Eps10
Free with trial Arrow Trending Down : Arrow trending down represents decline, decrease, or negative trend. Decrease line graph vectors Arrow Trending Down
Free with trial Business falling icon isolated on background vector illustration. Non AI Generate. Decrease line graph vectors Business falling icon isolated on background vector illustration.
Free with trial Comparing Bar Chart Data Analysis Icons vol 30444. Decrease line graph vectors Comparing Bar Chart Data Analysis Icons
Free with trial Wavy green arrows visualizing market movement, trend fluctuation, and economic volatility, depicting both growth and decline, ideal for financial data and business analytics concepts. Decrease line graph illustrations Wavy arrows showing up and down fluctuation trend. Wavy green arrows visualizing market movement, trend fluctuation, and economic volatility, depicting both growth and decline, ideal for financial data and business analytics concepts
Free with trial Hand raising a sign that says Rightward Direction drawn using engraving technique. Decrease line graph vectors Hand raising a sign that says Rightward Direction
Free with trial Flat icon showing a person, bars decreasing, and a downturn arrow next to a cross. Decrease line graph vectors Declining performance icon: person, bars, arrow, and cross. Flat icon showing a person, bars decreasing, and a downturn arrow next to a cross
Free with trial Candlestick chart icons on a digital trading screen showing market movements, price trends and investment data for finance, stock analysis, trading strategy and economic growth. Decrease line graph illustrations Candlestick chart displaying financial market data analysis. Candlestick chart icons on a digital trading screen showing market movements, price trends and investment data for finance, stock analysis, trading strategy and economic growth
Free with trial Set of icons representing data decline and financial loss business charts graphs arrows isolated. Decrease line graph vectors Modern data decline visualization icons with colorful gradient. Set of icons representing data decline and financial loss business charts graphs arrows isolated
Free with trial Chart illustrating performance trends with emotive faces, team photos, analytic symbols thumbs up an atom and checkmark. Ideal for teamwork, strategy, data, feedback, process, analysis charts. Decrease line graph vectors Business Performance Trends Featuring Emotional Reactions Across Team Members and Analytics. Chart illustrating performance trends with emotive faces, team photos, analytic symbols thumbs up an atom and checkmark. Ideal for teamwork, strategy, data, feedback, process, analysis charts
Free with trial Illustration of a growing business intelligence with a dashboard displaying high metrics, a stack of data chips, and a simple magnifying glass. Vector flat icon design on a white background for a data analysis illustration --chaos 30 --ar 16:9 --v 7 Job ID: cfbe4cc3-3bae-455f-ac79-f340192ae4d4. Decrease line graph illustrations Data Analysis and Reporting Concept Computer Screen with Charts and Magnifying Glass. Illustration of a growing business intelligence with a dashboard displaying high metrics, a stack of data chips, and a simple magnifying glass. Vector flat icon design on a white background for a data analysis illustration --chaos 30 --ar 16:9 --v 7 Job ID: cfbe4cc3-3bae-455f-ac79-f340192ae4d4
Free with trial Minimalist outline drawing of a bar chart representing data analysis and statistical information. Great for presentations and data representations. Decrease line graph vectors Simple Outline Bar Chart Sign Statistical Data Analysis Diagram Icon. Minimalist outline drawing of a bar chart representing data analysis and statistical information. Great for presentations and data representations.
Free with trial Sale discount icon continuous outline drawing simple style marketing white background. Decrease line graph vectors Sale discount icon continuous outline drawing simple style marketing
Free with trial Set of vector solid icons related to loan, bank credit rate, finance and investment. Symbols for website or app UI, logo design, illustration. Decrease line graph vectors Vector solid icons of money credit and loan. Set of vector solid icons related to loan, bank credit rate, finance and investment. Symbols for website or app UI, logo design, illustration
Free with trial Economic downturn, financial instability, business crisis, consumer spending, recovery, growth. Drooping plant with dotted line, dollar sign and shopping basket illustration. Economic downturn. Decrease line graph vectors Economic Decline and Recovery Concept with Drooping Plant, Dollar Sign, and Shopping Basket. Economic downturn, financial instability, business crisis, consumer spending, recovery, growth. Drooping plant with dotted line, dollar sign and shopping basket illustration. Economic downturn
Free with trial Set of sketched icons showing mutual fund nav increases and decreases with indian rupee signs on an alpha transparent base. Decrease line graph vectors Mutual fund nav trend sketch icons with rupee symbol alpha transparent. Set of sketched icons showing mutual fund nav increases and decreases with indian rupee signs on an alpha transparent base.
Free with trial Stacks of gold coins are arranged in a triangular formation on a white background. Above them, a large, upward-pointing arrow signifies growth and financial prosperity. The coins and arrow are illustrated in a uniform golden hue, symbolizing wealth and economic advancement. Decrease line graph vectors Financial Growth Concept with Stacks of Gold Coins and Upward Arrow. Financial Growth Gold Coins. Growth Chart. Stacks of gold coins are arranged in a triangular formation on a white background. Above them, a large, upward-pointing arrow signifies growth and financial prosperity. The coins and arrow are illustrated in a uniform golden hue, symbolizing wealth and economic advancement.
Free with trial The image showcases a smartphone displaying financial data visualizations, including line graphs and bar charts. Additional icons and graphics related to data analysis and finance surround the phone, emphasizing the digital and analytical nature of the content. This composition was generated by AI,. Decrease line graph illustrations Mobile Financial Data. The image showcases a smartphone displaying financial data visualizations, including line graphs and bar charts. Additional icons and graphics related to data analysis and finance surround the phone, emphasizing the digital and analytical nature of the content. This composition was generated by AI,
Free with trial Business finance and growth icons illustrating statistics charts trends progress and success. Decrease line graph vectors Finance and growth icons showing progress and business performance blue navy. Business finance and growth icons illustrating statistics charts trends progress and success
Free with trial Logo design graphic concept creative premium vector stock image top sell. Decrease line graph vectors Dollar money arrow up down chart diagram inflation rate risk market business. Logo design graphic concept creative premium vector stock image top sell
Free with trial Financial decline, coins falling, abstract design, graphic, stock photo. Decrease line graph illustrations Financial Growth Concept Golden Dollar Coins and Upward Trend Line on Dark Blue Background. Financial decline, coins falling, abstract design, graphic, stock photo
Free with trial Black glyph icon representing a broken downward arrow, symbolizing decline, financial crisis, market downturn, failure, or negative trends. Ideal for business presentations, economic reports, data visualization, infographics, and conceptual designs indicating loss, recession, or problems. Simple, clean graphic illustration on a white background. Generated by AI. Decrease line graph vectors Declining Trend Broken Downward Arrow Icon. Black glyph icon representing a broken downward arrow, symbolizing decline, financial crisis, market downturn, failure, or negative trends. Ideal for business presentations, economic reports, data visualization, infographics, and conceptual designs indicating loss, recession, or problems. Simple, clean graphic illustration on a white background. Generated by AI
Free with trial This image depicts a sound wave spectrum with various colors representing different frequencies and amplitudes. The left side of the image shows a dense cluster of pink and purple waves, indicating high amplitude and frequency. The middle section transitions to blue, showing a decrease in amplitude and frequency. The right side features turquoise waves, indicating lower frequency and amplitude. Decrease line graph illustrations Colorful sound wave spectrum. This image depicts a sound wave spectrum with various colors representing different frequencies and amplitudes. The left side of the image shows a dense cluster of pink and purple waves, indicating high amplitude and frequency. The middle section transitions to blue, showing a decrease in amplitude and frequency. The right side features turquoise waves, indicating lower frequency and amplitude
Free with trial Up and down percentage icon set. Percentage growth and decline icons. Percent arrow up and down icon. Decrease line graph vectors Up and down percentage icon set. Percentage growth and decline icons. Percent arrow up and down icon
Free with trial A detailed black and white illustration of a knitting pattern stitch chart. This graphical guide features a grid with various symbols, icons, and abbreviations like 'k2tog' and 'ssk', representing different knitting stitches and techniques. The chart is organized by rows and columns, providing a visual map for creating intricate designs, particularly in lace knitting. This image is ideal for crafting websites, DIY tutorials, knitting books, hobby blogs, and instructional materials related to needlework, textiles, and handmade crafts. Decrease line graph illustrations Knitting Pattern Stitch Chart
Free with trial A detailed red candlestick chart illustrating a consistent downward trend over time. Decrease line graph illustrations Red candlestick chart showing downward trend. A detailed red candlestick chart illustrating a consistent downward trend over time
Free with trial Professional Vector Logo Design High-Resolution & Fully Editable This high-quality vector logo is designed with precision and creativity making it ideal for modern businesses, startups, and creative professionals The design is clean, scalable, and easy to customize�perfect for branding marketing materials, websites, and print applications. Key Features:100% Vector format (AI EPS SVG)Fully editable (colors, text, and shapes)High resolution � perfect for both web and print Modern, professional, and versatile design Ready for branding and promotional use Elevate your brand with this premium quality logo!. Decrease line graph vectors Dementia icon editable stock vector logo design. Professional Vector Logo Design High-Resolution & Fully Editable This high-quality vector logo is designed with precision and creativity making it ideal for modern businesses, startups, and creative professionals The design is clean, scalable, and easy to customize�perfect for branding marketing materials, websites, and print applications. Key Features:100% Vector format (AI EPS SVG)Fully editable (colors, text, and shapes)High resolution � perfect for both web and print Modern, professional, and versatile design Ready for branding and promotional use Elevate your brand with this premium quality logo!
Free with trial This comprehensive vector icon set illustrates various financial market trends, economic indicators, and potential crises. Featuring line graphs, bar charts, pie charts, dollar signs, piggy banks, and warning sirens, the collection uses a striking red and black color palette to depict both growth and decline. Concepts like stock market volatility, investment risks, economic downturns, and business analytics are visually represented. Ideal for financial reports, business presentations, economic news, investment platforms, and educational materials requiring clear and impactful visual communication of market dynamics. Decrease line graph vectors Financial Market Trends and Crisis Vector Icons Set. This comprehensive vector icon set illustrates various financial market trends, economic indicators, and potential crises. Featuring line graphs, bar charts, pie charts, dollar signs, piggy banks, and warning sirens, the collection uses a striking red and black color palette to depict both growth and decline. Concepts like stock market volatility, investment risks, economic downturns, and business analytics are visually represented. Ideal for financial reports, business presentations, economic news, investment platforms, and educational materials requiring clear and impactful visual communication of market dynamics.
Free with trial A comprehensive vector icon set featuring essential symbols for business, finance, and data analysis. This collection includes various arrows for indicating growth and decline, wavy lines representing market trends, checkmarks for success or approval, X marks for errors or rejection, stopwatches for time management and efficiency, and stacks of coins with dollar signs for financial concepts. Ideal for presentations, infographics, web design, and reports to visually communicate progress, status, and economic indicators. Decrease line graph vectors Business, Finance, and Data Analytics Vector Icon Set. A comprehensive vector icon set featuring essential symbols for business, finance, and data analysis. This collection includes various arrows for indicating growth and decline, wavy lines representing market trends, checkmarks for success or approval, X marks for errors or rejection, stopwatches for time management and efficiency, and stacks of coins with dollar signs for financial concepts. Ideal for presentations, infographics, web design, and reports to visually communicate progress, status, and economic indicators.
Free with trial A professional 3D rendering of a bar chart representing a negative trend or financial loss. The illustration features three textured blue metallic columns with a prominent, jagged red arrow pointing downwards across them. This graphic symbolizes economic recession, market crashes, or decreasing sales figures. It is mounted on a sleek grey base and isolated on a white background, making it perfect for business presentations, investment risk analysis, and economic reports. Decrease line graph vectors 3D Downward Bar Chart with Red Arrow - Financial Loss & Recession Concept. A professional 3D rendering of a bar chart representing a negative trend or financial loss. The illustration features three textured blue metallic columns with a prominent, jagged red arrow pointing downwards across them. This graphic symbolizes economic recession, market crashes, or decreasing sales figures. It is mounted on a sleek grey base and isolated on a white background, making it perfect for business presentations, investment risk analysis, and economic reports.
Free with trial Vector illustration of a downward arrow symbolizing economic decline, recession, and financial downturn. Decrease line graph vectors Vector illustration of a downward arrow symbolizing economic decline, recession
Free with trial A stylized candlestick chart, commonly used in financial trading, is presented on a white background. The chart consists of several vertical bars, alternating in color between green (indicating an increase in price) and red (indicating a decrease in price). Each bar has a thin gold line extending from its top and bottom, representing wicks. Decrease line graph illustrations Candlestick Chart with Green and Red Bars on White Background stock market finance. A stylized candlestick chart, commonly used in financial trading, is presented on a white background. The chart consists of several vertical bars, alternating in color between green (indicating an increase in price) and red (indicating a decrease in price). Each bar has a thin gold line extending from its top and bottom, representing wicks
Free with trial Concept depicting financial security risk and economic recession. Decrease line graph illustrations Financial Security Risk Analysis Recession Under Scrutiny. Concept depicting financial security risk and economic recession.
Free with trial Conceptual icon depicting declining mental health or cognitive decline. Decrease line graph illustrations Declining Mental Health Brain, Chart, Magnifying Glass Icon. Conceptual icon depicting declining mental health or cognitive decline.
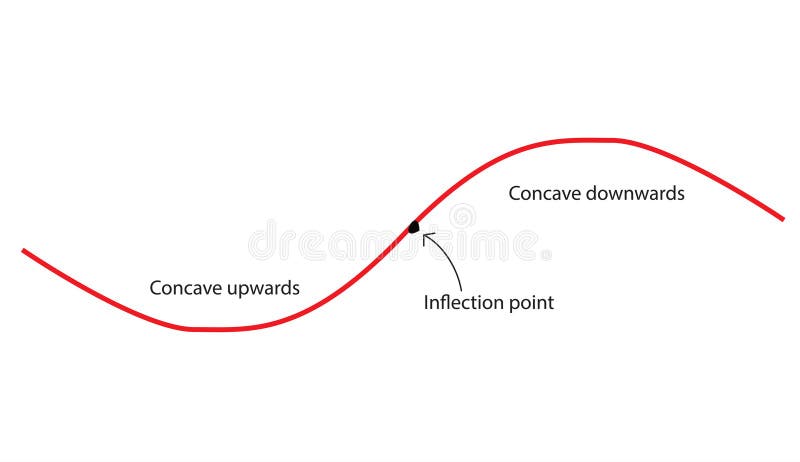
Free with trial Concavity of curve. Inflection point, concave down and concave up. Second derivative tangent lines of function. Decrease line graph vectors Concavity of curve
Free with trial A flat design vector illustration depicting a financial market data board or stock ticker. The black-bordered display features various stock symbols, numerical values like '$ ,80K', '$ ,22,50', and indicators of market performance. Prominently highlighted in red is the word 'LOSING', accompanied by a red downward arrow signifying a price drop, and a red downward triangle. Conversely, a green upward arrow indicates a price increase. This icon effectively visualizes concepts of financial loss, gain, market volatility, and investment trends, suitable for business, finance, and economic content. Decrease line graph illustrations Financial Market Data Board Icon with Loss and Gain Indicators. A flat design vector illustration depicting a financial market data board or stock ticker. The black-bordered display features various stock symbols, numerical values like '$ ,80K', '$ ,22,50', and indicators of market performance. Prominently highlighted in red is the word 'LOSING', accompanied by a red downward arrow signifying a price drop, and a red downward triangle. Conversely, a green upward arrow indicates a price increase. This icon effectively visualizes concepts of financial loss, gain, market volatility, and investment trends, suitable for business, finance, and economic content.
Free with trial A prominent 3D metallic US dollar sign stands against a dynamic digital background featuring various financial charts and graphs. The background displays a fluctuating line graph and a colorful bar chart, symbolizing market trends, economic data, and investment performance. This image powerfully conveys concepts of finance, global economy, currency strength, stock market analysis, and wealth management in a modern, digital context. Ideal for illustrating reports, presentations, or articles related to business, banking, and financial growth. Decrease line graph illustrations US Dollar Symbol with Digital Financial Charts and Market Data. A prominent 3D metallic US dollar sign stands against a dynamic digital background featuring various financial charts and graphs. The background displays a fluctuating line graph and a colorful bar chart, symbolizing market trends, economic data, and investment performance. This image powerfully conveys concepts of finance, global economy, currency strength, stock market analysis, and wealth management in a modern, digital context. Ideal for illustrating reports, presentations, or articles related to business, banking, and financial growth.
Free with trial Arrow Direction and Percentage Icons for Business Growth Concept. Decrease line graph illustrations Arrow Direction and Percentage Icons for Business Growth Concept
Free with trial Red and green candlestick chart shows a descending pattern against a black background, creating a dramatic financial illustration for use in economic or investment themed visuals. Decrease line graph illustrations Descending Chart Pattern with Red and Green Candlesticks on Black. Red and green candlestick chart shows a descending pattern against a black background, creating a dramatic financial illustration for use in economic or investment themed visuals
Free with trial A 3D rendered illustration of a stock market candlestick chart is shown against a light blue background. The chart displays a mix of red and green candlesticks, indicating price fluctuations. A prominent red arrow points downwards, signifying a market decline. A white zigzag line also charts a downward trend. To the right, a red exclamation mark and a red dot serve as a warning or alert symbol. Decrease line graph illustrations 3D Rendered Stock Market Candlestick Chart with Falling Red Arrow and Exclamation Mark finance. A 3D rendered illustration of a stock market candlestick chart is shown against a light blue background. The chart displays a mix of red and green candlesticks, indicating price fluctuations. A prominent red arrow points downwards, signifying a market decline. A white zigzag line also charts a downward trend. To the right, a red exclamation mark and a red dot serve as a warning or alert symbol
Free with trial Several dark, pointed arrow shapes are patterned diagonally across a light background. The arrows point downwards, suggesting a trend or direction. Decrease line graph illustrations Downward Trend Shown With Repeating Arrow Shapes on a Plain Background. Several dark, pointed arrow shapes are patterned diagonally across a light background. The arrows point downwards, suggesting a trend or direction.
Free with trial A close-up view of black financial and business chart icons arranged in a grid on a light background. Decrease line graph illustrations Close-up of financial and business chart icons on a grid finance charts. A close-up view of black financial and business chart icons arranged in a grid on a light background
Free with trial Arrow Up Down Icon North South Upward Downward Pointer Scale Rise Fall Elevator Sign Symbol Growth Scroll Gesture Position Navigation Location Sign. Decrease line graph vectors Arrow Up Down Icon North South Upward Downward Pointer Scale Rise Fall Elevator Sign Symbol Growth Scroll Gesture
Free with trial Illustration of a business activities. Decrease line graph vectors Illustration of a business activities
Free with trial Illustration of a business activities. Decrease line graph vectors Illustration of a business activities