Free with trial Report, 3D Chart, Block diagram and Dot Plot graph linear icons. Design shape elements. Charts and Diagrams line icons. Trend, Pyramid and Pie chart report symbols. Vector. Decrease line vectors Charts and Diagrams line icons. Set of 3D Chart, Block diagram and Dot Plot graph icons. Design elements. Vector. Report, 3D Chart, Block diagram and Dot Plot. Report, 3D Chart, Block diagram and Dot Plot graph linear icons. Design shape elements. Charts and Diagrams line icons. Trend, Pyramid and Pie chart report symbols. Vector
Free with trial Descending data analytics line graphic outline icon in white and black colors. descending data analytics line graphic flat vector icon from business collection for web, mobile apps and ui. Decrease line vectors Descending data analytics line graphic outline icon in white and black colors. descending data analytics line graphic flat vector. Icon from business collection. descending data analytics line graphic outline icon in white and black colors. descending data analytics line graphic flat vector icon from business collection for web, mobile apps and ui.
Free with trial Diagram chart line icon. Neumorphic, Flat shadow, 3d buttons. Presentation graph sign. Market analytics symbol. Line diagram chart icon. Social media icons. Vector. Decrease line vectors Diagram chart line icon. Presentation graph sign. Neumorphic buttons. Vector. Diagram chart line icon. Neumorphic, Flat shadow, 3d buttons. Presentation graph. Diagram chart line icon. Neumorphic, Flat shadow, 3d buttons. Presentation graph sign. Market analytics symbol. Line diagram chart icon. Social media icons. Vector
Free with trial Hand interacting with a red downward trend line against a blue bar graph background image. Generative AI. Decrease line illustrations Hand interacting with a red downward trend line against a blue bar graph background image. Generative AI
Free with trial A 3D rendered bar chart with yellow, pink, and teal bars stands against a light purple background. A purple magnifying glass with a yellow handle is positioned over the chart, suggesting analysis. A thin line with pink dots connects the tops of the bars, indicating a trend. Decrease line illustrations 3D Bar Chart with Magnifying Glass and Trend Line on Purple Background graph statistics. A 3D rendered bar chart with yellow, pink, and teal bars stands against. A 3D rendered bar chart with yellow, pink, and teal bars stands against a light purple background. A purple magnifying glass with a yellow handle is positioned over the chart, suggesting analysis. A thin line with pink dots connects the tops of the bars, indicating a trend
Free with trial 3D rendering of declining bar and line graphs on a grid background. AI generated. Decrease line illustrations 3D rendering of declining bar and line graphs on a grid background. AI generated
Free with trial Human Interaction and Movement Line Icon Set. Social Dynamics, Communication, Group Behavior Outline Symbol Collection. Growth and Movement Concept. Editable Stroke. Isolated Vector Illustration. Decrease line vectors Human Interaction and Movement Line Icon Set. Social Dynamics, Communication, Group Behavior Outline Symbol Collection. Growth and Movement Concept. Editable
Free with trial Graph line icon. Halftone dotted pattern. Gradient icon with grain shadow. Column chart sign. Growth diagram symbol. Line graph chart icon. Various designs. Vector. Decrease line vectors Graph line icon. Column chart sign. Halftone dotted pattern. Vector. Graph line icon. Halftone dotted pattern. Gradient icon with grain shadow. Column chart sign. Graph line icon. Halftone dotted pattern. Gradient icon with grain shadow. Column chart sign. Growth diagram symbol. Line graph chart icon. Various designs. Vector
Free with trial Hand-drawn line chart doodle is showing grid backdrop and axis over gradient background, copy space. Data visualization, infographics, analytics, diagram, business, educational, minimalistic. Decrease line illustrations Hand-drawn line chart doodle is showing grid backdrop and axis over gradient background, copy space. Data visualization, infographics, analytics, diagram
Free with trial Set line Worker, Credit card, Global economic crisis and. Business infographic template. Vector. Decrease line vectors Set line Worker, Credit card, Global economic crisis and . Business infographic template. Vector.
Free with trial Business chart icon set with graph, statistic, line and bar diagram for finance or analysis. Pie graphics with horizontal and donut layout for data growth. Vector report for trend or economy by pictogram scheme. Decrease line vectors Business chart icon set with graph, statistic, line and bar diagram for finance or analysis. Pie graphics with. Horizontal and donut layout for data growth. Business chart icon set with graph, statistic, line and bar diagram for finance or analysis. Pie graphics with horizontal and donut layout for data growth. Vector report for trend or economy by pictogram scheme.
Free with trial Indentation Decrease Icon with Arrow Indicating Text Alignment to the Left Margin Illustration. AI generated. Decrease line vectors Indentation Decrease Icon with Arrow Indicating Text Alignment to the Left Margin Illustration. AI generated
Free with trial Electric power, Charge station and Electricity price inflation set. Design shape elements. Energy line icons. Eco energy, efficiency consumption and saving electricity line icons. Vector. Decrease line illustrations Energy line icons. Electric power, Charge station and Electricity price inflation set. Design elements. Vector. Electric power, Charge station and Electricity. Electric power, Charge station and Electricity price inflation set. Design shape elements. Energy line icons. Eco energy, efficiency consumption and saving electricity line icons. Vector
Free with trial Illustration of up and down percentage arrow line icon. Percentage arrow with percent sign. Design concept for banking, credit, interest rates, finance and financial fields. isolated white background. Decrease line illustrations Illustration of up and down percentage arrow line icon. Percentage arrow with percent sign. Design concept for banking, credit, interest rates, finance and
Free with trial Decreasing line graphic. Square point Vector. Minimalist progress chart. Data sequence illustration. EPS 10. Decrease line vectors Decreasing line graphic. Square point Vector. Minimalist progress chart. Data sequence illustration. EPS 10
Free with trial Loan interest rate doodle icon set. Hand drawn sketch doodle line style bank money loan interest rate icon for house, car discount percentage concept. Trendy cute element. Vector illustration. Decrease line vectors Loan interest rate doodle icon set. Hand drawn sketch doodle line style bank money loan interest rate icon for house. Car discount percentage concept. Trendy. Loan interest rate doodle icon set. Hand drawn sketch doodle line style bank money loan interest rate icon for house, car discount percentage concept. Trendy cute element. Vector illustration
Free with trial Decreasing line graphic. Circle point Vector. Minimalist growth chart. Data progression illustration. EPS 10. Decrease line vectors Decreasing line graphic. Circle point Vector. Minimalist growth chart. Data progression illustration. EPS 10
Free with trial Clock With Up And Down Arrows Line And Solid Icon Set. Time Management, Scheduling, And Priority Adjustment Symbol Collection. Efficiency And Productivity Enhancement. Isolated Vector Illustration. Decrease line vectors Clock With Up And Down Arrows Line And Solid Icon Set. Time Management, Scheduling, And Priority Adjustment Symbol. Collection. Efficiency And Productivity. Clock With Up And Down Arrows Line And Solid Icon Set. Time Management, Scheduling, And Priority Adjustment Symbol Collection. Efficiency And Productivity Enhancement. Isolated Vector Illustration.
Free with trial Set line Old hourglass with sand Arrow Location Layers Clock Intersection point and icon. Vector. Decrease line illustrations Set line Old hourglass with sand, Arrow, Location, Layers, Clock, Intersection point and icon. Vector. Set line Old hourglass with sand Arrow Location Layers. Set line Old hourglass with sand Arrow Location Layers Clock Intersection point and icon. Vector.
Free with trial This image shows a falling graph behind a diamond, representing the decrease in the value of precious stones. It's suitable for illustrating financial losses. Decrease line vectors Illustration of a falling graph behind a diamond, symbolizing a decrease in the value of precious stones. This image shows a falling graph behind a diamond. This image shows a falling graph behind a diamond, representing the decrease in the value of precious stones. It's suitable for illustrating financial losses
Free with trial Percent up and down icon on circle line. Percentage arrow growth and decline sign symbol. Vector. Decrease line vectors Percent up and down icon on circle line. Percentage arrow growth and decline sign symbol. Vector
Free with trial Business Analytics And Data Visualization Line Icon Set. Financial Growth, Market Trends, And Performance Analysis Outline Symbol Collection. Editable Stroke. Isolated Vector Illustration. Decrease line vectors Business Analytics And Data Visualization Line Icon Set. Financial Growth, Market Trends, And Performance Analysis. Outline Symbol Collection. Editable Stroke. Business Analytics And Data Visualization Line Icon Set. Financial Growth, Market Trends, And Performance Analysis Outline Symbol Collection. Editable Stroke. Isolated Vector Illustration.
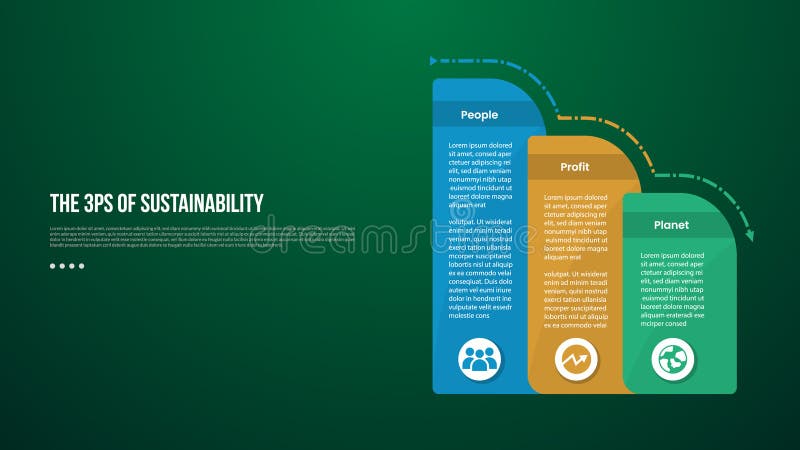
Free with trial The 3 Ps of Sustainability infographic template with round box container decrease gradually with dark background style with 3 point for slide presentation vector. Decrease line illustrations The 3 Ps of Sustainability infographic template with round box container decrease gradually with dark background style with 3. Point for slide presentation
Free with trial Percentage growth and decline icons set. Percent arrow up and down flat and line style symbols collection - stock vector. Decrease line illustrations Percentage growth and decline icons set. Percent arrow up and down flat and line style symbols collection - stock vector
Free with trial Reduction chart icon Black line art vector in black and white outline set collection sign. Decrease line vectors Decline Chart Icon Illustrating Decrease in Performance, Economic Downturn, and Analytical Data. Reduction chart icon Black line art vector in black and white. Reduction chart icon Black line art vector in black and white outline set collection sign
Free with trial Declining bar graph illustrating business recession trend or financial downturn with line chart overlay. AI generated. Decrease line vectors Declining bar graph illustrating business recession trend or financial downturn with line chart overlay. AI generated
Free with trial Charts and graphs, Presentation and Report. Graph line icons. Analytics linear icon set. Line icons set. Vector. Decrease line illustrations Graph line icons. Charts and graphs, Presentation and Report. Linear icon set. Line icons. Vector. Charts and graphs, Presentation and Report. Graph line icons. Charts and graphs, Presentation and Report. Graph line icons. Analytics linear icon set. Line icons set. Vector
Free with trial Charts and graphs, Presentation and Report. Graph line icons. Analytics linear icon set. Line icons set. Vector. Decrease line illustrations Graph line icons. Charts and graphs, Presentation and Report. Linear icon set. Line icons. Vector. Charts and graphs, Presentation and Report. Graph line icons. Charts and graphs, Presentation and Report. Graph line icons. Analytics linear icon set. Line icons set. Vector
Free with trial Column chart sign. Salaryman, gender equality and alert bell outline icons. Decreasing graph line icon. Crisis diagram symbol. Spy or profile placeholder icon. Vector. Decrease line vectors Decreasing graph line icon. Crisis chart sign. Salaryman, gender equality and alert bell. Vector. Column chart sign. Salaryman, gender equality and alert bell. Column chart sign. Salaryman, gender equality and alert bell outline icons. Decreasing graph line icon. Crisis diagram symbol. Decreasing graph line sign. Spy or profile placeholder icon. Vector
Free with trial Column chart sign. Salaryman, gender equality and alert bell outline icons. Decreasing graph line icon. Crisis diagram symbol. Spy or profile placeholder icon. Vector. Decrease line illustrations Decreasing graph line icon. Crisis chart sign. Salaryman, gender equality and alert bell. Vector. Column chart sign. Salaryman, gender equality and alert bell. Column chart sign. Salaryman, gender equality and alert bell outline icons. Decreasing graph line icon. Crisis diagram symbol. Decreasing graph line sign. Spy or profile placeholder icon. Vector
Free with trial Percentage rate arrow icon set. Percent arrow up and down symbol. Price increase and decrease vector illustration. Profit sign. Up and down arrows with percentage pictogram. Financial growth concept. Decrease line vectors Percentage rate arrow icon set. Percent arrow up and down symbol. Price increase and decrease vector illustration. Profit sign. Up. And down arrows with. Percentage rate arrow icon set. Percent arrow up and down symbol. Price increase and decrease vector illustration. Profit sign. Up and down arrows with percentage pictogram. Financial growth concept
Free with trial Set line Server with shield, Mobile and password, Cost reduction and Sales funnel gear on seamless pattern. Vector. Decrease line illustrations Set line Server with shield, Mobile and password, Cost reduction and Sales funnel gear on seamless pattern. Vector.
Free with trial The image features two glossy, metallic red arrows pointing downwards against a stark black background. The arrows appear to be three dimensional with a reflective surface. They suggest a decline, decrease, or a negative trend. Decrease line vectors Two Glossy Red Arrows Pointing Downwards on a Black Background Representing a Sharp Decrease or a Sharp Negative Trend. The image features two glossy, metallic. The image features two glossy, metallic red arrows pointing downwards against a stark black background. The arrows appear to be three dimensional with a reflective surface. They suggest a decline, decrease, or a negative trend
Free with trial Set line Cloud download technology data transfer Secure your site with HTTPS SSL Search engine Browser incognito window Server Data New chat messages notification and setting icon. Vector. Decrease line illustrations Set line Cloud download, technology data transfer, Secure your site with HTTPS, SSL, Search engine, Browser incognito. Set line Cloud download technology data. Set line Cloud download technology data transfer Secure your site with HTTPS SSL Search engine Browser incognito window Server Data New chat messages notification and setting icon. Vector.
Free with trial Set line Storm Prison cell door Global economic crisis Shutdown of factory Stop delivery cargo truck Dollar rate decrease and Gold bars icon. Vector. Decrease line illustrations Set line Storm, Prison cell door, Global economic crisis, Shutdown of factory, Stop delivery cargo truck, Dollar rate. Set line Storm Prison cell door Global. Set line Storm Prison cell door Global economic crisis Shutdown of factory Stop delivery cargo truck Dollar rate decrease and Gold bars icon. Vector.
Free with trial Color Financial growth decrease icon isolated on white background. Increasing revenue. Flat filled outline style with shadow. Vector. Decrease line illustrations Color Financial growth decrease icon isolated on white background. Increasing revenue. Flat filled outline style with. Shadow. Vector
Free with trial Set line Website with stocks market Search engine Browser setting Financial growth increase window Photo retouching and mail and icon. Vector. Decrease line vectors Set line Website with stocks market, Search engine, Browser setting, Financial growth increase, window, Photo retouching. Set line Website with stocks market. Set line Website with stocks market Search engine Browser setting Financial growth increase window Photo retouching and mail and icon. Vector.
Free with trial A set of line art icons illustrating financial growth, investment strategies, and market analysis, perfect for business presentations and reports with clean design. Decrease line vectors Vector art of line art icons depicting financial growth, investment strategies, and market analysis, ideal for illustrating. A set of line art icons illustrating. A set of line art icons illustrating financial growth, investment strategies, and market analysis, perfect for business presentations and reports with clean design
Free with trial Line Graph Chart Icon. Data Analysis, Business Growth, And Statistical Trends Outline Symbol. Financial Performance Tracking. Editable Stroke. Isolated Vector Illustration. Decrease line vectors Line Graph Chart Icon. Data Analysis, Business Growth, And Statistical Trends Outline Symbol. Financial Performance. Tracking. Editable Stroke. Isolated Vector
Free with trial A striking depiction of a downward trend represented by a red graph line on a textured background, symbolizing market decline ,Generative AI. Decrease line illustrations A striking depiction of a downward trend represented by a red graph line on a textured background, symbolizing market decline. Generative AI
Free with trial Glowing neon line Global economic crisis news icon isolated on brick wall background. World finance crisis. Vector. Decrease line illustrations Glowing neon line Global economic crisis news icon isolated on brick wall background. World finance crisis. Vector.
Free with trial Set line Pie chart infographic Graph chart diagram Location Hierarchy organogram Arrow and icon. Vector. Decrease line vectors Set line Pie chart infographic, Graph, chart, diagram, Location, Hierarchy organogram, Arrow and icon. Vector. Set line Pie chart infographic Graph chart diagram. Set line Pie chart infographic Graph chart diagram Location Hierarchy organogram Arrow and icon. Vector.
Free with trial Purple and gray light graph. Motion. A point moving along a graph line that goes up and down in animation. High quality 4k footage. Decrease line illustrations Purple and gray light graph. Motion.A point moving along a graph line that goes up and down in animation. High quality 4k footage
Free with trial Purple and gray light graph. Motion. A point moving along a graph line that goes up and down in animation. High quality 4k footage. Decrease line illustrations Purple and gray light graph. Motion.A point moving along a graph line that goes up and down in animation. High quality 4k footage
Free with trial A creative composition featuring global market decline visualization a bar graph and line chart showing a decreasing trend overlaid on a world map. Generative AI. Decrease line illustrations Global market decline visualization a bar graph and line chart showing a decreasing trend overlaid on a world map. Generative AI. A creative composition. A creative composition featuring global market decline visualization a bar graph and line chart showing a decreasing trend overlaid on a world map. Generative AI
Free with trial Downward trending line graph displayed on digital screen. Financial decline visualized with red charts numbers representing loss. Business downturn economic recession or market. Decrease line illustrations Downward trending line graph displayed on digital screen. Financial decline visualized with red charts numbers representing loss. Business downturn economic
Free with trial Trend to go down chart thin line icon, world sanction concept. Vector graphics. Dollar currency graph, market pressure sign on white background, style mobile or design. Decrease line vectors Trend to go down chart thin line icon, world sanction concept. Vector graphics. Dollar currency graph, market pressure. Sign on white background, style mobile
Free with trial Approved application, Scissors cutting ribbon, Artificial intelligence icons. Design shape elements. Chef hat, Customer survey, Fast delivery line icons. Vector. Decrease line vectors Chef hat, Customer survey, Fast delivery line icons. Approved application, Scissors cutting ribbon Vector. Approved application, Scissors cutting ribbon. Approved application, Scissors cutting ribbon, Artificial intelligence icons. Design shape elements. Chef hat, Customer survey, Fast delivery line icons. Vector
Free with trial A Bitcoin piggy bank with a downward trend line, representing cryptocurrency decline, financial loss in the market, and the risks associated with digital investments. Decrease line vectors Vector art of bitcoin piggy bank with a downward trend line, representing cryptocurrency decline or financial loss in the market. A Bitcoin piggy bank with a. A Bitcoin piggy bank with a downward trend line, representing cryptocurrency decline, financial loss in the market, and the risks associated with digital investments
Free with trial A minimalist illustration shows a cracked, dry potato field with a graph line fading downwards, symbolizing a dropping harvest. Decrease line illustrations A minimalist illustration shows a cracked, dry potato field with a graph line fading downwards. Symbolizing a dropping harvest
Free with trial Loan Related and Investment Line Vector Icon. Investment, Percentage, Interest Rate. Low total cost icon vector image. Thin Outline Vector illustration isolated on background. Decrease line vectors Loan Related and Investment Line Vector Icon. Investment, Percentage, Interest Rate. Low total cost icon vector image. Thin Outline Vector illustration
Free with trial Loan Related and Investment Line Vector Icon. Investment, Percentage, Interest Rate. Low total cost icon vector image. Thin Outline Vector illustration isolated on background. Decrease line vectors Loan Related and Investment Line Vector Icon. Investment, Percentage, Interest Rate. Low total cost icon vector image. Thin Outline Vector illustration
Free with trial Loan Related and Investment Line Vector Icon. Investment, Percentage, Interest Rate. Low total cost icon vector image. Thin Outline Vector illustration isolated on background. Decrease line vectors Loan Related and Investment Line Vector Icon. Investment, Percentage, Interest Rate. Low total cost icon vector image. Thin Outline Vector illustration
Free with trial Loan Related and Investment Line Vector Icon. Investment, Percentage, Interest Rate. Low total cost icon vector image. Thin Outline Vector illustration isolated on background. Decrease line vectors Loan Related and Investment Line Vector Icon. Investment, Percentage, Interest Rate. Low total cost icon vector image. Thin Outline Vector illustration
Free with trial Loan Related and Investment Line Vector Icon. Investment, Percentage, Interest Rate. Low total cost icon vector image. Thin Outline Vector illustration isolated on background. Decrease line vectors Loan Related and Investment Line Vector Icon. Investment, Percentage, Interest Rate. Low total cost icon vector image. Thin Outline Vector illustration
Free with trial Pop art line Global economic crisis icon isolated on color background. World finance crisis. Vector. Decrease line illustrations Pop art line Global economic crisis icon isolated on color background. World finance crisis. Vector.
Free with trial Clean red line graph shows a steep decline against white, emphasizing negative space. Decrease line illustrations Minimalist red line graph showing sharp decline on white background, clean lines, negative space. Clean red line graph shows a steep decline against white. Clean red line graph shows a steep decline against white, emphasizing negative space.
Free with trial Clean red line graph shows a steep decline against white, emphasizing negative space. Decrease line illustrations Minimalist red line graph showing sharp decline on white background, clean lines, negative space. Clean red line graph shows a steep decline against white. Clean red line graph shows a steep decline against white, emphasizing negative space.
Free with trial Glowing neon line Global economic crisis icon isolated on black background. World finance crisis. Vector. Decrease line illustrations Glowing neon line Global economic crisis icon isolated on black background. World finance crisis. Vector.
Free with trial Graph and diagram from boats with decrease. Finance and business concept. 3D Illustration. 3D rendering on blue background. Decrease line illustrations Graph and diagram from boats with decrease. Finance and business concept. 3D Illustration.3D rendering. On blue background
Free with trial Graph and diagram from planes with decrease. Finance and business concepts. 3D Illustration isolated. 3D rendering on blue background. Decrease line illustrations Graph and diagram from planes with decrease. Finance and business concepts. 3D Illustration isolated. 3D rendering on blue background
Free with trial Colorful line graph showing growth and decline of different data from 2018, 2019 and 2020, providing a visual. Representation of performance trends over time. Decrease line vectors Colorful line graph showing growth and decline of different data from 2018, 2019 and 2020, providing a visual. Representation of performance trends over time
Free with trial Filled outline Financial growth decrease icon isolated on white background. Increasing revenue. Vector. Decrease line vectors Filled outline Financial growth decrease icon isolated on white background. Increasing revenue. Vector.
Free with trial Glowing neon line Global economic crisis icon isolated on brick wall background. World finance crisis. Vector. Decrease line illustrations Glowing neon line Global economic crisis icon isolated on brick wall background. World finance crisis. Vector.
Free with trial A financial performance dashboard for Q1 2024 displaying key metrics and trends. Revenue growth is up by 12. 5 at 2. 45 million. Net profit margin stands at 18. 4 totaling 450 000. Operating expenses decrease by 3. 2 to 1. 2 million. ROI is 22. 7. A line graph shows quarterly revenue trends while a pie chart details expense breakdown 50 COGS 20 marketing 15 R D. Regional sales bar chart highlights performance North America 9. 5M Europe 9. 1M. Strategic milestones timeline lists key events. Budget variance graph compares planned vs. actual figures for sales and HR. Decrease line illustrations Net profit margin stands at 18.4 totaling 450 000. Operating. A financial performance dashboard for Q1 2024 displaying key metrics and trends. Revenue growth is. A financial performance dashboard for Q1 2024 displaying key metrics and trends. Revenue growth is up by 12.5 at 2.45 million. Net profit margin stands at 18.4 totaling 450 000. Operating expenses decrease by 3.2 to 1.2 million. ROI is 22.7. A line graph shows quarterly revenue trends while a pie chart details expense breakdown 50 COGS 20 marketing 15 R D. Regional sales bar chart highlights performance North America 9.5M Europe 9.1M. Strategic milestones timeline lists key events. Budget variance graph compares planned vs. actual figures for sales and HR.
Free with trial Line Global economic crisis icon isolated on white background. World finance crisis. Colorful outline concept. Vector. Decrease line vectors Line Global economic crisis icon isolated on white background. World finance crisis. Colorful outline concept. Vector.
Free with trial A dramatic illustration of a stock market crash, featuring a sharp, red line graph plummeting downwards. This image symbolizes financial downfall, economic recession, and investment risk in business. Decrease line illustrations Stock market crash red line graph financial downfall economic recession business loss investment risk chart 2024. A dramatic illustration of a stock market crash. A dramatic illustration of a stock market crash, featuring a sharp, red line graph plummeting downwards. This image symbolizes financial downfall, economic recession, and investment risk in business.
Free with trial Graph and diagram from planes with decrease. Finance and business concept. 3D Illustration. 3D rendering on blue background. Decrease line illustrations Graph and diagram from planes with decrease. Finance and business concept. 3D Illustration.3D rendering. On blue background
Free with trial Oil Price Decline Concept. Oil barrel with falling arrow symbolizing decrease in oil price. Decrease line vectors Oil Price Decline Concept. Oil barrel with falling arrow symbolizing decrease in oil price
Free with trial Downward trend, symbolic chart for falling prices. Decreasing red line of a diagram falls with fluctuations into the bottomless, indicating sudden heavy losses, bursting bubbles and downward movement. Decrease line vectors Downward trend, symbolic chart for falling prices. Decreasing red line of a diagram falls with fluctuations into the bottomless, indicating sudden heavy losses
Free with trial Finance, analytics and market trends. Falling bar chart and line graph showing volatility and decline. Ideal for economic reports and trading visuals. Modern blue gradient vector illustration. Decrease line vectors Financial declining chart with bars and line graph, stock market analytics vector. Finance, analytics and market trends. Falling bar chart and line graph showing. Finance, analytics and market trends. Falling bar chart and line graph showing volatility and decline. Ideal for economic reports and trading visuals. Modern blue gradient vector illustration.
Free with trial Abstract financial chart with downtrend line graph and arrow in stock market on red color background. Decrease line illustrations Financial chart with downtrend line graph and arrow in stock market. Abstract financial chart with downtrend line graph and arrow in stock market on red color. abstract financial chart with downtrend line graph and arrow in stock market on red color background
Free with trial Financial chart with downtrend line graph in stock market on red color background. Downtrend line graph in stock market on red color background. Decrease line illustrations Financial chart with downtrend line graph in stock market on red color background. Downtrend line graph in stock market on red color background
Free with trial Financial chart with downtrend line graph in stock market on red color background. Downtrend line graph in stock market on red color background. Decrease line illustrations Financial chart with downtrend line graph in stock market on red color background. Downtrend line graph in stock market on red color background
Free with trial Line icon of low battery representing fatigue, low energy, exhaustion, and burnout. Suitable for health, mental wellness, productivity, and lifestyle topics. Decrease line vectors Fatigue Low Battery Energy Exhaustion Icon Burnout Tiredness Symbol. Line icon of low battery representing fatigue, low energy, exhaustion, and burnout. Suitable. Line icon of low battery representing fatigue, low energy, exhaustion, and burnout. Suitable for health, mental wellness, productivity, and lifestyle topics.
Free with trial Geometric pattern featuring alternating rectangular blocks in vivid magenta, teal, black, and white. The design creates an optical illusion of depth and a tunnel effect, as the rectangles decrease in size toward the center. The bold contrast of colors and shapes generates a dynamic visual impact. Decrease line illustrations A rectangle pattern of colourful lines reducing in size. Geometric pattern featuring alternating rectangular blocks in vivid magenta, teal, black, and white. Geometric pattern featuring alternating rectangular blocks in vivid magenta, teal, black, and white. The design creates an optical illusion of depth and a tunnel effect, as the rectangles decrease in size toward the center. The bold contrast of colors and shapes generates a dynamic visual impact.
Free with trial Line icon of low battery representing fatigue, low energy, exhaustion, and burnout. Suitable for health, mental wellness, productivity, and lifestyle topics. Decrease line vectors Fatigue Low Battery Energy Exhaustion Icon Burnout Tiredness Symbol black gray. Line icon of low battery representing fatigue, low energy, exhaustion, and. Line icon of low battery representing fatigue, low energy, exhaustion, and burnout. Suitable for health, mental wellness, productivity, and lifestyle topics.
Free with trial Financial chart with downtrend line graph in circuit breakers stock market on red color background. Downtrend line graph in circuit breakers stock market on red. Decrease line illustrations Financial chart with downtrend line graph in circuit breakers stock market on red color background. Downtrend line graph in circuit breakers stock market on red
Free with trial Financial chart with downtrend line graph in circuit breakers stock market on red color background. Downtrend line graph in circuit breakers stock market on red. Decrease line illustrations Financial chart with downtrend line graph in circuit breakers stock market on red color background. Downtrend line graph in circuit breakers stock market on red
Free with trial Icons depicting different speaker and volume settings. The top row includes a speaker with a diagonal line indicating mute, followed by increasing sound waves to suggest volume levels. The bottom row has variations including a speaker with a prohibition sign for no sound, and additional icons indicating volume adjustments or settings with symbols like an 'x' for off, '+' for increase, and '-' for decrease. These icons are simple, black, and designed for user interface purposes. Decrease line vectors Minimal Sound and Volume Control Icons – Line Style. Icons depicting different speaker and volume settings. The top row includes a speaker with a diagonal line. Icons depicting different speaker and volume settings. The top row includes a speaker with a diagonal line indicating mute, followed by increasing sound waves to suggest volume levels. The bottom row has variations including a speaker with a prohibition sign for no sound, and additional icons indicating volume adjustments or settings with symbols like an 'x' for off, '+' for increase, and '-' for decrease. These icons are simple, black, and designed for user interface purposes.
 Sign in